

Abstract
Exotic oxidation states of the first‐row transition metals have recently attracted much interest. In order to investigate the oxidation states of a series of iron–oxalate complexes, an aqueous solution of iron(III) nitrate and oxalic acid was studied by infrared free liquid matrix‐assisted laser desorption/ionization as well as ionspray mass spectrometry. Here, we show that iron is not only detected in its common oxidation states +II and +III, but also in its unusual oxidation state +I, detectable in both positive‐ion and in negative‐ion modes, respectively. Vibrational spectra of the gas phase anionic iron oxalate complexes [FeIII(C2O4)2]−, [FeII(C2O4)CO2]−, and [FeI(C2O4)]− were measured by means of infrared photodissociation spectroscopy and their structures were assigned by comparison to anharmonic vibrational spectra based on second‐order perturbation theory.
Keywords: IR-FL-MALDI, IRPD Spectroscopy, Iron Complexation, Iron(I), Unusual Oxidation State
Evidence for iron in its unusual oxidation state +I is found from a study on a series of iron–oxalate complexes in solution and involving a combination of infrared free liquid matrix‐assisted laser desorption/ionization mass spectrometry, cryogenic ion trap vibrational spectroscopy and ab initio calculations.
One of the most important classification concepts in chemistry is that of formal oxidation states.[ 1 , 2 ] The preparation and characterization of chemical compounds containing elements with unusual oxidation states is therefore of great interest to chemists.[ 2 , 3 ] The quest for the highest experimentally detected formal oxidation state is well documented. [4] Often exotic oxidation states may only be stabilized and observed in matrix‐isolation experiments. By far the most prominent iron oxidation states in aqueous solutions are FeII and FeIII, which are likewise primarily present in natural systems.[ 5 , 6 ] However, iron can exist in various other oxidation states including the coexistence and facile interconversion of these states, [7] which makes it particularly important not only in chemistry (e.g. heterogeneous catalysis), but also biology (e.g. enzymes) and materials science (e.g. ferroelectric materials, superconductors, etc.).[ 5 , 6 , 8 ] There has been some speculation about the formation of iron in its +I oxidation state, its stability, as well as its coordination features. Although coordination complexes of iron are ubiquitous, they are rarely found in the +I oxidation state and the coordination chemistry of FeI is therefore poorly understood, notably for low‐coordination complexes (4‐coordinate or lower). Reported FeI compounds are typically stabilized by bulky ligands.[ 8 , 9 ] However, the interest in such complexes, especially with low‐coordinate iron atoms, stems from their potential to exhibit unusual reactivities [5] and magnetic properties. [10] In the gas phase, the reactivity of atomic iron cations, FeI+, has been extensively studied, [11] while spectroscopic studies on FeI‐containing complexes are more scarce. [12] Iron oxidation numbers can be determined, for example, by Mössbauer spectroscopy in combination with mass spectrometry [13] or by X‐ray magnetic circular dichroism spectroscopy. [14]
In the present contribution we report on the formation of a two‐coordinate iron(I)–oxalate complex, namely [FeI(C2O4)]−, with iron in its formal oxidation state +I, which is stable for hours in aqueous solution. We identify it by mass spectrometry and use infrared photodissociation (IRPD) spectroscopy combined with ab initio electronic structure calculations to assign the gas phase structure of the isolated FeI–oxalate complex and its related species, [FeII(C2O4)CO2]− and [FeIII(C2O4)2]− unequivocally.
Adding oxalic acid (c=3.2 mmol L−1) to an aqueous solution of iron(III) nitrate (c=1.6 mmol L−1) yields a mixture containing various iron complexes. To characterize the composition of the solution we use infrared free‐liquid matrix‐assisted laser desorption/ionization mass spectrometry (IR‐FL‐MALDI‐MS), [15] which is considered an exceptionally soft ion desorption technique. [16]
Figure 1a shows the positive‐ion mode mass spectrum of the pure iron(III) nitrate solution in the m/z range from 86–96. Two iron‐containing species are identified at the corresponding m/z ratios, [FeIII(OH)2]+ and [FeII(OH)(H2O)]+. This assignment is confirmed by the observed isotopologue distribution, which reflects the natural isotope abundance of iron (6 % 54Fe, 92 % 56Fe, 2 % 57Fe). Note, the formation of FeII complexes, though FeIII was dissolved, is expected as the spontaneous reduction of FeIII to FeII is known to take place in aqueous environments. [17] The reduction is accompanied by a color change of the solution (yellow‐brown to yellow‐green). However, after adding an excess of oxalic acid to the iron(III/II)‐containing solution, we unexpectedly obtained the mass spectrum shown in Figure 1b. The relative intensities of the [FeIII(OH)2]+ species are significantly lower compared to the pure iron(III) nitrate solution. Moreover, a dominant signal at m/z=92 occurs which corresponds to an [FeI(H2O)2]+ complex indicating the presence of iron in its unusual oxidation state +I. Note, the larger fraction of iron in its reduced forms (FeII and FeI) is due to the presence of the oxalate dianion (C2O4 2−) which is a potent reducing agent.
Figure 1.
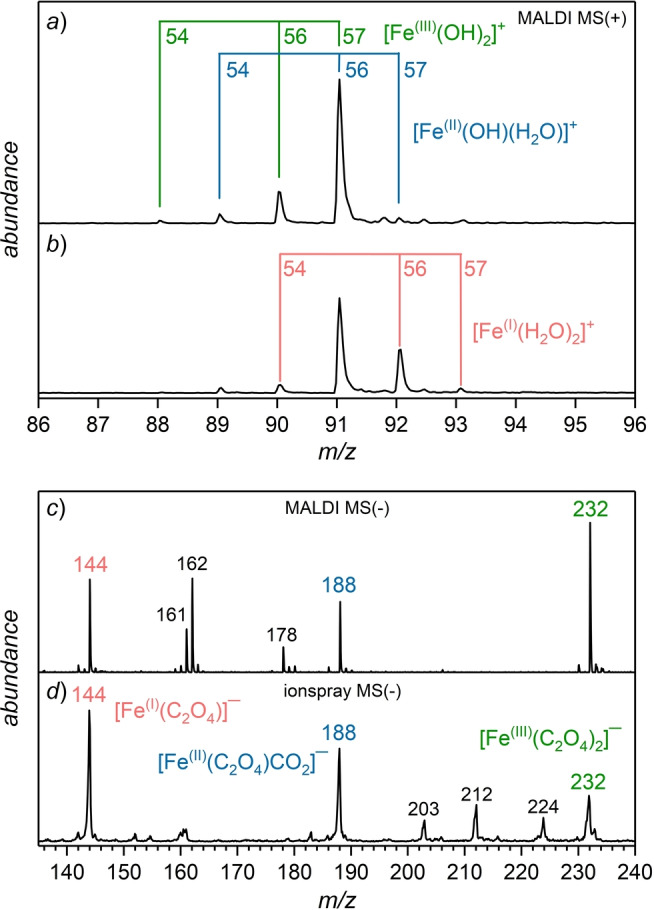
Positive‐ion mode IR‐FL‐MALDI mass spectrum of Fe(NO3)3 (c=1.6 mmol L−1) dissolved in water (a). After the addition of H2C2O4 (c=3.2 mmol L−1), a signal is detected corresponding to [FeI(H2O)2]+ (b). Negative‐ion mode IR‐FL‐MALDI mass spectrum of the solution featuring iron oxalate complexes at m/z=232, 188 and 144 with iron in the oxidation states +III, +II and +I (c). Negative‐ion mode ionspray mass spectrum of the same compounds (and concentrations), dissolved in water/methanol (2 : 1, vol %), measured using the Leipzig cryogenic ion trap triple mass spectrometer [18] (d). See Supporting Information, section S1 for experimental details and Table S1 for MS peak assignments.
Figure 1c shows the corresponding negative ion mode mass spectrum (m/z range: 135–240) of the solution. Six intense mass peaks are observed corresponding to iron complexes with iron in the oxidation states +I, +II and +III. The three signals at m/z=144, 188 and 232 are attributed to the iron oxalate complexes [FeI(C2O4)]−, [FeII(C2O4)CO2]− and [FeIII(C2O4)2]−, respectively. Hence, the intense m/z=144 peak provides additional support for the presence of an FeI species. The other prominent signals in the spectrum correspond to mixed iron oxalate‐water/hydroxide complexes (for assignment see Supporting Information, Table S1).
To gauge if the formation of the FeI complexes is due to the low pH (≈4) and/or the presence of the nitrate counter ion, respectively, we performed two sets of experiments where iron was provided as iron(III) chloride (FeCl3) and oxalate in the form of ammonium oxalate ((NH4)2C2O4). These experiments did not yield any substantially different results. Thus, we conclude that the formation of FeI is independent of the iron counter ion and the form in which oxalate is provided. Moreover, since the FeI complexes only occur after the addition of oxalic acid, we further conclude that the reducing strength of the oxalate dianion is required to obtain iron in its rare oxidation state +I.
To confirm the presence of FeI complexes also spectroscopically, we subsequently investigated the same solution using gas phase ion vibrational spectroscopy. This required using the Leipzig cryogenic ion trap triple mass spectrometer, [18] which is equipped with a nano‐electrospray ionization source. This different type of source was operated in ionspray mode to ensure soft ion desorption conditions. Likewise, the resulting negative ion mode mass spectrum (see Figure 1d) shows the same three signals at m/z=144, 188 and 232 as in Figure 1c, corresponding to the three anionic iron oxalate complexes [FeI(C2O4)]−, [FeII(C2O4)CO2]−, and [FeIII(C2O4)2]−. The detection of the iron oxalate species using two different soft desorption techniques (ionspray and IR‐FL‐MALDI) confirms that these complexes are indeed present in solution and not produced as artifacts of the transfer process from solution into the gas phase.
On the basis of the aforementioned findings, we hypothesize the following route leading to the formation of the anionic FeI complexes:
| (1) |
In order to characterize the structure of these complexes, we recorded their gas phase vibrational spectrum in the spectral range 700–2000 cm−1 by means of infrared photodissociation (IRPD) spectroscopy. [18] The IRPD spectra (Figure 2) of the complexes cover the spectral regions of the antisymmetric (1600–1900 cm−1) and symmetric (1080–1340 cm−1) O−C−O stretching modes, as well as several O−C−O bending modes of the ligands (700–900 cm−1).
Figure 2.
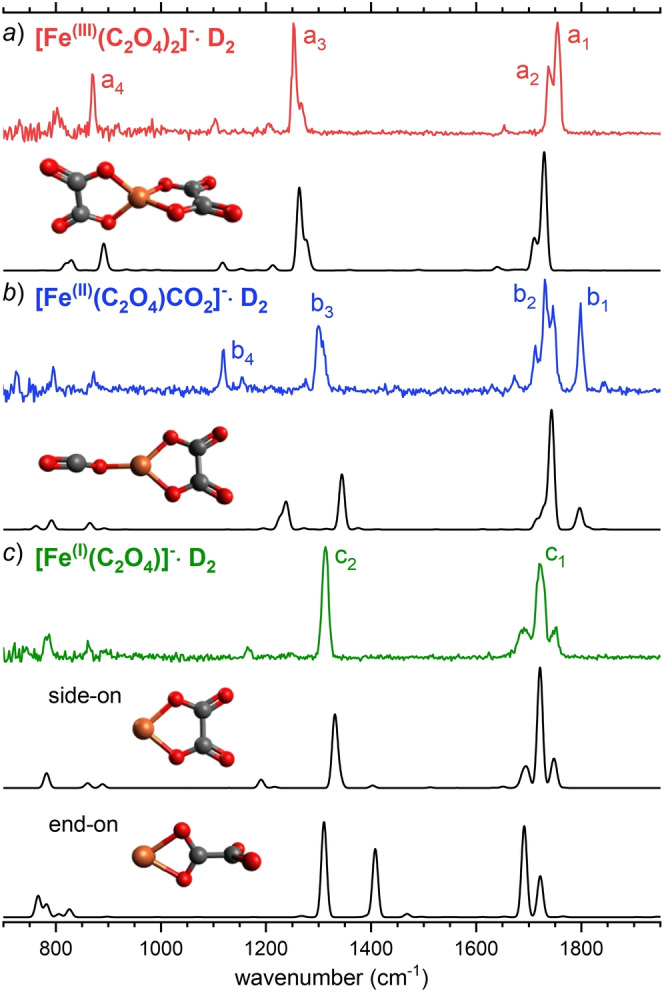
Comparison of the experimental IRPD spectra (see Supporting Information, section S1.2 for experimental details) of D2‐tagged [FeIII(C2O4)2]− (a), [FeII(C2O4)CO2]− (b) and [FeI(C2O4)]− (c) with MP2/def2‐SVPD VPT2 IR spectra (see Supporting Information, section S1.3 for computational details) of the (untagged) minimum‐energy isomers (with spin multiplicity 6). The corresponding structures are also shown. For band assignment see text and Supporting Information, Table S5.
We then calculated IR spectra using ab initio methods. These IR spectra were derived from anharmonic vibrational frequencies and intensities for the structures shown in Figure 2. By doing so, we were able to identify the gas phase structures of the iron complexes and to assign the experimentally obtained bands to individual vibrational modes (for detailed band assignment see Supporting Information, section S7). Comparison of the minimum‐energy structures, relative energies and IR spectra (MP2 vs. B3LYP and harmonic vs. anharmonic) of energetically low‐lying isomers in different spin states can be found in the Supporting Information, sections S3–S7.
Figure 2a shows the comparison of the IRPD spectrum of D2‐tagged [FeIII(C2O4)2]− to the MP2/def2‐SVPD VPT2 IR spectrum (including anharmonic contributions) of the lowest‐energy structure (C 2v symmetry, see Figure 2a). The position and relative intensities of the four characteristic IRPD bands, labeled a1–a4, as well as the smaller spectral features, are satisfactorily reproduced by the anharmonic IR spectrum. In brief, the intense absorptions centered at 1755 cm−1 (a1) and 1252 cm−1 (a3) correspond to antisymmetric and symmetric O−C−O stretching modes, respectively. Band a2 is a combination band with significant oscillator strength and a4 results from an O−C−O bending mode of the ligands.
Figure 2b compares the IRPD spectrum of the D2‐tagged [FeII(C2O4)CO2]− complex to the anharmonic IR spectrum of the lowest‐energy isomer. The IRPD spectrum reveals four characteristic bands, labeled b1–b4, as well as some weaker signals. These are reproduced by the anharmonic IR spectrum of [FeII(C2O4)CO2]−, but not as well as for [FeIII(C2O4)2]−. This is due to a marked influence of the multiplicity on the geometry of the FeII complex, in particular on the Fe⋅⋅⋅OCO dihedral angle, and hence the corresponding IR signature (see Supporting Information, section S5), much more so for the FeII complex than for the other two systems studied here (see Supporting Information, sections S4 and S6). In addition, anharmonic effects are also more pronounced (see Supporting Information, section S7). However, the agreement between experimental and predicted IR spectrum of the most stable isomer is substantially better than for the spectra of the higher‐energy isomers (see Supporting Information, section S5) and we therefore assign the structure accordingly.
In Figure 2c, the IRPD spectrum of the D2‐tagged [FeI(C2O4)]− complex is compared to the calculated anharmonic IR spectra of two low‐energy isomers, in which the oxalate ligand is coordinated to iron either in a side‐on, or in an end‐on fashion. The predicted IR spectrum of the lowest‐energy, side‐on isomer agrees particularly well with the experimental spectrum, with the two intense bands centered at 1719 cm−1 (c1) and 1313 cm−1 (c2) corresponding to antisymmetric and symmetric O−C−O stretching vibrations, respectively. In contrast, the IR spectrum of the end‐on isomer, which is 98 kJ mol−1 higher in energy, is not as good of a fit. In particular, the predicted prominent band at 1394 cm−1 arising from excitation of an antisymmetric O−C−O stretching mode (of the bound −CO2 moiety) is not present in the experimental spectrum. We therefore conclude that the structure of [FeI(C2O4)]− is the one, in which the oxalate dianion coordinates to the FeI center in a side‐on fashion.
The nature of the iron oxidation state in these oxalate complexes is substantiated by an analysis of the Bader charges, see Table 1: the atomic charge on Fe decreases by a factor of three between [FeIII(C2O4)2]− and [FeI(C2O4)]−. This is in good agreement with the reduction of the formal oxidation states from FeIII to FeI in the respective complexes. These findings are further corroborated by the calculated atomic charges derived from a natural population analysis (NPA), which can be found in the Supporting Information, section S8.
Table 1.
Bader charge on iron in the energetically lowest‐lying isomers of [FeIII(C2O4)2]−, [FeII(C2O4)CO2]− and [FeI(C2O4)]−, all with spin multiplicity of M=6.
|
Complex |
Oxidation state |
Bader charge |
|---|---|---|
|
[FeIII(C2O4)2]− |
3 |
1.8 |
|
[FeII(C2O4)CO2]− |
2 |
1.3 |
|
[FeI(C2O4)]−, side‐on isomer |
1 |
0.6 |
|
[FeI(C2O4)]−, end‐on isomer |
1 |
0.6 |
In summary, we have shown that the addition of oxalic acid to an iron nitrate containing solution yields a series of anionic iron oxalate complexes including complexes with iron in its unusual oxidation state +I. The hypothesized pathway for the reduction of iron through oxalate proceeds via the release of neutral CO2. It involves the anionic complexes [FeIII(C2O4)2]−, [FeII(C2O4)CO2]− and [FeI(C2O4)]−, which have been identified and structurally characterized by means of IRPD spectroscopy. The present study demonstrates that aqueous iron(III) is reduced to iron(I) in the presence of oxalates, forming a two‐coordinate iron oxalate complex. It is presumably highly reactive and could play a role in catalysis [19] or in the field of atmospheric chemistry where both, iron and oxalates, are ubiquitous. [20]
Conflict of interest
The authors declare no conflict of interest.
Supporting information
As a service to our authors and readers, this journal provides supporting information supplied by the authors. Such materials are peer reviewed and may be re‐organized for online delivery, but are not copy‐edited or typeset. Technical support issues arising from supporting information (other than missing files) should be addressed to the authors.
Supporting Information
Acknowledgements
K.R.A. acknowledges instrumental support from the Fritz‐Haber‐Institute of the Max‐Planck‐Society. N.V. and T.H. thank ZIH Dresden for providing computational resources. B.A. and F.S. thank the German Science Foundation (DFG) for funding within the Research Unit FOR 2177. Open Access funding enabled and organized by Projekt DEAL.
M. Mayer, N. Vankova, F. Stolz, B. Abel, T. Heine, K. R. Asmis, Angew. Chem. Int. Ed. 2022, 61, e202117855; Angew. Chem. 2022, 134, e202117855.
Contributor Information
Prof. Dr. Bernd Abel, Email: bernd.abel@uni-leipzig.de.
Prof. Dr. Thomas Heine, Email: thomas.heine@tu-dresden.de.
Prof. Dr. Knut R. Asmis, Email: knut.asmis@uni-leipzig.de.
Data Availability Statement
The data that support the findings of this study are available from the corresponding author upon reasonable request.
References
- 1.
- 1a. Lei H., Guo J.-D., Fettinger J. C., Nagase S., Power P. P., J. Am. Chem. Soc. 2010, 132, 17399–17401; [DOI] [PubMed] [Google Scholar]
- 1b. Walsh A., Sokol A. A., Buckeridge J., Scanlon D. O., Catlow C. R. A., Nat. Mater. 2018, 17, 958–964. [DOI] [PubMed] [Google Scholar]
- 2. Wang G., Zhou M., Goettel J. T., Schrobilgen G. J., Su J., Li J., Schlöder T., Riedel S., Nature 2014, 514, 475–477. [DOI] [PubMed] [Google Scholar]
- 3.
- 3a. Lu J.-B., Jian J., Huang W., Lin H., Li J., Zhou M., Phys. Chem. Chem. Phys. 2016, 18, 31125–31131; [DOI] [PubMed] [Google Scholar]
- 3b. Lin J., Zhang S., Guan W., Yang G., Ma Y., J. Am. Chem. Soc. 2018, 140, 9545–9550. [DOI] [PubMed] [Google Scholar]
- 4. Yu H. S., Truhlar D. G., Angew. Chem. Int. Ed. 2016, 55, 9004–9006; [DOI] [PubMed] [Google Scholar]; Angew. Chem. 2016, 128, 9150–9152. [Google Scholar]
- 5. Bauer I., Knölker H.-J., Chem. Rev. 2015, 115, 3170–3387. [DOI] [PubMed] [Google Scholar]
- 6. Fürstner A., ACS Cent. Sci. 2016, 2, 778–789. [DOI] [PMC free article] [PubMed] [Google Scholar]
- 7. Dedushenko S. K., Perfil'ev Y. D., Chuev M. A., Afanas'ev A. M., Russ. J. Inorg. Chem. 2010, 55, 942–949. [Google Scholar]
- 8. Werncke C. G., Bunting P. C., Duhayon C., Long J. R., Bontemps S., Sabo-Etienne S., Angew. Chem. Int. Ed. 2015, 54, 245–248; [DOI] [PubMed] [Google Scholar]; Angew. Chem. 2015, 127, 247–250. [Google Scholar]
- 9. Ouyang Z., Du J., Wang L., Kneebone J. L., Neidig M. L., Deng L., Inorg. Chem. 2015, 54, 8808–8816. [DOI] [PMC free article] [PubMed] [Google Scholar]
- 10. Craig G. A., Murrie M., Chem. Soc. Rev. 2015, 44, 2135–2147. [DOI] [PubMed] [Google Scholar]
- 11.
- 11a. Böhme D. K., Schwarz H., Angew. Chem. Int. Ed. 2005, 44, 2336–2354; [DOI] [PubMed] [Google Scholar]; Angew. Chem. 2005, 117, 2388–2406; [Google Scholar]
- 11b. Roithová J., Schröder D., Chem. Rev. 2010, 110, 1170–1211; [DOI] [PubMed] [Google Scholar]
- 11c. van der Linde C., Hemmann S., Höckendorf R. F., Balaj O. P., Beyer M. K., J. Phys. Chem. A 2013, 117, 1011–1020; [DOI] [PubMed] [Google Scholar]
- 11d. Troiani A., Rosi M., Garzoli S., Salvitti C., de Petris G., Angew. Chem. Int. Ed. 2015, 54, 14359–14362; [DOI] [PubMed] [Google Scholar]; Angew. Chem. 2015, 127, 14567–14570. [Google Scholar]
- 12.
- 12a. MacAleese L., Maître P., Mass Spectrom. Rev. 2007, 26, 583–605; [DOI] [PubMed] [Google Scholar]
- 12b. Roithová J., Bakker J. M., Mass Spectrom. Rev. 2021, 10.1002/mas.21698; [DOI] [PMC free article] [PubMed] [Google Scholar]
- 12c. Kurikawa T., Takeda H., Hirano M., Judai K., Arita T., Nagao S., Nakajima A., Kaya K., Organometallics 1999, 18, 1430–1438; [Google Scholar]
- 12d. Walker N. R., Walters R. S., Duncan M. A., New J. Phys. 2005, 29, 1495–1503; [Google Scholar]
- 12e. Wang L., Wang G., Qu H., Wang C., Zhou M., J. Phys. Chem. A 2014, 118, 1841–1849; [DOI] [PubMed] [Google Scholar]
- 12f. Citir M., Altinay G., Austein-Miller G., Metz R. B., J. Phys. Chem. A 2010, 114, 11322–11329. [DOI] [PubMed] [Google Scholar]
- 13. Loup J., Parchomyk T., Lülf S., Demeshko S., Meyer F., Koszinowski K., Ackermann L., Dalton Trans. 2019, 48, 5135–5139. [DOI] [PubMed] [Google Scholar]
- 14.
- 14a. Kowalska J. K., Nayyar B., Rees J. A., Schiewer C. E., Lee S. C., Kovacs J. A., Meyer F., Weyhermüller T., Otero E., DeBeer S., Inorg. Chem. 2017, 56, 8147–8158; [DOI] [PMC free article] [PubMed] [Google Scholar]
- 14b. Niemeyer M., Hirsch K., Zamudio-Bayer V., Langenberg A., Vogel M., Kossick M., Ebrecht C., Egashira K., Terasaki A., Möller T., et al., Phys. Rev. Lett. 2012, 108, 57201. [DOI] [PubMed] [Google Scholar]
- 15.
- 15a. Appun J., Stolz F., Naumov S., Abel B., Schneider C., J. Org. Chem. 2018, 83, 1737–1744; [DOI] [PubMed] [Google Scholar]
- 15b. Charvat A., Bogehold A., Abel B., Aust. J. Chem. 2006, 59, 81–103; [Google Scholar]
- 15c. Charvat A., Lugovoj E., Faubel M., Abel B., Eur. Phys. J. D 2002, 20, 573–582; [Google Scholar]
- 15d. Charvat A., Lugovoj E., Faubel M., Abel B., Rev. Sci. Instrum. 2004, 75, 1209–1218; [Google Scholar]
- 15e. Urban R., Fischer T. G., Charvat A., Wink K., Krafft B., Ohla S., Zeitler K., Abel B., Belder D., Anal. Bioanal. Chem. 2021, 413, 1561–1570; [DOI] [PMC free article] [PubMed] [Google Scholar]
- 15f. Wiederschein F., Vohringer-Martinez E., Beinsen A., Postberg F., Schmidt J., Srama R., Stolz F., Grubmuller H., Abel B., Phys. Chem. Chem. Phys. 2015, 17, 6858–6864. [DOI] [PubMed] [Google Scholar]
- 16. Charvat A., Abel B., Phys. Chem. Chem. Phys. 2007, 9, 3335–3360. [DOI] [PubMed] [Google Scholar]
- 17.
- 17a. Faust B. C., Zepp R. G., Environ. Sci. Technol. 1993, 27, 2517–2522; [Google Scholar]
- 17b. Ngah W. S., Ab Ghani S., Kamari A., Bioresour. Technol. 2005, 96, 443–450. [DOI] [PubMed] [Google Scholar]
- 18. Heine N., Asmis K. R., Int. Rev. Phys. Chem. 2015, 34, 1–34. [Google Scholar]
- 19.
- 19a. Samuel P. P., Mondal K. C., Amin Sk N., Roesky H. W., Carl E., Neufeld R., Stalke D., Demeshko S., Meyer F., Ungur L., et al., J. Am. Chem. Soc. 2014, 136, 11964–11971; [DOI] [PubMed] [Google Scholar]
- 19b. Lu C. C., Saouma C. T., Day M. W., Peters J. C., J. Am. Chem. Soc. 2007, 129, 4–5. [DOI] [PMC free article] [PubMed] [Google Scholar]
- 20. Paris R., Desboeufs K. V., Atmos. Chem. Phys. 2013, 13, 4895–4905. [Google Scholar]
Associated Data
This section collects any data citations, data availability statements, or supplementary materials included in this article.
Supplementary Materials
As a service to our authors and readers, this journal provides supporting information supplied by the authors. Such materials are peer reviewed and may be re‐organized for online delivery, but are not copy‐edited or typeset. Technical support issues arising from supporting information (other than missing files) should be addressed to the authors.
Supporting Information
Data Availability Statement
The data that support the findings of this study are available from the corresponding author upon reasonable request.