

Abstract
Objective
To ascertain the financial impact associated with the underutilization of preventive dental care for adults enrolled in Medicaid.
Methods
We used adult claims data for patients aged 21–64 in the IBM Watson Marketscan Medicaid database. Enrollees were included if they had at least one dental claim in 2019 and were continuously enrolled between 2014 and 2019. We then evaluated the costs of their dental care in 2019, based on the number of years of preventive dental care they received between 2014 and 2018. We also assessed Emergency Department (ED) utilization for dental conditions, oral surgeries, and dental‐related opioid prescriptions.
Results
The average Medicaid enrollee with five continuous years of preventive care prior to 2019 experienced 43% lower costs than an individual who received no preventive dental care at all. Most of the savings were a result of fewer oral surgeries. A Medicaid enrollee with no preventive dental visits was eight times more likely to have an ED visit for a nontraumatic dental condition (NTDC), seven times more likely to have oral surgery and six times more likely to receive a dental‐related opioid prescription compared to those who had a dental prevention visit every year in the 5‐year lookback period.
Conclusions
Regular preventive dental care in the lookback period was associated with significant savings in overall dental care costs when compared to dental care costs for those individuals who received no or few preventive visits. Prior preventive dental care was also associated with lower rates of ED‐NTDC utilization, oral surgery, and dental‐related opioid prescriptions.
Keywords: dental costs, dental utilization, dentistry, preventive dentistry
INTRODUCTION
Preventive dental care is essential to maintaining good oral health and keeping teeth healthy throughout the lifespan. Preventive dentistry combines oral examinations, teeth cleaning, preventive procedures such as fluoride applications and sealants, education and anticipatory guidance, and diagnostic procedures. The American Dental Association (ADA) recommends at least one preventive dental cleaning per year for low‐risk adults, while a higher frequency of cleanings is advised for high‐risk individuals [1].
Medicaid coverage of dental services for adults increases their likelihood of having a dental visit each year [2]. Adults who utilize this dental benefit tend to receive more cleanings and tooth saving procedures while needing fewer extractions than those who do not regularly use their dental benefit [2]. This is also true for Medicaid‐enrolled children. Previous studies have found that Medicaid‐enrolled children who had an early preventive dental visit were more likely to utilize preventive services and experience better oral health outcomes, while the overall cost of their care was reduced [3, 4]. Furthermore, in states that expanded Medicaid between 2012 and 2014 to offer an adult dental benefit (ADB), dental emergency department (ED) visits decreased by 14%. In comparison, states that did not provide a Medicaid adult dental benefit experienced an increase in dental ED visits [5].
Millions of Americans face financial barriers to dental care. A 2016 study revealed that working‐age adults were much more likely to cite cost as a barrier to obtaining dental services than they were for medical care, prescription drugs, mental health care, or eyeglasses [6]. Because Medicaid programs in many states offer only limited or emergency dental services, cost can impede the ability of many low‐income Americans to secure care. In the 2016 analysis, nearly one in four working‐age adults with incomes below 100 percent of the federal poverty level reported they had not obtained needed dental care during the previous 12 months because of cost [6].
When patients do not receive regular dental care, they are more likely to rely on hospital‐based emergency department (Eds) for treatment of urgent dental needs [5, 7]. In previous periods of financial recession, some states chose to eliminate the ADB in Medicaid. With this change, patients shift from seeking regular dental care to receiving more emergency care, and exhibit more dental disease [8]. Limited adult dental coverage also has the same effect on access to dental care. Some state Medicaid programs like Hawaii only offer an ADB with limited dental services, which has led many adults to seek treatment for preventable oral health conditions in hospital settings [9]. Without a comprehensive ADB, individuals are faced with challenges to secure needed dental care. The absence of appropriate coverage can also make adults more vulnerable to tooth decay and other forms of oral disease that can negatively affect their overall health [10].
Patients with low income and those from minority populations who have the most dental needs also have the least access to dental care [11]. Those who lack a dental home may visit hospital EDs to address their dental pain and related conditions. Hospitals typically respond to ED visits with palliative care and do not address the root cause of the pain [12]. Sociodemographic factors such as poverty, race, ethnicity, unemployment and educational attainment have an impact on the rate of dental utilization in young adults [13]. The demographic subgroups at highest risk for ED visits related to dental conditions include those aged 25–44 years, the uninsured, Medicaid participants, and residents living in low‐income areas [14].
While the connections between preventive dental care and better oral health outcomes are clear from the existing literature, there has been relatively little research directly linking preventive dental care to the annual cost of oral health care among adults. We explored these connections among Medicaid‐enrolled adults by assessing the impact of routine preventive dental care utilization on dental cost and treatment. We defined underutilizers as adult patients who did not receive preventive dental care for at least one calendar year in the previous 5 years, which is referred to as the “lookback period”. We assessed underutilization during the time period between 2014 and 2019. The goal of this study was to examine the potential benefits of regular preventive care related to dental costs, treatment types, dental‐related opioid prescriptions, oral surgery, and ED visits for nontraumatic dental conditions (NTDC).
DATA AND METHODS
Data
We conducted a retrospective descriptive study to examine the relationship between frequency of preventive dental care and subsequent dental treatment costs, occurrence of oral surgeries, ED visits for NTDC, dental‐related opioid prescriptions and other types of dental treatment. The analysis is restricted to adult Medicaid enrollees between the ages of 21 and 64 who received at least one dental treatment in 2019 and were continuously enrolled between 2014 and 2019. This research was determined to be exempt from review by the Western Institutional Review Board.
We used de‐identified medical and dental claims data from between January 1, 2014 and December 31, 2019 from the IBM Watson MarketScan Multi‐State Medicaid Database core data set [15]. This database contains all dental and medical claims from 13 de‐identified state Medicaid programs along with detailed member enrollment information. This database has been used in hundreds of peer‐reviewed publications and is generally accepted as nationally representative of the Medicaid population. However, since the data is not drawn from a random sample, findings are not guaranteed to generalize to the larger U.S. population [15].
Cohort
We defined 2019 as the measurement year in which we examined the outcomes of interest; the years 2014 through 2018 were examined as the lookback period. With regard to Medicaid enrollment, this period generally refers to the 60‐month (5 years) retrospective period from the date an applicant applies for Medicaid to determine whether their asset limit in the time prior to application meets the Medicaid eligibility criteria. Our cohort was limited to individuals who were continuously enrolled during this period with no breaks in Medicaid enrollment to ensure that individuals could have been seen by a dentist through the lookback period as well as the measurement year.
Enrollees were categorized according to the number of years in which they received preventive dental care prior to 2019. For example, individuals with 0‐year prevention had no preventive care from 2014 to 2018 but had at least one dental service in 2019. A 5‐year prevention enrollee had received preventive care each year from 2014 through 2018 as well as having had received dental care in 2019.
Variables
We defined dental procedure groups based on the American Dental Association's Code on Dental Procedures and Nomenclature (CDT) categories. Procedure codes were selected related to Prevention (D1000–D1999), Minor Restorations (D2000–D2664), Major Restorations (D2665–D3999), Periodontic (D4000–D4999), Prosthodontic (D5000–D6999), Oral Surgery (D7000–D7999), and Adjunctive General (D9000–D9999).
We defined ED‐NTDC visits by first identifying ED visits based on IBM Watson guidelines. To determine that an ED visit was prompted by an NTDC, we matched International Classification of Disease, 9th and 10th revisions (ICD‐9 and ICD‐10) codes with a list of dental‐related diagnosis codes provided by the Association of State and Territorial Dental Directors (ASTDD) [16]. These codes can be found in Appendix A.
Defining dental‐related opioid prescriptions is complicated by the fact that prescriptions do not include provider information. For this reason, we classified an opioid prescription as dental‐related if an enrollee received a dental service and a opioid prescription on the same day. A prescription, in turn, was classified as an opioid if it had a Morphine Milligram Equivalent (MME) greater than zero [17].
To examine the effects of health and lifestyle factors on the variables of interest, we incorporated three Elixhauser comorbidities [18]: hypertension, diabetes, and substance use. We created a fourth variable for nicotine use based on the presence of ICD10 code ‘Z720’ or any ICD10 code that begins with ‘F17F17’. All four of these comorbidities were obtained from the measurement year, 2019.
Methods
We performed descriptive statistics on the study population which we stratified by number of years of preventive visits, sex, race, and age group. We also analyzed average paid amounts for dental claims in 2019 to evaluate whether prior prevention was related to cost savings during the measurement year.
We used three logistic regression models to assess the impact of preventive dental visits on the probability of a Medicaid beneficiary receiving an oral surgical treatment, an ED‐NTDC visit or a dental‐related opioid prescription. We also employed a multinomial logistic regression model to determine the probability that an individual received a particular preventive dental treatment. Finally, we utilized a Poisson model to measure the impact that the number of years in which dental preventive care was received had on total dental spending in 2019. In each model, we controlled for sex, race, age group, and four comorbidities: hypertension, diabetes, drug abuse and nicotine use. All comorbidities except for nicotine use are Elixhauser comorbidities. The comorbidities were assessed during the measurement year 2019. While White tests do not indicate extreme heteroskedasticity, all regression models do include Eicker‐Huber‐White standard errors to increase the likelihood of unbiased estimates.
All analyses were performed using SAS 9.4.
RESULTS
Figure 1 illustrates our selection criteria for the study cohort. Our data source contained 4.67 million adults who were Medicaid members in 2019, although it did not provide information on how many members resided in states with a Medicaid ADB. Of these members, 736,736 received at least one dental service in 2019. Among these enrollees, 185,602 had 6 years of continuous Medicaid enrollment from 2014 through 2019, accounting for 25% of the entire Medicaid‐enrolled adult population that had a dental service in 2019. This represented the final cohort for our analysis.
FIGURE 1.
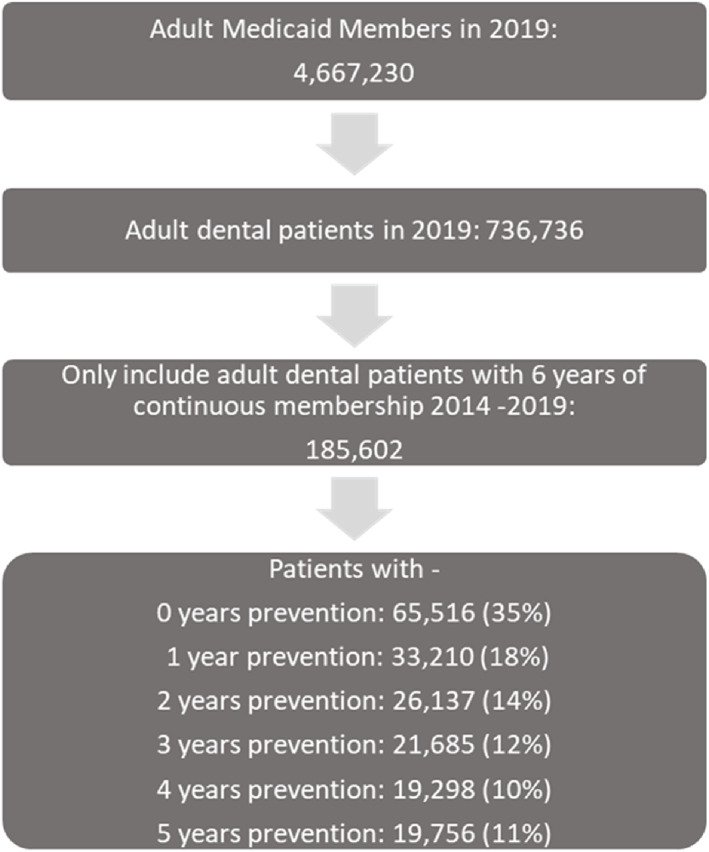
Selection criteria for the study population. This figure shows the selection criteria for our study population. Years prevention is based on the number of years in the lookback period that a patient received a preventive service [Color figure can be viewed at wileyonlinelibrary.com]
A description of the study population is shown in Table 1. Our 2019 cohort was 68% female, higher than in the overall adult Medicaid population, where 58% are female [19]. Our study sample was 58% White, 31% Black and 3% Hispanic with the rest either having an “other” or unreported race. The age distribution of our study group trended slightly older than the overall enrolled population: 32% of our study group was aged 51–64 compared to 24% for the adult dental Medicaid population in 2019.
TABLE 1.
Summary statistics of study population
| Years prevention | Total | ||||||
|---|---|---|---|---|---|---|---|
| 0 | 1 | 2 | 3 | 4 | 5 | ||
| Patients | 65,516 (35%) | 33,210 (18%) | 26,137 (14%) | 21,685 (12%) | 19,298 (10%) | 19,756 (11%) | 185,602 (100%) |
| Sex | |||||||
| Male | 22,044 (34%) | 9733 (29%) | 7687 (29%) | 6742 (31%) | 6327 (33%) | 7334 (37%) | 59,867 (32%) |
| Female | 43,472 (66%) | 23,477 (71%) | 18,450 (71%) | 14,943 (69%) | 12,971 (67%) | 12,422 (63%) | 125,735 (68%) |
| Race | |||||||
| White | 35,080 (54%) | 18,945 (57%) | 15,393 (59%) | 13,175 (61%) | 12,336 (64%) | 13,396 (68%) | 108,325 (58%) |
| Black | 23,634 (36%) | 10,994 (33%) | 8032 (31%) | 6267 (29%) | 4967 (26%) | 4423 (22%) | 58,317 (31%) |
| Hispanic | 1132 (2%) | 904 (3%) | 814 (3%) | 690 (3%) | 634 (3%) | 610 (3%) | 4784 (3%) |
| Other | 5670 (8%) | 1767 (7%) | 1898 (7%) | 1553 (7%) | 1361 (7%) | 1327 (7%) | 14,176 (8%) |
| Age group | |||||||
| 21–30 | 10,041 (15%) | 7864 (24%) | 6281 (24%) | 5135 (24%) | 4176 (22%) | 3974 (20%) | 37,471 (20%) |
| 31–40 | 16,084 (25%) | 9462 (28%) | 7492 (29%) | 5886 (27%) | 5034 (26%) | 4738 (24%) | 48,696 (26%) |
| 41–50 | 13,947 (21%) | 6850 (21%) | 5463 (21%) | 4686 (22%) | 4315 (22%) | 4534 (23%) | 39,795 (21%) |
| 51–64 | 25,444 (39%) | 9034 (27%) | 6901 (26%) | 5978 (28%) | 5773 (30%) | 6510 (33%) | 59,640 (32%) |
Note: Percentages are all row percentages with the exception of the Total column, where percentages are column percentages.
Our primary stratification was by years of prevention during the lookback period. Table 1 shows that 35% (n = 65,516) of our sample received no preventive dental care in the 5 years preceding 2019. Meanwhile, 18% received 1 year of prevention (n = 32,210), 14% received 2 years (n = 26,137), 12% received 3 years (n = 21,685), 10% received 4 years (n = 19,298) and 11% of the cohort received prevention in each of the 5 years of the lookback period (n = 19,756).
Appendix B reveals that Black Medicaid enrollees were half (OR = 0.49|CI = 0.47–0.51) as likely as White beneficiaries to have had 5 years of prevention. Those with nicotine use had a 30% lower (OR = 0.30|CI = 0.28–0.31) likelihood of having had 5 years of prevention compared to those who did not use nicotine‐containing products.
Table 2 and Appendix C show an inverse relationship between the number of years of preventive care that an enrollee received in the 5‐year lookback period and the average dental cost for an adult enrollee. A Medicaid beneficiary who had not received any preventive care in the five previous years had an average dental care cost of $464 in 2019. One year of prevention was associated with a 100% lower average cost of dental care in 2019 ($417). Enrollees with 5 years of prevention had an average cost of dental care in 2019 of $263, 43% lower than the cost for 0‐year prevention individuals.
TABLE 2.
Average dental cost savings of preventive dental care: Total and by sex, race, and age
| 1 year prevention | 2 years prevention | 3 years prevention | 4 years prevention | 5 years prevention | |
|---|---|---|---|---|---|
| All patients | $46.73 (10%) | $82.04 (18%) | $131.39 (28%) | $169.6 (37%) | $200.86 (43%) |
| Sex | |||||
| Male | $67.96 (14%) | $114.15 (23%) | $172.65 (35%) | $208.69 (43%) | $239.35 (49%) |
| Female | $35.77 (8%) | $66.77 (15%) | $112.1 (25%) | $150.26 (33%) | $180.14 (40%) |
| Race | |||||
| White | $68.15 (13%) | $113.71 (22%) | $170.83 (34%) | $215.14 (42%) | $251.09 (49%) |
| Black | $31.58 (8%) | $48.39 (12%) | $88.9 (22%) | $105.54 (27%) | $115.86 (29%) |
| Hispanic | $118.01 (26%) | $80.97 (18%) | $74.71 (17%) | $131.04 (29%) | $161.25 (36%) |
| Other | $32.34 (7%) | $107.81 (24%) | $117.87 (26%) | $197.34 (44%) | $194.84 (43%) |
| Age group | |||||
| 21–30 | $11.97 (3%) | $43.31 (10%) | $95.48 (23%) | $121.17 (29%) | $157.23 (38%) |
| 31–40 | $44.8 (10%) | $72.94 (16%) | $127.48 (28%) | $177.56 (39%) | $211.4 (47%) |
| 41–50 | $68.36 (14%) | $110.08 (22%) | $147.18 (30%) | $194.4 (40%) | $239.05 (49%) |
| 51–64 | $41.26 (9%) | $82.27 (17%) | $134.17 (28%) | $165.86 (35%) | $184.31 (39%) |
Note: This table calculates the savings as seen in our study population of dental costs in the measurement year as compared with individuals that no preventive care in the lookback period.
Results of a Poisson regression model show that each additional year of prevention was associated with lower dental care costs in 2019 (Table 3). Average costs for a 5‐year prevention enrollee, after adjusting for covariates, were $188 less than a for 0‐year prevention beneficiary.
TABLE 3.
Model on total dental costs during the measurement year 2019
| Parameter | Estimate | Standard error | Z | p Value | Predicted cost | Lower CI of predicted cost | Upper CI of predicted cost |
|---|---|---|---|---|---|---|---|
| Intercept | 5.8732 | 0.0204 | 288.24 | <0.0001 | |||
| Years prevention | |||||||
| 0 years | 0.4959 | 0.0108 | 45.75 | <0.0001 | 481.55 | 471.77 | 491.53 |
| 1 year | 0.3672 | 0.0118 | 31.19 | <0.0001 | 423.41 | 413.82 | 433.24 |
| 2 years | 0.2924 | 0.0126 | 23.25 | <0.0001 | 392.91 | 383.18 | 402.88 |
| 3 years | 0.1928 | 0.0126 | 15.36 | <0.0001 | 355.66 | 346.83 | 364.71 |
| 4 years | 0.0694 | 0.0134 | 5.16 | <0.0001 | 314.36 | 305.87 | 323.08 |
| 5 years | Ref | 293.28 | 285.86 | 300.9 | |||
| Sex | |||||||
| Male | Ref | 371.88 | 364.04 | 379.89 | |||
| Female | −0.0023 | 0.0073 | −0.31 | 0.7528 | 371.03 | 363.8 | 378.41 |
| Race | |||||||
| White | Ref | 399.72 | 393.7 | 405.84 | |||
| Black | −0.1468 | 0.007 | −20.87 | <0.0001 | 345.16 | 339.43 | 351 |
| Hispanic | −0.0973 | 0.0196 | −4.95 | <0.0001 | 362.66 | 348.53 | 377.37 |
| Other | −0.0493 | 0.021 | −2.34 | 0.0191 | 380.48 | 364.62 | 397.04 |
| Age group | |||||||
| 21–30 | Ref | 364.95 | 356.14 | 373.98 | |||
| 31–40 | 0.0001 | 0.0101 | 0.01 | 0.9942 | 364.98 | 356.86 | 373.28 |
| 41–50 | 0.0258 | 0.0107 | 2.4 | 0.0162 | 374.51 | 366.08 | 383.12 |
| 51–64 | 0.0447 | 0.0103 | 4.32 | <0.0001 | 381.65 | 373.81 | 389.65 |
| Elixhauser comorbidities | |||||||
| Hypertension | −0.0415 | 0.0081 | −5.1 | <0.0001 | 379.25 | 371.33 | 387.34 |
| Diabetes | −0.0273 | 0.0093 | −2.94 | 0.0033 | 376.56 | 367.82 | 385.51 |
| Substance use | −0.0651 | 0.0127 | −5.11 | <0.0001 | 383.74 | 373.2 | 394.58 |
| Nicotine use | −0.1366 | 0.0081 | −16.87 | <0.0001 | 397.72 | 389.2 | 406.42 |
Note: This table presents a Poisson regression model showing that each additional year of prevention was associated with savings in dental care in 2019.
Figure 2 presents the stratified average dental spending for 2019 by procedure code grouping for individuals in each prevention category. Costs for oral surgeries for enrollees with 0 year of prevention were nine times greater than for beneficiaries with 5 years of prevention. The average costs for oral surgery were $143 for the 0‐year prevention group and $17 for the 5‐year prevention group. Enrollees receiving regular preventive care during the lookback period were more likely to receive preventive care in 2019. Furthermore, 49% of dental costs for individuals with 5 years of prevention were for diagnostic and preventive services, compared to only 22% of dental costs for patients with no previous prevention.
FIGURE 2.
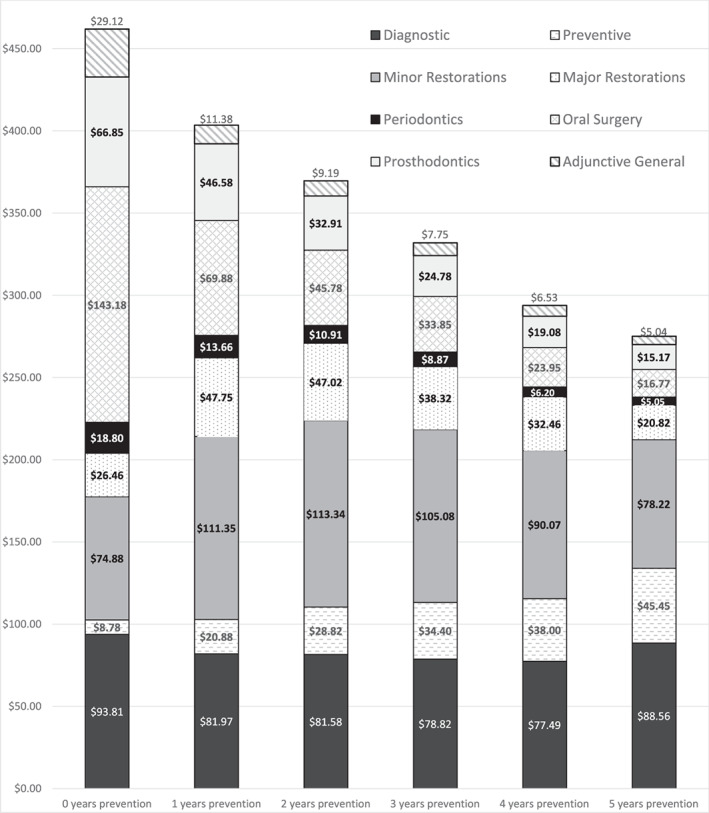
Paid amounts by dental procedure groupings. This figure stratifies dental costs in the measurement year of 2019 by CDT procedure code groupings
Analyses to this point have focused on costs in 2019. Figure 3 includes average dental costs for all years in the study to compare dental costs for the cohort over the entire study period. Individuals who received preventive care in the lookback period had higher dental care costs over the entire study period than those who did not as they had a longer dental history and had more time to receive care. However, the trend of average cost versus years of preventive care did not continuously increase over the study period in a linear manner. Enrollees with 4 or 5 years of prevention did not show higher costs than those with 3 years of prevention. In fact, patients with 5 years of prevention had a statistically significant lower average cost than patients with 3 years of prevention.
FIGURE 3.
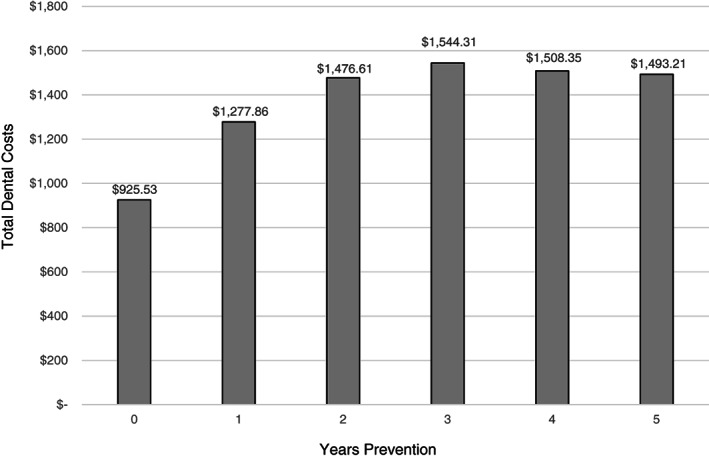
Average dental costs 2014–2019 based on years prevention between 2014 and 2018. This figure shows average dental costs for all years in the study to compare dental costs for the cohort over the entire study period
Table 4 shows the results of three logistic regression models estimating potential outcomes of the lack of preventive dental care. The first model shows the likelihood that a beneficiary had an ED visit for a NTDC.. We found that enrollees with 0 year of prevention were five (OR = 4.62|CI = 3.95–5.40) times more likely to have visited an ED for an NTDC visit than those with 5 years of prevention. We found that females were 11% (OR = 1.11|CI = 1.04–1.18) more likely to have an ED‐NTDC visit than males. We also found that older patients tended to have fewer ED visits than younger ones, with 51–64 years olds being 36% (OR = 0.36|CI = 0.33–0.39) as likely to have an ED visit as 21–30 years old enrollees. Health and lifestyle factors played a significant role as well. Those with nicotine use were almost three (OR = 2.76| CI = 2.61–2.91) times as likely to have an ED‐NTDC visit as those who did not use nicotine products. Those diagnosed with hypertension were 44% (OR = 1.44|CI = 1.35–1.53) more likely to have an ED‐NTDC visit than enrollees without hypertension, while those diagnosed with substance use were 83%(OR = 1.83|CI = 1.69–1.97) more likely to have such a visit compared to those without substance use.
TABLE 4.
Characteristics of patients with emergency department visits for non‐traumatic dental conditions (ED‐NTDC), Oral surgeries, and dental‐related opioid prescriptions
| Covariates | ED NTDC | Oral surgery | Dental‐related opioid prescriptions | |||||||||
|---|---|---|---|---|---|---|---|---|---|---|---|---|
| Patients | Row % | Odds ratio | 95% CI (p value) | Patients | Row % | Odds ratio | 95% CI (p value) | Patients | Row% | Odds ratio | 95% CI (p value) | |
| Years prevention | (<0.0001) | (<0.0001) | (<0.0001) | |||||||||
| 0 years | 3512 | 5.5% | 4.62 | 3.95–5.40 | 27,787 | 44.0% | 6.16 | 5.85–6.48 | 11,675 | 20.3% | 5.11 | 4.72–5.54 |
| 1 year | 1298 | 4.0% | 3.23 | 2.75–3.80 | 10,152 | 31.9% | 3.82 | 3.61–4.03 | 4548 | 15.8% | 3.65 | 3.35–3.97 |
| 2 years | 766 | 2.8% | 2.51 | 2.12–2.98 | 5983 | 23.6% | 2.63 | 2.49–2.79 | 2798 | 12.1% | 2.79 | 2.56–3.05 |
| 3 years | 386 | 2.0% | 1.59 | 1.32–1.91 | 3732 | 18.4% | 1.89 | 1.78–2.01 | 1637 | 9.1% | 1.97 | 1.80–2.17 |
| 4 years | 251 | 1.3% | 1.31 | 1.08–1.60 | 2511 | 13.7% | 1.38 | 1.30–1.48 | 1042 | 5.9% | 1.44 | 1.30–1.59 |
| 5 years | 176 | 0.7% | ref | 1911 | 9.8% | ref | 712 | 4.0% | ref | |||
| Sex | (0.0006) | (0.1687) | (<0.0001) | |||||||||
| Male | 1793 | 2.9% | ref | 16,635 | 29.0% | ref | 5920 | 11.2% | ref | |||
| Female | 4596 | 3.9% | 1.11 | 1.04–1.18 | 35,441 | 29.8% | 1.02 | 0.99–1.04 | 16,492 | 15.3% | 1.32 | 1.28–1.36 |
| Race | (<0.0001) | (<0.0001) | (<0.0001) | |||||||||
| White | 3516 | 3.4% | ref | 29,072 | 28.0% | ref | 11,388 | 12.3% | ref | |||
| Black | 2292 | 3.8% | 1.15 | 1.09–1.22 | 17,668 | 31.7% | 1.05 | 1.03–1.08 | 8458 | 16.5% | 1.32 | 1.28–1.36 |
| Hispanic | 107 | 1.6% | 0.83 | 0.68–1.01 | 1057 | 20.5% | 0.88 | 0.82–0.95 | 517 | 9.3% | 1.12 | 1.02–1.23 |
| Other | 494 | 44.1% | 0.56 | 0.42–0.74 | 4279 | 37.3% | 0.98 | 0.91–1.07 | 2049 | 17.9% | 1.01 | 0.90–1.14 |
| Age groups | (<0.0001) | (0.6245) | (<0.0001) | |||||||||
| 21–30 | 1578 | 4.5% | ref | 9682 | 27.3% | ref | 5322 | 16.7% | ref | |||
| 31–40 | 2077 | 4.4% | 0.83 | 0.77–0.89 | 13,358 | 28.6% | 0.99 | 0.96–1.02 | 6598 | 15.8% | 0.85 | 0.82–0.89 |
| 41–50 | 1361 | 3.4% | 0.62 | 0.57–0.67 | 11,230 | 29.7% | 1.01 | 0.97–1.04 | 4675 | 13.4% | 0.72 | 0.68–0.75 |
| 51–64 | 1373 | 2.3% | 0.36 | 0.33–0.39 | 17,806 | 31.7% | 0.99 | 0.96–1.03 | 5817 | 11.1% | 0.53 | 0.50–0.55 |
| Elixhauser comorbidities | ||||||||||||
| Hypertension | 2505 | 3.9% | 1.32 | 1.24–1.41 | 19,954 | 31.4% | 1.06 | 1.03–1.08 | 8069 | 12.7% | 1.13 | 1.09–1.17 |
| Diabetes | 1252 | 3.7% | 1.13 | 1.05–1.21 | 10,874 | 32.1% | 1.10 | 1.07–1.13 | 4117 | 12.1% | 1.00 | 0.96–1.04 |
| Substance use | 926 | 6.8% | 1.29 | 1.19–1.39 | 5200 | 38.1% | 1.18 | 1.14–1.23 | 2116 | 15.5% | 1.00 | 0.95–1.06 |
| Nicotine use | 3269 | 7.1% | 2.76 | 2.61–2.91 | 16,985 | 37.1% | 1.40 | 1.36–1.43 | 7806 | 17.1% | 1.52 | 1.47–1.57 |
| Model: Logistic regression | ||||||||||||
Note: This table is based on three logistic regression models where the dependent variable is either ED‐NTDC, Oral Surgery or Dental Opioids respectively as seen in the measurement year, 2019. Row % refers to the percent of patients in each category. For instance, 5.5% of 0 year prevention patients had an ED‐NTDC visit in 2019.
The second model in Table 4 examined the likelihood of an enrollee undergoing oral surgery in 2019 based on sociodemographic factors and prior prevention history. Prior preventive dental care was by far the biggest factor in reducing the likelihood of receiving a surgical procedure when controlling for covariates. Having received regular prevention significantly lowered an individual's odds of having oral surgery in 2019. A 0‐year prevention enrollee was seven (OR = 6.52|CI = 6.20–6.87) times more likely to have oral surgery in 2019 than a 5‐year prevention beneficiary. With regard to health and lifestyle factors, nicotine use had the strongest association with oral surgery, increasing the odds by 40% (OR = 1.40|CI = 1.36–1.43). Sex, race and age group did not play a major role in predicting oral surgeries.
Our third logistic regression model in Table 4 examined the association between dental‐related opioid prescriptions and preventive dental visits. The model shows that a higher frequency of prevention was associated with lower rates of dental‐related opioid prescriptions. A beneficiary who received no prevention in five prior years was five (OR = 5.11|CI = 4.71–5.54) times more likely to receive a dental‐related opioid prescription as an enrollee who received prevention in all 5 years. Older adults (aged 51–64) were about half as likely (OR = 0.53|CI = 0.50–0.55) to receive an opioid prescription than younger adults (aged 21–30), even though the older cohort was just as likely to receive oral surgery as younger enrollees. Nicotine used and hypertension were also significant factors increasing the odds of receiving a dental‐related opioid prescription.
DISCUSSION
Our study has demonstrated an inverse relationship between the number of years of prevention and the average cost of dental services for adults enrolled in Medicaid. Benefits of preventive dental visits go well beyond cost savings. Not only was prior prevention linked with lower dental costs, it also had a strong correlation with reduced ED NTDC visits, fewer dental‐related opioid prescriptions, and fewer oral surgeries. Underutilizers who did not have regular prevention received most of their dental spending on restorative‐related treatment, while those with a history of regular prevention had half of their dental spending on diagnostics and prevention. Our analysis suggests that if adult Medicaid enrollees who underutilize routine dental care were able to receive regular preventive care, their average dental costs would decrease in a matter of years. In addition, the rates of ED‐NTDC utilization is likely to decline over time along with the number of dental‐related opioid prescriptions.
Even though previous studies have shown that Medicaid dental coverage is positively associated with dental care utilization among adults with low income, other barriers perpetuate dental care disparities. An ADB alone is not enough to eliminate barriers to preventive dental care utilization, particularly if a state's Medicaid dental benefit is restricted to emergency‐only or other non‐preventive services [20]. Equally, important factors include insufficient coverage, individuals' inability to find a dentist who accepts their insurance, and patients' perceived poor quality of care [21]. Education is a strong predictor of dental care utilization and preventive dental services in particular [22]. Marginalized communities could, therefore, benefit from greater outreach.
Underutilizers were much more likely to receive oral surgery than patients who had been receiving regular preventive care. Oral surgeries, in turn, result in high rates of opioid prescriptions [23]. Indeed, in our study, underutilizers were six times more likely to receive a dental‐related opioid prescription than enrollees who had received regular preventive care. This finding strongly suggests that increasing rates of preventive dental care could help lower opioid prescription rates, thereby decreasing the potential for addiction [24].
Our findings on ED‐NTDC visits were consistent with state‐level studies. For instance, in Massachusetts, adults who received a preventive dental service in the prior year were 39% less likely to have an ED‐NTDC visit than patients who received no prevention in the prior year [7]. This is similar to our results in which 1 year of prevention in a 5‐year lookback period translated to a 36% reduction in the ED‐NTDC visitation rate.
There are some important limitations to the study. The IBM Watson Medicaid claims dataset consists of 13 de‐identified states and contains a nationally representative sample of patients. We do not know which states are included in the dataset. We also do not know at which times the members in our study had or did not have comprehensive dental coverage. The states included may or may not have had a substantive ADB for all or part of the study's duration. If members in our study had dental coverage outside of Medicaid, paid out of pocket for services, or received free services, such care would not be reflected in our research. In addition, some claims in IBM Watson come from capitated managed care plans. These claims are paid in the form of prepaid capitation sums. In some cases, these sums were reported in fee‐for‐service equivalents; in; in others, they were left as $0 payments. Actual paid amounts are likely higher than the numbers recorded in this publication. Finally, our dataset only reflects the claims submitted to Medicaid insurance plans. Any services received outside of Medicaid are not included in this study.
There is no assurance that increasing dental access rates will save money in the short or long term. This paper is a limited case study on those Medicaid‐enrolled adults that were seen in 2019 for whom we had a 5‐year lookback period. This research did not consider non‐utilizers (members who did not have a dental service in 2019) since their costs were zero. Additionally, in analyses that included total costs across all 5 years of data, we find that individuals who received preventive treatment across all 5 years had higher cumulative costs than members who were only seen in 2019. This is likely due, at least in part, to the cost of ongoing preventive and early intervention care. However, we did find that enrollees with 5 years of preventive dental did have significantly fewer restorative procedures and oral surgeries, likely associated with better oral‐health related quality of life.
Another key limitation is that we did not have any geographical indicators in our data. Geographical indicators would allow us to examine the effects of factors such as poverty, unemployment and water fluoridation rates on our variables of interest. In addition, our limited covariates do not include data on dietary or other health‐related behavior. Those who appear for regular preventive health care visits may also be more likely to brush their teeth regularly, floss, and eat healthier foods which, in turn, impacts their oral health. Therefore, we cannot separate the effects of prevention from these other behaviors.
Our study presents compelling evidence that the benefits of preventive visits compound over time to reduce the costs of providing dental services to adults. Routine preventive dental visits also can reduce unnecessary strain on the hospital system by reducing ED visits for dental conditions, while also reducing the use of opioids to manage acute dental pain. Future research should consider extending these analyses to include Medicaid beneficiaries of other ages, cost savings on the medical system, other insurance categories, and different policy environments. While there are more analyses to be done, the evidence in this study suggests that providing Medicaid enrolled adults with comprehensive dental coverage that includes routine preventive care, and encouraging people to use those services, has the potential to reduce costs and improve health.
Supporting information
Appendix S1: Supporting information.
APPENDIX A.
A.1.
ICD‐9/ICD‐10 crosswalk table with recommended code sets to define non‐traumatic dental conditions (NTDC) and caries/periodontal/preventive conditions (CPP) (see Appendix S1).
APPENDIX B.
B.1.
See Table B1.
TABLE B1.
Probability of being in each prevention group
| Reference group = 0 year prevention | |||||
|---|---|---|---|---|---|
| Covariates | 1‐year prevention | 2‐year prevention | 3‐year prevention | 4‐year prevention | 5‐year prevention |
| Sex (Ref = Male) | |||||
| Female | 1.17 (1.14–1.21) | 1.17 (1.14–1.21) | 1.11 (1.07–1.14) | 1.05 (1.01–1.09) | 0.9 (0.87–0.93) |
| Race (Ref = White) | |||||
| Black | 0.86 (0.84–0.89) | 0.77 (0.74–0.79) | 0.7 (0.68–0.72) | 0.59 (0.57–0.62) | 0.49 (0.47–0.51) |
| Hispanic | 1.36 (1.24–1.49) | 1.46 (1.33–1.6) | 1.42 (1.29–1.57) | 1.38 (1.25–1.52) | 1.23 (1.11–1.36) |
| Other | 1.22 (1.09–1.35) | 1.29 (1.16–1.44) | 1.31 (1.17–1.47) | 1.31 (1.17–1.47) | 1.45 (1.3–1.62) |
| Age group (Ref = 21–30) | |||||
| 31–40 | 0.73 (0.7–0.76) | 0.74 (0.71–0.77) | 0.73 (0.69–0.76) | 0.79 (0.76–0.84) | 0.84 (0.8–0.88) |
| 41–50 | 0.63 (0.6–0.66) | 0.64 (0.61–0.68) | 0.7 (0.66–0.73) | 0.82 (0.78–0.87) | 0.97 (0.92–1.02) |
| 51–64 | 0.48 (0.46–0.5) | 0.47 (0.45–0.5) | 0.52 (0.5–0.55) | 0.65 (0.62–0.69) | 0.83 (0.79–0.88) |
| Elixhauser comorbidities | |||||
| Hypertension | 0.93 (0.9–0.96) | 0.91 (0.88–0.95) | 0.87 (0.84–0.91) | 0.81 (0.77–0.84) | 0.76 (0.73–0.79) |
| Diabetes | 0.94 (0.9–0.98) | 0.91 (0.87–0.95) | 0.85 (0.81–0.89) | 0.86 (0.82–0.9) | 0.77 (0.73–0.81) |
| Substance use | 0.93 (0.89–0.98) | 0.79 (0.74–0.83) | 0.68 (0.64–0.73) | 0.5 (0.46–0.54) | 0.35 (0.31–0.38) |
| Nicotine Use | 0.82 (0.8–0.85) | 0.69 (0.67–0.71) | 0.54 (0.52–0.57) | 0.42 (0.4–0.44) | 0.3 (0.28–0.31) |
Note: For this table, we ran a generalized logit model to determine how sociodemographic, health and lifestyle factors contribute to the probability that a patient falls into specific prevention categories as measured by number years prevention in the lookback period.
APPENDIX C.
C.1.
See Table C1.
TABLE C1.
Average dental costs by years prevention
| 0 year prevention | 1 year prevention | 2 years prevention | 3 years prevention | 4 years prevention | 5 years prevention | |
|---|---|---|---|---|---|---|
| All patients | $464.08 | $417.35 | $382.04 | $332.69 | $294.48 | $263.22 |
| Sex | ||||||
| Male | $488.79 | $420.83 | $374.64 | $316.14 | $280.10 | $249.44 |
| Female | $451.76 | $415.99 | $384.99 | $339.66 | $301.50 | $271.62 |
| Race | ||||||
| White | $508.48 | $440.33 | $394.77 | $337.65 | $293.34 | $257.39 |
| Black | $395.29 | $363.71 | $346.90 | $306.39 | $289.75 | $279.43 |
| Hispanic | $446.85 | $328.84 | $365.88 | $372.14 | $315.81 | $285.60 |
| Other | $452.52 | $420.18 | $344.71 | $334.65 | $255.18 | $257.68 |
| Age group | ||||||
| 21–30 | $418.67 | $406.70 | $375.36 | $323.19 | $297.50 | $261.44 |
| 31–40 | $453.12 | $408.32 | $380.18 | $325.64 | $275.56 | $241.72 |
| 41–50 | $490.01 | $421.65 | $379.93 | $342.83 | $295.61 | $250.96 |
| 51–64 | $475.13 | $433.87 | $392.86 | $340.96 | $309.27 | $290.82 |
Note: This table presents the average dental costs by the number of years of prevention in total and stratified by sex, race, and age group.
Okunev I, Tranby EP, Jacob M, Diep VK, Kelly A, Heaton LJ, et al. The impact of underutilization of preventive dental care by adult Medicaid participants. J Public Health Dent. 2022;82:88–98. 10.1111/jphd.12494
REFERENCES
- 1. Oral Health Group . American Dental Association Statement on Regular Dental Visits; 2013. Accessed November 15, 2021. https://www.oralhealthgroup.com/oral-health/american-dental-association-statement-on-regular-dental-visits-1002386023/.
- 2. Decker SL, Lipton BJ. Do Medicaid benefit expansions have teeth? The effect of Medicaid adult dental coverage on the use of dental services and oral health. J Health Econ. 2015;44:212–25. [DOI] [PMC free article] [PubMed] [Google Scholar]
- 3. Savage MF, Lee JY, Kotch JB, Vann WF Jr. Early preventive dental visits: effects on subsequent utilization and costs. Pediatrics. 2004;114(4):e418–23. [DOI] [PubMed] [Google Scholar]
- 4. Beil H, Rozier RG, Preisser JS, Stearns SC, Lee JY. Effect of early preventive dental visits on subsequent dental treatment and expenditures. Med Care. 2012;50(9):749–56. [DOI] [PMC free article] [PubMed] [Google Scholar]
- 5. Elani HW, Kawachi I, Sommers BD. Changes in emergency department dental visits after Medicaid expansion. Health Serv Res. 2020;55(3):367–74. [DOI] [PMC free article] [PubMed] [Google Scholar]
- 6. Vujicic M, Buchmueller T, Klein R. Dental care presents the highest level of financial barriers, compared to other types of health care services. Health Aff (Millwood). 2016;35(12):2176–82. [DOI] [PubMed] [Google Scholar]
- 7. Ranade A, Young GJ, Griffith J, Garcia R, Singhal A, McGuire J. Determinants of emergency department utilization for non‐traumatic dental conditions in Massachusetts. J Public Health Dent. 2019;79(1):71–8. [DOI] [PubMed] [Google Scholar]
- 8. Wides C, Alam SR, Mertz E. Shaking up the dental safety‐net: elimination of optional adult dental Medicaid benefits in California. J Health Care Poor Underserved. 2014;25(1, Suppl):151–64. [DOI] [PMC free article] [PubMed] [Google Scholar]
- 9. Hawaii Oral Health: Key findings. Hawaii State Department of health; 2015.
- 10. CareQuest Institute for Oral Health . Healthy mouths: why they matter for adults and state budgets. Boston, MA: CareQuest Institute for Oral Health; 2020. Accessed November 15, 2021. https://www.carequest.org/system/files/CareQuest-Institute-Health-Mouths-Why-They-Matter-for-Adults-and-State-Budgets-Brief.pdf [Google Scholar]
- 11. Halasa‐Rappel YA, Brow AR, Frantsve‐Hawley J, Tranby EP. Poor families spent 10 times more of their income on dental care than wealthier families. Boston, MA: CareQuest Institute for Oral Health; 2019. Accessed November 15, 2021. https://www.carequest.org/system/files/CareQuest-Institute-Poor-Families-Spend-10-Times-More-Brief-Part1.pdf [Google Scholar]
- 12. Solberg LM, Hincapie‐Echeverri J. Palliative Care in the Emergency Department. Crit Care Nurs Clin North Am. 2015;27(3):355–68. [DOI] [PubMed] [Google Scholar]
- 13. Okunseri C, Garcia RI, Okunseri E, Visotcky A, Szabo A. Dental service utilization and neighborhood characteristics in young adults in the United States: a multilevel approach. J Public Health Dent. 2015;75(4):282–90. [DOI] [PMC free article] [PubMed] [Google Scholar]
- 14. Rampa S, Wilson FA, Wang H, Wehbi NK, Smith L, Allareddy V. Hospital‐based emergency department visits with dental conditions: impact of the Medicaid reimbursement fee for dental Services in new York State, 2009‐2013. Journal of Evidence‐Based Dental Practice. 2018;18(2):119–29. [DOI] [PubMed] [Google Scholar]
- 15. IBM Watson Market Scan Multi‐State Medicaid Database; 2018.
- 16. Manz MC. Recommended guidelines for surveillance of non‐traumatic dental care in emergency departments. ASTDD. 2017. Accessed February 14, 2021. https://www.astdd.org/docs/recommended-guidlines-for-surveillance-of-ntdc-in-eds.pdf [Google Scholar]
- 17. CDC . Calculating total daily dose of opioid for safer dosage. Centers for Disease Control and Prevention. Accessed February 14, 2021. https://www.cdc.gov/drugoverdose/pdf/calculating_total_daily_dose-a.pdf [Google Scholar]
- 18.Project HCUP. Elixhauser comorbidity software, Version 3.7 2021. Accessed February 14, 2021. https://www.hcup-us.ahrq.gov/toolssoftware/comorbidity/comorbidity.jsp
- 19.Distribution of nonelderly adults with Medicaid by sex Kaiser family foundation. Accessed February 14, 2021. https://www.kff.org/medicaid/state‐indicator/medicaid‐distribution‐nonelderly‐adults‐by‐sex/?currentTimeframe=0&sortModel=%7B%22colId%22:%22Location%22:%22sort%22:%22asc%22%7D.
- 20. Oh A. The effect of Medicaid dental coverage on dental care utilization among older Americans: ProQuest Information & Learning; 2015.
- 21. Schrimshaw EW, Siegel K, Wolfson NH, Mitchell DA, Kunzel C. Insurance‐related barriers to accessing dental care among African American adults with Oral health symptoms in Harlem, new York City. Am J Public Health. 2011;101(8):1420–8. [DOI] [PMC free article] [PubMed] [Google Scholar]
- 22. Meyerhoefer CD, Zuvekas SH, Manski R. The demand for preventive and restorative dental services. Health Econ. 2014;23(1):14–32. [DOI] [PubMed] [Google Scholar]
- 23. Steinmetz CN, Zheng C, Okunseri E, Szabo A, Okunseri C. Opioid analgesic prescribing practices of dental professionals in the United States. JDR Clin Trans Res. 2017;2(3):241–8. [DOI] [PMC free article] [PubMed] [Google Scholar]
- 24. Kolodny A, Courtwright DT, Hwang CS, Kreiner P, Eadie JL, Clark TW, et al. The prescription opioid and heroin crisis: a public health approach to an epidemic of addiction. Annu Rev Public Health. 2015;36:559–74. [DOI] [PubMed] [Google Scholar]
Associated Data
This section collects any data citations, data availability statements, or supplementary materials included in this article.
Supplementary Materials
Appendix S1: Supporting information.