

Abstract
Vonoprazan, a potassium‐competitive acid blocker, is under investigation in the United States and Europe for the treatment of erosive esophagitis and Helicobacter pylori infection. Population pharmacokinetic (popPK) analysis allows the identification of factors that could affect drug exposure in population subgroups. Here, we report a popPK model based on pooled data sets of available pharmacokinetic (PK) studies in healthy volunteers and patients with gastroesophageal reflux disease, including erosive esophagitis, from Asia and Europe. This model was used to evaluate the impact of different covariates, including race and disease status, on vonoprazan exposure. We analyzed PK data from 746 patients and 410 healthy volunteers from 15 clinical trials using a nonlinear mixed‐effects approach to develop the popPK model. Model development focused on characterizing and quantifying the effects of clinical covariates of race (Asian vs non‐Asian) and disease status (gastroesophageal reflux disease vs healthy volunteers) on vonoprazan exposure. Identified clinical covariates included fed/fasting status, race, sex, disease status, weight, serum creatinine, and age. The impact of variations in these clinical covariates on exposure to vonoprazan was smaller than the effect of halving or doubling the dose. PK parameters were similar in Asian and non‐Asian populations. Variations in weight, age, and race are not predicted to have a clinically relevant impact on vonoprazan exposure or safety and require no changes in vonoprazan dosing. The limited impact of race on exposure suggests that efficacy and safety data for vonoprazan in Asian populations are translatable to non‐Asian populations.
Keywords: gastrointestinal, internal medicine, modeling and simulation, pharmacokinetics and drug metabolism, population pharmacokinetics
Vonoprazan is a potassium‐competitive acid blocker that has demonstrated rapid, potent, and long‐lasting gastric acid suppression. 1 , 2 , 3 It has been approved in Japan and 14 other countries in Asia and South America for a number of years for the treatment of a variety of acid‐related diseases. 4 , 5 Its principal use is in the management of gastroesophageal reflux disease. The 2 main subtypes of gastroesophageal reflux disease are erosive esophagitis and nonerosive reflux disease. The distinguishing feature between these is the presence of esophageal mucosal erosions in the former. Vonoprazan has recently been evaluated in phase 3 trials in the United States and Europe for the eradication of Helicobacter pylori (H pylori) infection and for the healing and maintenance of healing of erosive esophagitis. It is also currently being investigated in the United States for the management of nonerosive reflux disease. 6 , 7 , 8
Vonoprazan is rapidly absorbed, with a median time to maximum concentration (tmax) of 1.5 hours under fasting conditions. 1 , 3 The rate of elimination from plasma allows for once‐daily dosing, with mean terminal half‐life values of typically 7 to 8 hours and steady‐state concentrations achieved after 3 to 4 days. 9 The clinical efficacy and safety profiles for vonoprazan have been established in Asian patients with erosive esophagitis, nonerosive reflux disease, peptic ulcer disease, or H pylori infection; currently, there are fewer clinical data in non‐Asian patients. 1 , 2 , 3 , 10 , 11 , 12 , 13 , 14 , 15 , 16 , 17 , 18 , 19 The biological processes involved in the pharmacokinetics (PK) of drugs have the potential to result in differences between racial/ethnic groups, raising the possibility that vonoprazan PK may differ between this well‐studied Asian population and non‐Asians. 20 , 21 Comparison of data from Japanese and European phase 1 trials showed no clinically significant differences in PK or pharmacodynamic properties of vonoprazan between Japanese and non‐Japanese healthy volunteers, suggesting translatability of data between these populations. 1 , 3 The availability of data from a European trial of vonoprazan in patients with either nonerosive reflux disease or mild erosive esophagitis (NCT02743949) 22 has provided an opportunity to characterize the population PK (popPK) of vonoprazan and further investigate the effects of covariates such as race and disease status on vonoprazan exposure in a wider non‐Asian patient population.
The objective of this analysis was to develop and optimize a popPK model including PK data from phase 1 and 2 studies in Asian and European healthy volunteers, and Asian and European patients with gastroesophageal reflux disease. We investigated the effects of race, disease status, and other covariates, such as sex, renal function, and body weight, on vonoprazan exposure.
Methods
All studies included in this analysis were conducted in accordance with the relevant national regulations, International Conference on Harmonization Good Clinical Practice guidelines, and the principles of the Declaration of Helsinki. 23 , 24 Each study protocol was approved by applicable institutional review boards/ethics committees and health authorities, and written informed consent was obtained from all participants or their representatives.
This popPK analysis was performed according to guidance from the US Food and Drug Administration, and the European Medicines Agency. 25 , 26
Clinical Studies and Samples
We used vonoprazan PK data from phase 1 and phase 2 studies in healthy volunteers and patients with gastroesophageal reflux disease to develop the popPK model. The analysis set included data from 5 studies in Japanese healthy volunteers, 8 studies in European healthy volunteers, 1 study in Japanese patients with erosive esophagitis, and a recently completed European study in patients with either mild erosive esophagitis or nonerosive reflux disease. 22 Four film‐coated tablet formulations of vonoprazan with only minor differences in excipients were used in the studies. Study designs, patient characteristics, and PK sampling times are summarized in Table 1. Plasma concentrations below the limit of quantification were included in the analysis data set but not used for model fitting. Missing PK observations including missing actual times or concentrations were removed from the data set. Samples collected from a participant before his or her first dose were designated time 0.
Table 1.
Summary of Study Designs, Participants, Doses, and Samples
| Study | References | Population | Location | Participants (N) | Phase | Vonoprazan Doses, mg | Dosing Schedule | PK Sampling (h after dosing) |
|---|---|---|---|---|---|---|---|---|
| 101 | 3 | HV | Europe | 42 | 1 | 1, 5, 10, 15, 20, 30, 40 | Single dose | 0, 0.25, 0.5, 0.75, 1, 1.5, 2, 3, 4, 6, 8, 10, 12, 16, 24, 30, 36, and 48 |
| 103 | Unpublished, data on file | HV | Europe | 6 | 1 | 20 | Single dose | 0, 0.5, 1, 1.5, 2, 2.5, 3, 3.5, 4, 5, 6, 7, 8, 10, 12, 16, 24, 32, 48, 72, 96, and 120 |
| 107 | 1 | HV | Europe | 36 | 1 | 10, 20, 30, 40 | Once daily for 7 days | Days 1 and 7: 0, 0.25, 0.5, 0.75, 1, 1.5, 2, 3, 4, 6, 8, 10, 12, 16, 24, and 48. Days 4‐6: 0 |
| 109 | Unpublished, data on file | HV | Europe | 24 | 1 | 20 | Single dose, days 1 and 7 | Days 1 and 7: 0, 0.083 (5 minutes), 0.25, 0.5, 0.75, 1, 1.5, 2, 4, 6, 8, 10, 12, 16, 24, 30, 36, and 48 |
| 110 | 37 | HV | Europe | 16 | 1 | 40 | Single dose | 0, 0.25, 0.5, 0.75, 1, 1.5, 2, 4, 6, 8, 10, 12, 16, 24, 30, 36, and 48 |
| 111 | 38 | HV | Europe | 64 | 1 | 40, 120 | Single dose ×2 (1 of each) | 0, 0.5, 1, 1.5, 2, 3, 4, 5, 5.5, 6, 8, 12, 16, 24, and 48 |
| 112 | Unpublished, data on file | HV | Europe | 12 | 1 | 20 | Single dose | 0, 0.25, 0.5, 0.75, 1, 1.5, 2, 4, 6, 8, 10, 12, 16, 24, 30, 36, 48, 72, 96, and 120 |
| 113 | Unpublished, data on file | HV and renal impaired | Europe | 37 | 1 | 20 | Single dose | 0, 0.25, 0.5, 0.75, 1, 1.5, 2, 3, 4, 5, 6, 8, 10, 12, 16, 24, 30, 36, 48, 72, 96, and 120 |
| CPH‐001 | 3 | HV | Japan | 79 | 1 | 1, 5, 10, 20, 40, 80, 120 | Single dose | Before dosing, 0.25, 0.5, 0.75, 1, 1.5, 2, 3, 4, 6, 8, 10, 12, 16, 24, 30, 36, and 48 |
| CPH‐002 | 1 | HV | Japan | 45 | 1 | 10, 15, 20, 30, 40 | Once daily for 7 days | Day 1: 0, 0.25, 0.5, 0.75, 1, 1.5, 2, 3, 4, 6, 8, 10, 12, 16, and 24. Days 3, 4, 5, 6: before dosing. Day 7: 0, 0.25, 0.5, 0.75, 1, 1.5, 2, 3, 4, 6, 8, 10, 12, 16, and 24 |
| CPH‐003 | 39 | HV | Japan | 32 | 1 | 40 | Either single dose ×2 or once daily for 6 days |
Day 1: ‐0.5, 0.5, 1, 1.5, 2, 3, 4, 6, 8, 10, 12, 16, 24, and 48 |
| CPH‐007 | Unpublished, data on file | HV | Japan | 12 | 1 | 20 | Single dose | 0, 0.5, 1, 1.5, 2, 3, 4, 6, 8, 10, 12, 16, 24, 36, and 48 |
| CPH‐401 | 40 | HV | Japan | 6 | 1 | 20 | Twice daily for 4 × 7 days | Days 1‐6: before dosing. Day 7: 0.5, 1, 1.5, 2, 3, 4, 6, 8, 10, 12, and 23.5 |
| CCT‐001 | 41 | Erosive esophagitis | Japan | 588 | 2 | 5, 10, 20, 40 | Once daily for 8 weeks |
Trough samples at week 2/day 14, week 4/day 28, and week 8/day 56; within 14 days after the last dose |
| Vonoprazan‐2001 | Unpublished, data on file | GERD | Europe | 157 | 2 | 20, 40 | Once daily for 4 weeks |
PK group 1: visit 5 (week 2), before dosing, >1 h after dosing; visit 6 (week 4), before dosing and 0.5, 2, 5, 6, and 8 PK group 2: visit 5 (week 2), before dosing, >1 h after dosing; visit 6 (week 4), before dosing, >1 h after dosing |
GERD, gastroesophageal reflux disease; HV, healthy volunteers; PK, pharmacokinetic.
In the Japanese erosive esophagitis study, only trough samples were available.
In the European study in erosive esophagitis patients (Vonoprazan‐2001), PK sampling was performed after 2 and 6 weeks of treatment, which is why the data set was created assuming that all participants were at steady state.
Population PK Model Development
A nonlinear mixed‐effects model was developed. Different compartmental model types (1‐, 2‐, and 3‐compartment models) were compared. Model features investigated included absorption delay, dose‐ and time‐dependent kinetics, relative bioavailability, various correlation structures for the between‐subject variability (BSV), and various error models for the residual unexplained variability (RUV).
Parameters were estimated using the first‐order conditional estimation with interaction method. Identification of sources of parameter variability and quantification of relationships between subject characteristics and model parameters were performed using stepwise covariate screening.
Covariate Screening
Covariate effects were estimated as a percentage change from the reference for categorical subject characteristics and exponents of power functions for continuous subject characteristics. Stepwise covariate screening was performed using a standard forward inclusion (α < 0.01) and backward deletion (α < 0.001) procedure, using the Perl‐speaks‐NONMEM suite version 4.9.0. Candidate covariate effects were added to the current best model and tested using a likelihood ratio test (LRT). The candidate with the smallest P value was accepted for inclusion if that LRT P value was ≤.01 and used as the next best model. Otherwise, the forward inclusion was stopped. During backward elimination, the covariate relations that had been added were removed and tested using an LRT. The candidate with the largest P value was accepted for deletion if the LRT P value was ≥.001. Otherwise, the backward elimination was stopped.
A mixture‐model was used to describe the apparent bimodal distribution for the BSV on absorption rate (Ka), which was not related to any tested patient or treatment characteristic.
The following factors were tested as covariates on all model parameters with associated random effects: food (fed/fasted), formulation, race, smoking habits, age, sex, baseline body weight, patient (healthy volunteer or patient with gastroesophageal reflux disease), cytochrome P450 (CYP) 2C19 status, baseline total protein, baseline albumin, baseline total bilirubin, baseline aspartate aminotransferase, baseline alanine aminotransferase, and baseline serum creatinine. Covariate effects of continuous variables were implemented as a power model: tv = tv * (cov/ref) eff . Covariate effects of categorical variables were estimated as percentage difference: if (cov = test) tv = tv * (1 + eff/100), where tv is the parameter's typical value, cov is the covariate, ref is the covariate's reference value, test is the covariate level to be tested, and eff denotes the effect parameter to be estimated.
Model Assessment
All models were assessed for the biological plausibility of fixed‐and random‐effects parameter estimates, the numerical properties of the model fitting procedure, precision of parameter estimates (as measured by the relative standard error [RSE% = 100% × standard error of the parameter estimate/|parameter estimate|]), and shrinkage on a BSV and RUV level.
Standard goodness‐of‐fit plots were also performed to investigate aspects of the model. Predicted vs observed plasma concentrations, optionally stratified by relevant covariates, were plotted, as well as predicted residuals vs time and plasma concentration, density of residuals, density of random effects, scatterplots of random effects, and individual fit plots vs time for each subject separately.
Models were compared with their parent, previous model using an LRT, typically on a 1% level. A .1% significance level was used during the backward elimination. Nonnested models were compared using the Akaike information criterion and Bayesian‐Schwartz information criterion. Additionally, the remaining amount of unexplained variability (BSV, RUV) and numerical convergence properties were compared between models.
A visual predictive check method was used to assess the adequacy of key popPK models. One thousand replicates of each observation at time after dose in the analysis data set were simulated using the final estimates of the fixed‐ and random‐effects parameters. For each replicate and time point, the 5th, 50th, and 95th percentiles of the simulated concentrations were derived. The set of percentiles was also further described as median and 95%CI. These simulation‐based CIs were compared with percentiles derived from the actual observed concentrations. Prediction corrections were applied to account for cases where different doses or dosing stages were summarized together, as dosing history influences PK concentrations.
Software
A nonlinear, mixed‐effects population approach was applied using NONMEM software version 7.4.1 (ICON Development Solutions, Gaithersburg, Maryland) based on the GFortran compiler version 9.3.0. Data management and graphical exploration were conducted in R version 3.6, including several diverse packages (R Foundation for Statistical Computing, Vienna, Austria).
Results
Final Analysis Data Set
The final database comprised 15 168 observations from 1156 individuals; 74.0% were men, 66.4% were Asian, and 64.4% had gastroesophageal reflux disease (Table 2). During base model development, 3 outlier observations were detected with conditional weighted residuals greater than 5 or less than −5, and flagged for exclusion.
Table 2.
Summary of Population Characteristics in the PopPK Final Data Set
| Parameter | Finding |
|---|---|
| Age, y, mean (SD) | 48 (17.7) |
| Baseline body weight, kg, mean (SD) | 69 (12.9) |
|
Baseline creatinine, μmol/L, mean (SD) Normal range: 60‐110 (men); 45‐90 (women) |
73 (21.6) |
| Race, n (%) | |
| Asian | 768 (66.4) |
| Black | 13 (1.1) |
| White | 371 (32.1) |
| Other | 4 (0.3) |
| Sex, n (%) | |
| Male | 856 (74.0) |
| Female | 300 (26.0) |
| Disease status, n (%) | |
| Healthy | 387 (33.5) |
| GERD | 745 (64.4) |
| Renal impairment | 24 (2.1) |
| CYP2C19 status, n (%) | |
| EM | 650 (56.2) |
| IM | 37 (3.2) |
| PM | 109 (9.4) |
| Other | 84 (7.3) |
| Not screened | 276 (23.9) |
EM, extensive metabolizer; GERD, gastroesophageal reflux disease; IM, intermediate metabolizer; PM, poor metabolizer; popPK, population pharmacokinetics; SD, standard deviation.
Final Model
The data were appropriately described by a 2‐compartment model with delayed oral absorption into the central compartment with a dose dependency on the relative bioavailability. As a result, a relative bioavailability parameter and an absorption delay (lag time) were used in addition to the required PK parameters of Ka, clearance (CL), volume of the second (central) compartment (V2), intercompartmental clearance, and volume of the third (peripheral) compartment (Figure S1). BSV was estimated for Ka, CL, and V2 using an exponential variability model. BSV on Ka was not estimated for study CCT‐001, as it contained only trough PK samples.
To describe the RUV, a combined additive, proportional error model was used. The RUV represents a composite of assay variability, intraindividual variability, model misspecification, errors in timing of dose and sample information, subject noncompliance, and other unexplained errors.
Parameter Estimates
Fed/fasting status, race, sex, age, disease status, baseline body weight, and serum creatinine all affected the PK parameters, with the covariate‐parameter relations and parameter estimates described in Table 3. All parameters were estimated with good precision. The covariate effect parameters for continuous variables (age, body weight, and serum creatinine) refer to the exponents of a centered power model where the reference values were 48 years for age, 70 kg for body weight, and 72 μmol/L for serum creatinine.
Table 3.
Final Model Parameter Estimates
| Parameter | Role | Estimate | RSE, % | 95%CI |
|---|---|---|---|---|
| Frel | Dose effect, exp | 0.389 | 4.1 | 0.358, 0.420 |
| tlag | TV, h | 0.225 | 1.4 | 0.218, 0.231 |
| Delay, % | 107 | 2.8 | 101, 113 | |
| Ka | TV, L/h | 2.51 | 12.3 | 1.91, 3.11 |
| Food effect, % | –58.8 | 10.3 | –70.7, –46.9 | |
| Non‐Asian effect, % | –20.2 | 49.6 | –39.8, –0.6 | |
| Female effect, % | –17.2 | 57.8 | –36.6, 2.3 | |
| Patient effect, % | –61.5 | 14.3 | –78.8, –44.3 | |
| BSV, a % | 93.6 | 5.8 | 0.8, 1.0 | |
| CL | TV, L/h | 119 | 19.9 | 72, 165 |
| Weight effect, exp | 0.409 | 19.9 | 0.249, 0.568 | |
| Creatinine effect, exp | –0.36 | 24.9 | –0.54, –0.18 | |
| Patient effect, % | –33.8 | 15.6 | –44.1, –23.4 | |
| BSV (CL, V2) a | 0.915 | 1.5 | 0.888, 0.942 | |
| BSV, a % | 41 | 3.7 | 0.38, 0.44 | |
| V2 | TV, L | 1037 | 14.8 | 736, 1338 |
| Creatinine effect, exp | –0.294 | 27.6 | –0.454, –0.135 | |
| Age effect, exp | 0.466 | 7.4 | 0.398, 0.534 | |
| Patient effect (%) | −32.9 | 21.8 | –47.1, –18.8 | |
| BSV a (%) | 36.1 | 4.1 | 0.3, 0.4 | |
| Q | TV, L/h | 50.4 | 7.2 | 43.3, 57.5 |
| V3 | TV, L | 324 | 4.7 | 294, 354 |
| Non‐Asian effect, % | –11.7 | 25.9 | –17.7, –5.78 | |
| BSV, a % | 19.4 | 19.7 | 0.1, 0.3 | |
| Residual error | prop.err., % | 28.7 | 1.7 | 27.8, 29.6 |
| add.err., b ng/mL | 0.00625 | Fixed | … |
add.err., additive error; BSV, between‐subject variability; CL, clearance; exp, exponent of the power model; Frel, relative bioavailability; Ka, absorption rate; prop.err., proportional error; Q, intercompartmental clearance; RSE, relative standard error; tlag, lag time; TV, typical value; V2, volume of the second (central) compartment; V3, volume of the third (peripheral) compartment.
Reference values used for centering were 48 years for age, 70 kg for body weight, and 72 μmol/L for serum creatinine. Covariate effects denoted as “exp” represent exponents of a power model: tv = tv * (cov/ref) eff . Covariate effects in % units were estimated using tv = tv * (1 + eff/100) for the respective subpopulation.
BSV terms are given in standard deviation scale.
Fixed parameter goodness of fit.
Goodness‐of‐fit plots for the final model showed that both population and individual predictions aligned well with observed vonoprazan populations (Figure 1). A prediction‐corrected visual predictive check of the final model showed that the observed data fit was adequately predicted by the model (Figure 2A, Figure S2). When stratified by disease status and race, the distributions of the observed data were, in all cases, within the simulated percentiles (Figure 2B), showing the adequacy of the final model.
Figure 1.

Final model goodness‐of‐fit scatterplot. Scatterplot of observed versus predicted concentrations. Left panel shows population predictions; right panel shows individual predictions.
Figure 2.
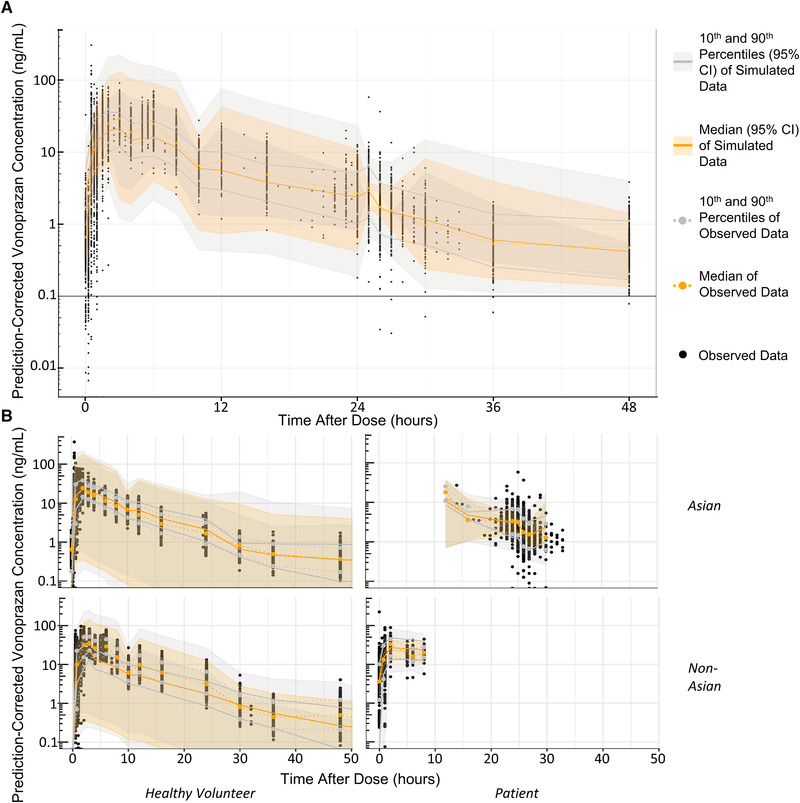
Final model visual predictive checks. Panel A shows a prediction‐corrected visual predictive checks: (A) prediction‐corrected visual predictive check and (B) visual predictive check stratified by disease status and race. An LLOQ of 0.1 was applied to the simulated concentrations. LLOQ, lower limit of quantitation.
Characterizing Potential Race and Disease Status Effects on PK
We assessed the impact of race (Asian vs non‐Asian) and disease status (patients with gastroesophageal reflux disease vs healthy volunteers) covariate effects on CL, V2, volume of the third (peripheral) compartment, and Ka using a stepwise covariate modeling approach. Patients had a 55% lower Ka, 38.1% lower CL, and 38% lower central volume than healthy volunteers. Non‐Asians had a 30.2% lower Ka and 12.9% lower peripheral volume than Asians. An analysis of potential race/disease status interaction terms yielded nothing significant.
Covariate Effects on Vonoprazan Exposure: Race and Population Effects
The covariate effects on the PK profile were visualized by generating 1000 simulated PK profiles for modified covariate levels (one at a time) in a reference subject (48‐year‐old, male, Asian, healthy volunteer, with a serum creatinine at 72 μmol/L, and 70 kg body weight treated with a 20‐mg daily dose under fasted/non–high‐fat meal conditions). Covariate effects on the PK profile are summarized in Figure 3 and Figure S3. Differences in clinical covariates such as weight, creatinine levels, age, sex, and fed/fasting status had minimal impact on vonoprazan exposure. Comparison with the effect of dose on exposure suggested that there would be no requirement to alter dosing on the basis of these common clinical variations.
Figure 3.
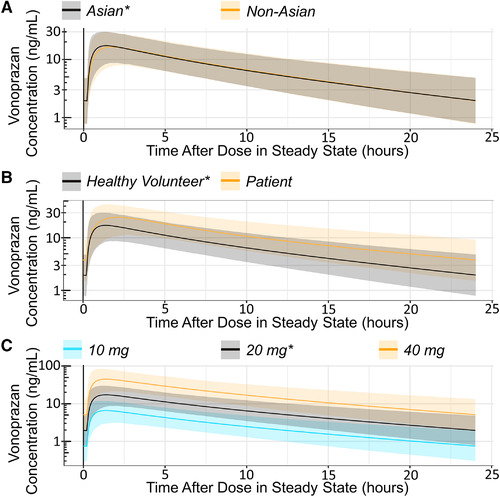
Simulated covariate effect on PK profile. Simulations of typical steady‐state 24‐h PK profiles of a reference subject (48‐year‐old, male, Asian, healthy volunteer, with a serum creatinine of 72 μmol/L and 70‐kg body weight treated with a 20‐mg daily dose under fasted/non–high‐fat meal conditions) with single, modified covariate levels as indicated. Simulated effects on the disposition (PK) of vonoprazan of race (A), disease status (B), and dose (C). *Reference state. Ribbons indicate 90% prediction intervals (5th to the 95th percentile of the simulations at steady state). PK, pharmacokinetic.
The 1000 simulated PK profiles were summarized to derive the covariate effect on the exposure variables: area under the plasma concentration–time curve (AUC), maximum plasma concentration (Cmax), tmax, and trough plasma concentration (Ctrough) (Figure 4). Patients were predicted to have a 61.5% higher AUC at steady state than healthy volunteers and a 42.3% higher Cmax. Patients also had a later tmax than healthy volunteers, as did non‐Asians compared with Asians. The Ctrough was ≈93.2% higher in patients than in healthy volunteers.
Figure 4.

Tornado plots: covariate effects on exposure parameters. The upper x‐axis indicates the absolute values of the exposure parameter, while the lower x‐axis shows the percentage difference to the reference subject value. The vertical black lines indicate the typical exposure parameter value for a reference subject (48‐year‐old, male, Asian, healthy volunteer, with a serum creatinine of 72 μmol/L, and 70‐kg body weight treated with a 20‐mg daily dose under fasted/non–high‐fat meal conditions), with the gray shading indicating the 90% prediction intervals. The orange dots and horizontal lines indicate the exposure parameter value for a subject where the covariate has been altered to the value shown in the upper box. The lower box indicates the percentage change from the typical reference value. For numerical values (eg, age, weight, and serum creatinine), the 10th and 90th percentiles were selected for simulation. AUC, area under the plasma concentration–time curve (ng • h/mL); Cmax, maximum plasma concentration (ng/mL); Ctrough, trough plasma concentration (ng/mL); tmax, time to maximum concentration (h).
Effect of Renal Impairment on Exposure
Simulations were also run to investigate the impact of renal impairment on vonoprazan exposure. Steady‐state concentrations for estimated glomerular filtration rates (eGFRs) of the midpoints for severe, moderate, and mild renal impairment (20, 45, and 75 mL/min/1.73 m2, respectively) for the reference subject (110 mL/min/1.73 m2) were simulated by converting the desired eGFRs into serum creatinine concentrations, as serum creatinine was a covariate in the final popPK model. 27 There was a steady increase in exposures with decreasing eGFR; a participant with an eGFR of 20 mL/min/1.73 m2 would have a 90.7% higher AUC, 71.3% higher Cmax, and 156.6% higher Ctrough than one with normal renal function.
Discussion
The final model was able to successfully characterize the PK properties of vonoprazan and the effects of covariates on vonoprazan disposition. Clinical factors including fed/fasting status, race, sex, age, disease status, baseline body weight, and renal function all influenced PK parameters and were included as covariates. However, when using the model to estimate the effect of variations in these factors on vonoprazan exposure, they had a minimal effect that was not clinically relevant. This suggests that no dose adjustment would be warranted due to variations in weight, age, or sex. These findings are corroborated by the available efficacy and safety data for vonoprazan, which suggest no impact of these factors on efficacy or safety. 10 , 11 , 14 , 15 , 18 , 19
Furthermore, the minimal impact of race on vonoprazan exposure suggests that data generated in the Asian population can be used to make inferences on, and extrapolate to, the non‐Asian population. Vonoprazan is mainly metabolized by multiple CYP enzymes including CYP3A4/5 and, to a lesser extent, CYP2B6, CYP2C19, and CYP2D6. This makes vonoprazan less sensitive to ethnic or racial differences in the genetic polymorphisms of single enzymes. 9 Comparing the final data from the phase 3 clinical trials in erosive esophagitis and H pylori infection in the United States and Europe, and the phase 2 trial in nonerosive reflux disease in the United States 6 , 7 , 8 with the data from previous phase 3 trials in Asian patients 10 , 11 , 14 , 15 , 18 , 19 might provide further evidence for this supposition. There is a large body of data in Asian patients indicating that vonoprazan confers potential benefits compared with proton pump inhibitors (PPIs) in the treatment of multiple acid‐related disorders 4 ; the ability to extrapolate this to patients in the United States and Europe could be of great clinical interest.
The model predicts that the impact of severe renal impairment on vonoprazan exposure is smaller than that of halving or doubling the dose of vonoprazan. However, clinical data from the phase 1 study of participants with renal impairment and without gastroesophageal reflux disease suggest that this may be an underprediction. In the phase 1 study, there was a 2.4‐fold increase in AUC and 1.8‐fold increase in Cmax (data on file) suggesting that further study into the effect of severe renal impairment (eGFR <30 mL/min) on vonoprazan exposure is warranted before its use in this population. However, renal impairment was not the principal focus of this model, and there were only 24 participants (ie, 2.1%) with renal impairment who provided data that were included in the model. Participants with a GFR <30 mL/min were excluded from the studies that were pooled for this analysis, including the phase 2 studies in patients with gastroesophageal reflux disease; this might limit the translatability of the results to values below the exclusion threshold.
There are some limitations of this analysis. Only 2 studies with patient populations were included in the database, and 1 had only limited PK sampling time points. The Japanese and European studies had overlapping but slightly differing patient populations in terms of disease status. The Japanese study included only patients with erosive esophagitis; the European study included patients with nonerosive reflux disease and patients with mild erosive esophagitis. This may have had different impacts on PK. 28
Existing literature regarding differences in PPI efficacy in the Asian compared with the non‐Asian population suggests that variability in CYP2C19 polymorphisms, parietal cell mass, and gastric acid production, could impact the PK/pharmacodynamic relationship of PPIs. 29 , 30 , 31 Vonoprazan would, therefore, be expected to have less variability between Asians and non‐Asians than PPIs, as it is metabolized through multiple enzymes other than CYP2C19 and is stable in acid, in contrast to PPIs. 4 Disease status had a slightly larger estimated effect on vonoprazan PK than race, but this was still smaller than the effect of doubling or halving the doses. Possible reasons for the small differences in PK observed for vonoprazan between patients with gastroesophageal reflux disease and healthy subjects might be the presence of delayed gastric emptying, as seen in some patients with gastroesophageal reflux disease, which could delay absorption, 32 , 33 , 34 , 35 as well as the presence of a hiatal hernia. 36 Regardless, a large body of evidence in Asian patients with gastroesophageal reflux disease attests to the effectiveness and safety of vonoprazan.
Conclusions
To conclude, the popPK model generated here suggests that clinical covariates such as race, disease status, age, and weight have a minimal clinical impact on vonoprazan exposure. Therefore, dose modification for patients based on these differences is unnecessary, thereby simplifying the use of vonoprazan. Furthermore, the popPK model suggests that the existing body of literature regarding the efficacy and safety of vonoprazan in Asian patients is translatable to non‐Asian patients, pending confirmation from vonoprazan clinical trials in erosive esophagitis and H pylori infection conducted in the United States and Europe.
Funding
All clinical studies were sponsored by Takeda Pharmaceuticals, Inc. This analysis was funded by Phathom Pharmaceuticals.
Conflicts of Interest
C.S. discloses compensation from Phathom Pharmaceuticals as a consultant, advisory board member, and speaker; and from Takeda as a speaker. E.L., N.S., and D.J.M. are employees of Phathom Pharmaceuticals; E.L. and N.S. also disclose stockholder interest in Phathom Pharmaceuticals. G.L. and A.F. of thinkQ2 were funded by Phathom Pharmaceuticals to undertake this work. G.L. also discloses consultancy fees from Takeda, Arbor Pharmaceuticals, Sanofi, Debiopharm, Vaccibody, Omeros, and Avacta, and A.F. is a consultant for Phathom Pharmaceuticals. C.W.H. is a consultant to Phathom Pharmaceuticals, RedHill Biopharma, Ironwood, Allakos, EndoStim, and Clexio; is a speaker for Phathom Pharmaceuticals, RedHill Biopharma, Alnylam, Sanofi/Genzyme, and Alfasigma; receives annual honorarium and royalties from Wiley; previously served on a Data Safety Monitoring Board for EndoStim (unrelated to the content of this article); and owns stock in Antibe Therapeutics.
The data for this study will not be made available to others.
Supporting information
Additional supplemental information can be found by clicking the Supplements link in the PDF toolbar or the Supplemental Information section at the end of the web‐based version of this article.
Acknowledgments
The contents of this article were partially presented at the 2021 Annual Meeting of the American College of Gastroenterology in Las Vegas, Nevada, held on October 22 to 27. The authors thank Abigail Killen‐Devine, PhD, and Kyle Lambe of Synergy Medical Communications for medical writing and editorial support, which was funded by Phathom Pharmaceuticals, Chicago, Illinois, in accordance with Good Publications Practice guidelines (http://www.ismpp.org/gpp3).
References
- 1. Jenkins H, Sakurai Y, Nishimura A, et al. Randomised clinical trial: safety, tolerability, pharmacokinetics and pharmacodynamics of repeated doses of TAK‐438 (vonoprazan), a novel potassium‐competitive acid blocker, in healthy male subjects. Aliment Pharmacol Ther. 2015;41(7):636‐48. [DOI] [PMC free article] [PubMed] [Google Scholar]
- 2. Sakurai Y, Mori Y, Okamoto H, et al. Acid‐inhibitory effects of vonoprazan 20 mg compared with esomeprazole 20 mg or rabeprazole 10 mg in healthy adult male subjects–a randomised open‐label cross‐over study. Aliment Pharmacol Ther. 2015;42(6):719‐730. [DOI] [PubMed] [Google Scholar]
- 3. Sakurai Y, Nishimura A, Kennedy G, et al. Safety, tolerability, pharmacokinetics, and pharmacodynamics of single rising TAK‐438 (vonoprazan) doses in healthy male Japanese/non‐Japanese subjects. Clin Transl Gastroenterol. 2015;6(6):e94. [DOI] [PMC free article] [PubMed] [Google Scholar]
- 4. Abdel‐Aziz Y, Metz DC, Howden CW. Review article: potassium‐competitive acid blockers for the treatment of acid‐related disorders. Aliment Pharmacol Ther. 2021;53(7):794‐809. [DOI] [PubMed] [Google Scholar]
- 5. Scarpignato C, Hunt RH. Acid suppressant therapy: a step forward with potassium‐competitive acid blockers. Curr Treat Options Gastroenterol. 2021;19(1):94‐132. [Google Scholar]
- 6. ClinicalTrials.gov . Efficacy and Safety of Vonoprazan Compared to Lansoprazole in Participants with Helicobacter pylori infection: NCT04167670. https://clinicaltrials.gov/ct2/show/NCT04167670. Accessed April 2021.
- 7. ClinicalTrials.gov . Efficacy and Safety of Vonoprazan Compared to Lansoprazole in Participants With Erosive Esophagitis: NCT04124926. https://clinicaltrials.gov/ct2/show/NCT04124926. Accessed April 2021.
- 8. ClinicalTrials.gov . A Study to Evaluate the Efficacy and Safety of Vonoprazan Compared to Placebo in Participants With Symptomatic Non‐Erosive Gastroesophageal Reflux Disease: NCT04799158. https://clinicaltrials.gov/ct2/show/NCT04799158. Accessed April 2021.
- 9. Yamasaki H, Kawaguchi N, Nonaka M, et al. In vitro metabolism of TAK‐438, vonoprazan fumarate, a novel potassium‐competitive acid blocker. Xenobiotica. 2017;47(12):1027‐1034. [DOI] [PubMed] [Google Scholar]
- 10. Ashida K, Iwakiri K, Hiramatsu N, et al. Maintenance for healed erosive esophagitis: phase III comparison of vonoprazan with lansoprazole. World J Gastroenterol. 2018;24(14):1550‐1561. [DOI] [PMC free article] [PubMed] [Google Scholar]
- 11. Ashida K, Sakurai Y, Hori T, et al. Randomised clinical trial: vonoprazan, a novel potassium‐competitive acid blocker, vs. lansoprazole for the healing of erosive oesophagitis. Aliment Pharmacol Ther. 2016;43(2):240‐251. [DOI] [PMC free article] [PubMed] [Google Scholar]
- 12. Iwakiri K, Sakurai Y, Shiino M, et al. A randomized, double‐blind study to evaluate the acid‐inhibitory effect of vonoprazan (20 mg and 40 mg) in patients with proton‐pump inhibitor‐resistant erosive esophagitis. Therap Adv Gastroenterol. 2017;10(6):439‐451. [DOI] [PMC free article] [PubMed] [Google Scholar]
- 13. Kawai T, Oda K, Funao N, et al. Vonoprazan prevents low‐dose aspirin‐associated ulcer recurrence: randomised phase 3 study. Gut. 2018;67(6):1033‐1041. [DOI] [PMC free article] [PubMed] [Google Scholar]
- 14. Kinoshita Y, Sakurai Y, Shiino M, et al. Evaluation of the efficacy and safety of vonoprazan in patients with nonerosive gastroesophageal reflux disease: a phase III, randomized, double‐blind, placebo‐controlled, multicenter study. Curr Ther Res Clin Exp. 2016;81‐82:1‐7. [DOI] [PMC free article] [PubMed] [Google Scholar]
- 15. Kinoshita Y, Sakurai Y, Takabayashi N, et al. Efficacy and safety of vonoprazan in patients with nonerosive gastroesophageal reflux disease: a randomized, placebo‐controlled, phase 3 study. Clin Transl Gastroenterol. 2019;10(11):e00101. [DOI] [PMC free article] [PubMed] [Google Scholar]
- 16. Miwa H, Uedo N, Watari J, et al. Randomised clinical trial: efficacy and safety of vonoprazan vs. lansoprazole in patients with gastric or duodenal ulcers ‐ results from two phase 3, non‐inferiority randomised controlled trials. Aliment Pharmacol Ther. 2017;45(2):240‐252. [DOI] [PMC free article] [PubMed] [Google Scholar]
- 17. Mizokami Y, Oda K, Funao N, et al. Vonoprazan prevents ulcer recurrence during long‐term NSAID therapy: randomised, lansoprazole‐controlled non‐inferiority and single‐blind extension study. Gut. 2018;67(6):1042‐1051. [DOI] [PMC free article] [PubMed] [Google Scholar]
- 18. Murakami K, Sakurai Y, Shiino M, Funao N, Nishimura A, Asaka M. Vonoprazan, a novel potassium‐competitive acid blocker, as a component of first‐line and second‐line triple therapy for Helicobacter pylori eradication: a phase III, randomised, double‐blind study. Gut. 2016;65(9):1439‐1446. [DOI] [PMC free article] [PubMed] [Google Scholar]
- 19. Xiao Y, Zhang S, Dai N, et al. Phase III, randomised, double‐blind, multicentre study to evaluate the efficacy and safety of vonoprazan compared with lansoprazole in Asian patients with erosive oesophagitis. Gut. 2020;69(2):224‐230. [DOI] [PMC free article] [PubMed] [Google Scholar]
- 20. Johnson JA. Influence of race or ethnicity on pharmacokinetics of drugs. J Pharm Sci. 1997;86(12):1328‐1333. [DOI] [PubMed] [Google Scholar]
- 21. Lee HH, Ho RH. Interindividual and interethnic variability in drug disposition: polymorphisms in organic anion transporting polypeptide 1B1 (OATP1B1; SLCO1B1). Br J Clin Pharmacol. 2017;83(6):1176‐1184. [DOI] [PMC free article] [PubMed] [Google Scholar]
- 22. ClinicalTrials.gov . Comparison of Vonoprazan to Esomeprazole in Participants With Symptomatic GERD Who Responded Partially to a High Dose of Proton Pump Inhibitor (PPI): NCT02743949. https://clinicaltrials.gov/ct2/show/NCT02743949. Accessed April 2021.
- 23. World Medical Association . World Medical Association Declaration of Helsinki: ethical principles for medical research involving human subjects. JAMA. 2013;310(20):2191‐2194. [DOI] [PubMed] [Google Scholar]
- 24. International Council for Harmonisation . Guideline for Good Clinical Practice E6(R2). https://database.ich.org/sites/default/files/E6_R2_Addendum.pdf. Accessed July 2021.
- 25. Food and Drug Administration . US Department of Health and Human Services, Food and Drug Administration: Guidance for industry ‐ population pharmacokinetics. https://www.fda.gov/media/128793/download. Accessed April 2021.
- 26. European Medicines Agency . Committee for Medicinal Products for Human Use: Guideline on Reporting the Results from Population Pharmacokinetic Analyses. https://www.ema.europa.eu/en/documents/scientific‐guideline/guideline‐reporting‐results‐population‐pharmacokinetic‐analyses_en.pdf. Accessed April 2021..
- 27. Levey AS, Coresh J, Greene T, et al. Expressing the Modification of Diet in Renal Disease Study equation for estimating glomerular filtration rate with standardized serum creatinine values. Clin Chem. 2007;53(4):766‐772. [DOI] [PubMed] [Google Scholar]
- 28. Kirchheiner J, Glatt S, Fuhr U, et al. Relative potency of proton‐pump inhibitors‐comparison of effects on intragastric pH. Eur J Clin Pharmacol. 2009;65(1):19‐31. [DOI] [PubMed] [Google Scholar]
- 29. Lam SK. Differences in peptic ulcer between East and West. Baillieres Best Pract Res Clin Gastroenterol. 2000;14(1):41‐52. [DOI] [PubMed] [Google Scholar]
- 30. Lam SK, Hasan M, Sircus W, Wong J, Ong GB, Prescott RJ. Comparison of maximal acid output and gastrin response to meals in Chinese and Scottish normal and duodenal ulcer subjects. Gut. 1980;21(4):324‐328. [DOI] [PMC free article] [PubMed] [Google Scholar]
- 31. Leong RW. Differences in peptic ulcer between the East and the West. Gastroenterol Clin North Am. 2009;38(2):363‐379. [DOI] [PubMed] [Google Scholar]
- 32. Bhat S, Varghese C, Carson DA, et al. Gastric dysrhythmia in gastroesophageal reflux disease: a systematic review and meta‐analysis. Esophagus. 2021;18(3):425‐435. [DOI] [PubMed] [Google Scholar]
- 33. Buckles DC, Sarosiek I, McMillin C, McCallum RW. Delayed gastric emptying in gastroesophageal reflux disease: reassessment with new methods and symptomatic correlations. Am J Med Sci. 2004;327(1):1‐4. [DOI] [PubMed] [Google Scholar]
- 34. Fass R, McCallum RW, Parkman HP. Treatment Challenges in the Management of Gastroparesis‐Related GERD. Gastroenterol Hepatol (NY). 2009;5(10 suppl 18):4‐16. [PMC free article] [PubMed] [Google Scholar]
- 35. Ott DJ, Gelfand DW, Chen YM, Wu WC, Munitz HA. Predictive relationship of hiatal hernia to reflux esophagitis. Gastrointest Radiol. 1985;10(4):317‐320. [DOI] [PubMed] [Google Scholar]
- 36. Frazzoni M, De Micheli E, Grisendi A, Savarino V. Hiatal hernia is the key factor determining the lansoprazole dosage required for effective intra‐oesophageal acid suppression. Aliment Pharmacol Ther. 2002;16(5):881‐886. [DOI] [PubMed] [Google Scholar]
Associated Data
This section collects any data citations, data availability statements, or supplementary materials included in this article.
Supplementary Materials
Additional supplemental information can be found by clicking the Supplements link in the PDF toolbar or the Supplemental Information section at the end of the web‐based version of this article.