

Abstract
Mutant isocitrate dehydrogenase 1/2 (mIDH1/2) proteins catalyze production of the oncometabolite D‐2‐hydroxyglutarate (2‐HG). Ivosidenib and enasidenib are oral inhibitors of mIDH1 and mIDH2, respectively. An open‐label phase 1 study is evaluating the safety and efficacy of ivosidenib or enasidenib combined with intensive induction and consolidation chemotherapy in adult patients with newly diagnosed mIDH1/2 acute myeloid leukemia (AML; NCT02632708). In this population, we characterized the pharmacokinetics (PK), pharmacodynamics (PD), and PK/PD relationships for ivosidenib and enasidenib.
Patients received continuous oral ivosidenib 500 mg once daily or enasidenib 100 mg once daily combined with chemotherapy. Serial blood samples were collected for measurement of the concentrations of the mIDH inhibitors. 2‐HG concentrations were measured in both plasma and bone marrow aspirates. Samples were collected from 60 patients receiving ivosidenib and 91 receiving enasidenib. For both drugs, exposures at steady state were higher than after single doses, with mean accumulation ratios (based on area under the plasma concentration–time curve from time 0 to 24 hours) of 2.35 and 8.25 for ivosidenib and enasidenib, respectively. Mean plasma 2‐HG concentrations were elevated at baseline. After multiple ivosidenib or enasidenib doses, mean trough plasma 2‐HG concentrations decreased to levels observed in healthy individuals and were maintained with continued dosing. There was a corresponding reduction in bone marrow 2‐HG concentrations. When combined with intensive chemotherapy in patients with newly diagnosed mIDH1/2 AML, ivosidenib and enasidenib demonstrated PK/PD profiles similar to those when they are given as single agents. These findings support the dosing of ivosidenib or enasidenib in combination with intensive chemotherapy for the treatment of patients with newly diagnosed mIDH1/2 AML.
Keywords: AML, enasidenib, isocitrate dehydrogenase, ivosidenib, PK/PD
Isocitrate dehydrogenase 1 and 2 (IDH1/2) are critical metabolic enzymes that catalyze the oxidative decarboxylation of isocitrate to produce α‐ketoglutarate. 1 Somatic mutations in IDH1 or IDH2 have been identified in multiple solid and hematologic malignancies, including ≈80% of lower‐grade gliomas and ≈20% of acute myeloid leukemias (AML). 2 , 3 , 4 The cancer‐associated mutations in IDH1 occur at a single residue in the active site, R132, whereas mutations in IDH2 occur at 2 residues within the active site, R140 and R172. 1 , 3 , 5 IDH2 mutations are more common in AML than IDH1 mutations, and mutations in both IDH1 and IDH2 rarely occur simultaneously. 2 Mutant IDH1/2 (mIDH1/2) proteins possess novel enzymatic activity, catalyzing the reduction of α‐ketoglutarate to produce the oncometabolite D‐2‐hydroxyglutarate (2‐HG), which accumulates to high levels in mIDH1/2 tumors. 5 , 6 It is thought that 2‐HG drives multiple oncogenic processes, including epigenetic dysregulation resulting in impaired cellular differentiation. 2 , 5 , 7 , 8
Ivosidenib and enasidenib are first‐in‐class, oral, reversible inhibitors of the mIDH1 and mIDH2 enzymes, respectively. 9 , 10 Ivosidenib is approved in the United States for the treatment of AML with a susceptible IDH1 mutation in adults with newly diagnosed AML who are ≥75 years of age or unable to undergo intensive induction chemotherapy, and in adults with relapsed or refractory (R/R) AML. Enasidenib is approved in the United States for the treatment of R/R AML with an IDH2 mutation. Both ivosidenib and enasidenib have been shown to dramatically reduce 2‐HG concentrations in patients with mIDH1/2 malignancies to levels seen in healthy individuals (72.6 ± 21.8 ng/mL) and to restore cellular differentiation. 11 , 12 , 13 , 14 , 15
Pharmacokinetic/pharmacodynamic (PK/PD) analysis of ivosidenib as a single agent in a phase 1 dose escalation and expansion study in patients with advanced mIDH1 hematologic malignancies (NCT02074839) demonstrated that ivosidenib 500 mg once daily had a long half‐life (93 hours) after a single dose, with ≈2‐fold accumulation ratio after multiple doses, and reached steady state within 14 days of dosing based on observed trough concentrations (Ctrough). 12 A substantial reduction in 2‐HG levels was observed at steady state and persisted over time. 12 After multiple doses of ivosidenib, 71% of patients receiving 500 mg once daily achieved a ≥90% reduction in plasma 2‐HG concentrations, and a >90% reduction in bone marrow 2‐HG concentrations was also observed at this dose. 12 No additional reduction in 2‐HG concentrations was observed at doses >500 mg once daily compared with 500 mg once daily. 12 In the same study, in patients with mIDH1 R/R AML who received ivosidenib 500 mg once daily, the overall response rate (ORR) was 41.6%. 11 The level of 2‐HG suppression was not found to correlate with clinical response in these patients. 11 The phase 1 study also provided data consistent with the recognized cytochrome P450 (CYP) 3A4–mediated metabolism of ivosidenib, as concomitant administration of moderate or strong CYP3A4 inhibitors resulted in decreased ivosidenib clearance and a subsequent increase in ivosidenib exposure. 12 Similarly, a study of ivosidenib in healthy participants demonstrated increased area under the plasma concentration–time curve (AUC) parameters when coadministered with the CYP3A4 inhibitor itraconazole, although the maximum observed plasma concentration (Cmax) was unaffected, suggesting that CYP3A4‐mediated intestinal/hepatic first‐pass metabolism of ivosidenib may be minimal. 16 In healthy male subjects, the primary metabolic pathways of ivosidenib were via oxidation, N‐dealkylation, N‐dearylation, and amide hydrolysis. 17 The 500 mg once‐daily ivosidenib dose was selected for further investigation on the basis of the available efficacy, safety, PK, and PD profiles.
Enasidenib was evaluated as a single agent in a phase 1/2 study in patients with advanced mIDH2 hematologic malignancies (NCT01915498). 15 Enasidenib had a long terminal half‐life (≈137 hours) with high plasma exposure after multiple doses, and reached steady state within 29 days of dosing. 15 Accumulation is ≈10‐fold with once‐daily administration (data on file). Median reduction in 2‐HG concentrations from baseline was 92.4%, 90.4%, and 93.1% for patients receiving enasidenib doses of <100 mg, 100 mg, or >100 mg, respectively. 15 Among patients receiving enasidenib 100 mg once daily, plasma 2‐HG levels were reduced from baseline by a median of 93% and a maximum of 99% in patients with IDH2‐R140Q mutations and by a median of 28% and a maximum of 94% in patients with IDH2‐R172K mutations. 15 The ORR was 38.5% for all patients receiving enasidenib 100 mg once daily; the ORR was 35.4% and 53.3% for patients with IDH2‐R140 and IDH2‐R172 mutations, respectively. 15 2‐HG suppression did not correlate with level of clinical response in the overall patient population or within the R140 and R172 mutation subgroups. Based on in vitro data, metabolism of enasidenib is likely to be mediated by multiple CYP enzymes. 18 In a study of healthy human subjects, N‐dealkylation was the major metabolic pathway of enasidenib. 19 Based on the phase 1/2 study of enasidenib, and due to its favorable clinical efficacy, safety, and PK profiles, and significant reductions in 2‐HG concentrations, the 100 mg once‐daily enasidenib dose was selected for further investigation.
An ongoing phase 1 study is evaluating the safety and efficacy of ivosidenib or enasidenib combined with intensive induction and consolidation chemotherapy in patients with newly diagnosed AML with a susceptible IDH1 or IDH2 mutation (NCT02632708). 14 Detailed methodology, and safety and efficacy findings from this study have been previously described. 14 Here, we report the plasma PK; plasma and bone marrow PD; and the PK/PD, PD/PD, and PD/clinical efficacy relationships for ivosidenib and enasidenib from this study.
Methods
Study Design
This study was conducted in accordance with the Declaration of Helsinki, and the protocol was approved by human investigation committees at participating sites. 14 The study was conducted at 17 sites across the United States, Germany, and the Netherlands (Table S1). Written informed consent was obtained before conducting any study‐related procedures. 14 This was a multicenter, open‐label, nonrandomized, phase 1 study enrolling patients ≥18 years of age with newly diagnosed mIDH1 or mIDH2 AML (ClinicalTrials.gov NCT02632708). 14 Treatment‐naïve patients with mIDH1 or mIDH2 AML received continuous oral ivosidenib 500 mg once daily or enasidenib 100 mg once daily, respectively, in combination with standard chemotherapy regimens (cytarabine [ARA‐C] with either idarubicin [IDR] or daunorubicin [DNR] during induction [1‐2 cycles], and ARA‐C alone, or mitoxantrone with etoposide [ME] during consolidation). 14 The duration of each treatment cycle was 28 days. Patients in remission at the end of consolidation could receive maintenance ivosidenib or enasidenib monotherapy until relapse, development of unacceptable toxicity, or allogeneic hematopoietic stem cell transplant. 14
Schedules for drug administration and sampling for PK/PD assessments are outlined in Figure 1. Blood samples for PK/PD were collected any time during screening. Blood samples for full PK/PD analysis were collected within 30 minutes before dosing of ivosidenib or enasidenib and at 0.5, 2, 4, 6, and 8 hours after dosing on day (D) 1 and D14 in cycle (C) 1 of induction and on C1D1 of consolidation; samples at 24 hours after dosing were derived from predose samples on induction C1D2, induction C1D15, and consolidation C1D2, respectively. Additional blood samples were collected before dosing of ivosidenib or enasidenib on consolidation C1D6 and every 12 weeks during maintenance.
Figure 1.

Study design and sampling schedule. aDuring induction and consolidation, sample collection occurred predose and at 0.5, 2, 4, 6, 8, and 24 h after dosing. bSampling for alternative enasidenib schedule (initiated C1D8) only. cPredose sampling only. AML, acute myeloid leukemia; ARA‐C, cytarabine; C, cycle; D, day; DNR, daunorubicin; ENA, enasidenib; IDR, idarubicin; IVO, ivosidenib; ME, mitoxantrone with etoposide; mIDH1/2, mutant IDH1/2; PD, pharmacodynamics; PK, pharmacokinetics; QD, once daily.
An alternative, less dose‐intensive enasidenib dosing schedule was also assessed in which enasidenib once‐daily dosing began on induction C1D8 instead of C1D1. This delay in the administration of enasidenib until the completion of anthracycline (IDR or DNR) and ARA‐C dosing was prompted by early data suggesting that patients treated with enasidenib experienced delayed hematologic recovery following induction chemotherapy (a concern that was later dismissed with further experience starting enasidenib on C1D1). 14 In this cohort evaluating delayed enasidenib administration, blood samples for PK/PD were collected within 30 minutes before enasidenib dosing, and at 0.5, 2, 4, 6, 8, and 24 hours after dosing on induction C1D8 and C1D21, and before enasidenib dosing on C1D1 of consolidation. Additional blood samples were collected before dosing on induction C1D1, C1D2, and C1D5 (days on which enasidenib was not administered) to assess concentrations of 2‐HG only. During the maintenance phase of the study, predose PK/PD samples were collected for ivosidenib and enasidenib every 12 (±1) weeks.
Bone marrow aspirates were collected for evaluation of 2‐HG. Bone marrow sampling was performed at screening and on D28 (±7 days) of the induction cycle(s). To confirm complete remission (CR) or CR with incomplete hematologic/platelet recovery (CRi/CRp) within 2 weeks of hematologic recovery following induction, bone marrow sampling was again performed before beginning consolidation C1. Further sampling was taken at any time during consolidation and maintenance if clinically indicated, at the end of consolidation, at the end of treatment, and at any time that disease progression was suspected. Additional optional bone marrow samples could be collected on D14 (±3 days) of the induction cycle(s).
Pharmacokinetic/Pharmacodynamic Sample Bioanalysis
Plasma concentrations of ivosidenib and enasidenib were measured using validated high‐performance liquid chromatography–tandem mass spectrometry methods.
Two methods were used for the quantification of plasma ivosidenib, depending on the expected concentration. A high‐range method was used for quantification of ivosidenib at concentrations of 50 to 50,000 ng/mL. The plasma sample (50 μL) was fortified with an equal volume of stable isotope‐labeled internal standard (AGI‐0018070 in acetonitrile), and protein precipitation performed by addition of 400 μL of acetonitrile. After centrifugation, 50 μL of supernatant was mixed with 200 μL acetonitrile/water (50:50, v/v), and the extract analyzed on an HPLC 1100 or 1200 system (Agilent Technologies, Santa Clara, California) coupled to an API 3000 (SCIEX, Redwood City, California). For the low‐range method, used for quantification of ivosidenib at concentrations of 1 to 1000 ng/mL, 100 μL of plasma sample was fortified with 100 μL of the same internal standard (AGI‐0018070 in acetonitrile), and protein precipitation performed by addition of 300 μL acetonitrile. After centrifugation, 300 μL of supernatant was evaporated under a nitrogen stream at ≈45°C, and the remaining residue reconstituted with 150 μL acetonitrile/water (50:50, v/v). The sample extract was analyzed on an Agilent HPLC 1100 or 1200 system coupled to a SCIEX API 4000.
For the quantification of plasma enasidenib, plasma sample (50 μL) was mixed with 25 μL of stable isotope‐labeled internal standard (AGI‐0015819 in methanol) and 125 μL filtered water. This was transferred to ISOLUTE SLE+ 200 mg Supported Liquid Extraction plates (Biotage, Uppsala, Sweden), and elution was performed twice with 500 μL of methyl t–butyl ether. The eluate was evaporated under a nitrogen stream at approximately 45°C, and the remaining residue reconstituted with acetonitrile/water/formic acid (1000:1000:2). The sample extract was analyzed on a Shimadzu LC system (Shimadzu Corp., Kyoto, Japan) coupled to a SCIEX API 4000. The lower limit of quantitation (LLOQ) for enasidenib was 20 ng/mL.
As 2‐HG is an endogenous compound, plasma and bone marrow 2‐HG concentrations were quantified based on a qualified surrogate analyte approach in which 13C5 2‐HG was used as the surrogate analyte for preparation of calibration standards and quality control samples. For 2‐HG in plasma, 100 μL of sample was mixed with 100 μL of internal standard (13C5 2‐HG‐d5) and 600 μL of methanol. After centrifugation, 50 μL of supernatant was evaporated under a nitrogen stream at ≈40°C, and the remaining residue reconstituted with 600 μL of 0.1% formic acid in water. For 2‐HG in bone marrow, 30 μL of bone marrow aspirate sample was mixed with 30 μL of internal standard (13C5 2‐HG‐d5) and 200 μL of methanol. After protein precipitation and centrifugation, 100 μL of supernatant was evaporated under a nitrogen stream at approximately 40°C, and the remaining residue was reconstituted with 300 μL of 0.1% formic acid in water. Plasma and bone marrow sample extracts were analyzed on a Shimadzu LC system coupled to a SCIEX API 5000. The LLOQ for plasma 2‐HG was 30 ng/mL and the LLOQ for bone marrow 2‐HG was 10 ng/mL.
High‐performance liquid chromatography and mass spectrometry instrument settings for all analytes are provided in Table S2.
Pharmacokinetic/Pharmacodynamic Data Analysis
PK parameters of ivosidenib and enasidenib included area under the plasma concentration‐time curve from time 0 (before dosing) up to 24 hours after dosing (AUC0‐24), maximum observed plasma concentration (Cmax), time to Cmax, and Ctrough, which were calculated using a validated version of Phoenix WinNonlin 7.0 or later (Certara, Princeton, New Jersey). PD parameters of 2‐HG were also calculated using Phoenix WinNonlin 7.0 or later, and included area under the effect concentration‐time curve from time 0 (before dosing) up to 8 hours and 24 hours after dosing (AUEC0‐8 and AUEC0‐24), change from baseline in AUEC from time 0 up to 24 hours (BAUEC0‐24), and observed response value at the end of a dosing interval (Rtrough).
Pharmacodynamic/Clinical Efficacy
Plasma 2‐HG reductions at C1D14 according to clinical response category (as defined by best overall response) were evaluated in patients treated with ivosidenib or enasidenib in combination with chemotherapy. Response categories included CR, incomplete response (comprising CRi, CRp, morphologic leukemia‐free state, and partial response), and no response (comprising stable disease and progressive disease).
Statistics
Predose concentrations of ivosidenib and enasidenib in plasma that were reported as below the limit of quantitation were set to 0 for PK and statistical analyses. Concentrations of 2‐HG in plasma and bone marrow that were reported as below the limit of quantitation were set to the value of the LLOQ for PD and statistical analyses. All plasma PK parameter calculations were performed using actual time points calculated relative to the time of study drug administration. Observed individual plasma and bone marrow concentrations and percentage inhibition of 2‐HG were analyzed using actual time points, calculated relative to the time of study drug administration. The percentage reduction of 2‐HG was calculated as follows: (baseline 2‐HG value – 2‐HG value)/baseline 2‐HG value × 100. Other plasma 2‐HG PD parameters were computed without baseline adjustment.
Results
Data Analyzed
As of the December 13, 2018, data cutoff, the induction and consolidation periods of the study were completed while the maintenance phase of the study was ongoing. PK/PD samples were available from a total of 59, 55, and 35 patients receiving ivosidenib at induction C1D1, induction C1D14, and consolidation C1D1, respectively. In patients receiving enasidenib starting on C1D1 or C1D8, PK samples were available from 90 and 42 patients, respectively, on induction C1D1/C1D8 and consolidation C1D1 visits. PD samples for patients starting enasidenib at C1D1 were available from a total of 67 and 66 patients at induction C1D1 and induction C1D14, respectively. For patients starting enasidenib at C1D8, PD samples were available from a total of 23 and 19 patients at induction C1D8 and induction C1D21, respectively. Samples were excluded from summary statistics and PK/PD analysis for several reasons, including: blood draw time deviations, changes from the planned dose, and missed doses (where the patient took ≤70% of scheduled doses). For single‐dose PK/PD profiles, where a patient had a missing predose value, the PD parameters were excluded from the summary statistics.
Pharmacokinetics
For both ivosidenib and enasidenib, PK parameters (Cmax, Ctrough, and AUC0‐24) were generally comparable between induction chemotherapy regimens (ARA‐C + DNR vs ARA‐C + IDR); therefore, the observations reported here are for the 2 induction regimens (ARA‐C + DNR or ARA‐C + IDR) combined. For enasidenib, summaries of PK parameters were generally comparable between the dosing schedules (ie, enasidenib starting on C1D1 or C1D8 of induction); therefore, some of the observations reported here are for both dosing schedules combined at the same point during treatment with enasidenib (eg, C1D1 combined with C1D8, and C1D14 combined with C1D21). For consolidation, all summaries of ivosidenib and enasidenib PK parameters are combined for both regimens tested (ME or ARA‐C).
Ivosidenib and enasidenib were rapidly absorbed, with peak plasma concentrations occurring at a median of ≈4 hours following single and multiple doses (Table 1). Exposures at steady state were higher than exposures after a single dose, with mean estimated accumulation ratios (calculated as induction C1D14/induction C1D1 or induction C1D21/induction C1D8) of 2.35 and 8.25 using AUC0‐24, and 1.69 and 6.51 using Cmax for ivosidenib and enasidenib, respectively, following 14 days of once‐daily dosing.
Table 1.
Summary of PK/PD Parameters After Single and Multiple Doses of Ivosidenib or Enasidenib in Combination With Induction and Consolidation Chemotherapy
| Ivosidenib | Enasideniba | |||||
|---|---|---|---|---|---|---|
| PK Parameters | Induction C1D1 | Induction C1D14 | Consolidation C1D1 | Induction C1D1 + C1D8 | Induction C1D14 + C1D21 | Consolidation C1D1 |
| N | 54 | 50 | 32 | 84 | 75 | 24 |
| Cmax, ng/mL, mean (SD); n | 5000 (1670); 54 | 8210 (3080); 50 | 5000 (2030); 31 | 1410 (521); 84 | 8820 (3410); 75 | 9780 (4590); 24 |
| Ctrough, ng/mL, mean (SD); n | N/A | 5600 (2650); 48 | 2890 (1670); 29 | N/A | 7270 (3080); 66 | 7190 (4000); 23 |
| tmax, h, median (min, max); n | 3.99 (1.93, 23.63); 54 | 3.92 (0.52, 22.75); 50 | 3.93 (1.95, 23.33); 31 | 4.04 (1.88, 24.37); 84 | 4.18 (0.00, 23.75); 75 | 2.08 (0.00, 8.02); 24 |
| AUC0‐24, ng • h/mL, mean (SD); n | 65 600 (22 400); 48 | 149 300 (59 600); 44 | 79 100 (34 500); 26 | 23 200 (8500); 70 | 173 300 (68 700); 55 | 162 900 (78 600); 20 |
| Racc AUC0‐24, mean (SD); n | N/A | 2.35 (1.2); 38 | 1.38 (0.83); 24 | N/A | 8.25 (3.33); 47 | 7.93 (4.29); 18 |
| Racc Cmax, mean (SD); n | N/A | 1.69 (0.71); 49 | 1.21 (0.69); 30 | N/A | 6.51 (2.56); 70 | 7.15 (4.59); 24 |
| Enasidenib Starting Day 1 | Enasidenib Starting Day 8 | |||||||
|---|---|---|---|---|---|---|---|---|
| Plasma PD Parameters | Induction C1D1 | Induction C1D14 | Consolidation C1D1 | Induction C1D1 | Induction C1D14 | Induction C1D8 | Induction C1D21 | Consolidation C1D1 |
| N | 51 | 50 | 30 | 60 | 57 | 20 | 18 | 24 |
| Baseline, ng/mL, mean (RSD%); n | 1440 (74.1); 51 | 1390 (70.8); 49 | 1410 (77.9); 30 | 1360 (161.1); 60 | 1410 (159.7); 57 | 962 (91.9); 20 | 1050 (85.3); 18 | 1420 (219.6); 24 |
| AUEC0‐24, ng • h/mL, mean (RSD%); n | 16 900 (137.4); 49 | 1120 (51.8); 47 | 1090 (39.8); 29 | 22 000 (119.9); 57 | 2030 (134.4); 45 | 3960 (72.5); 16 | 1670 (130.2); 15 | 1800 (116.1); 21 |
| %BAUEC0‐24, mean (RSD%); n | 53.0 (30.5); 48b | 90.0 (23.8); 46 | 91.0 (16.9); 28 | 18.7 (108.0); 57 | 85.0 (24.7); 45 | 73.9 (28.1); 16 | 83.1 (34.6); 15 | 80.6 (25.1); 21 |
| Rtrough, ng/mL, mean (RSD%); n | 594 (479.8); 49 | 50.7 (57.7); 47 | 47.3 (45.1); 29 | 754 (142.7); 57 | 91.2 (139.9); 45 | 116 (59.4); 16 | 73.9 (148.3); 15 | 81.2 (102.7); 21 |
| %Rtrough, mean (RSD%); n | 80.8 (28.1); 48b | 89.8 (23.9); 46 | 90.7 (17.2); 28 | 37.8 (68.2); 57 | 84.7 (24.6); 45 | 82.8 (18.0); 16 | 82.3 (40.5); 15 | 77.1 (37.8); 21 |
%BAUEC0‐24, percentage reduction based on area under the effect concentration–time curve from time zero (predose) to 24 h; %Rtrough, percentage reduction value at the end of a dosing interval; 2‐HG, D‐2‐hydroxyglutarate; AUC0‐24, area under the plasma concentration–time curve from time 0 to 24 h after dosing; AUEC0‐24, area under the effect concentration–time curve from time 0 (predose) to 24 h; BAUEC0‐24, change from baseline in AUEC from time point 0 (predose) to 24 hours; BLQ, below the limit of quantitation; C, cycle; Cmax, maximum observed plasma concentration; Ctrough, observed concentration at the end of a dosing interval; D, day; N/A, not applicable; PD, pharmacodynamics; PK, pharmacokinetics; Racc AUC0‐24, accumulation ratio based on AUC0‐24; Racc Cmax, accumulation ratio based on Cmax; RSD, relative standard deviation; Rtrough, observed response value at the end of a dosing interval; SD, standard deviation; tmax, time to maximum observed plasma concentration.
One patient in the enasidenib cohort showed an unexpected high increase in 2‐HG levels compared with baseline at consolidation C1D1, likely due to a lack of enasidenib dosing for ≈20 days between the end of the induction therapy and the start of consolidation C1D1; data for this patient are excluded.
aPK parameters were similar between the 2 enasidenib regimens (starting C1D1 or C1D8) and, therefore, PK parameters for the corresponding time points (C1D1 and C1D8; C1D14 and C1D21) are presented for the overall enasidenib cohort. Differences were observed between the 2 enasidenib regimens (starting C1D1 or C1D8) and, therefore, PD parameters are presented separately.
bOne patient had unexpected 2‐HG increase from baseline based on Rtrough (–2570%), and BAUEC0‐24 (–852%).
On the basis of Ctrough across treatment cycles, steady‐state PK was achieved within 14 days of continuous dosing for both ivosidenib and enasidenib (Figure 2). For ivosidenib, mean Ctrough was generally higher during induction, but was also highly variable, compared with levels observed at the start of consolidation therapy, which remained constant throughout the maintenance phase. For enasidenib, steady state was maintained upon reaching consolidation; there were insufficient data available during the maintenance phase (n ≤ 3) to determine any meaningful trends.
Figure 2.

Plasma trough (predose) concentrations over time of ivosidenib or enasidenib in combination with chemotherapy. Cohorts for which enasidenib dosing was started on induction C1D1 or C1D8 are indicated by (D1) or (D8), respectively. Numbers above box plots represent numbers of patients. Solid lines represent medians and boxes represent interquartile ranges. Error bars were calculated using Tukey's method. For timepoints with n < 5, data are presented as scatter plots with medians. Plasma concentrations of ivosidenib and enasidenib reported as BLQ were set to 0. BLQ, below the limit of quantification; C, cycle; D, day; ENA, enasidenib; IVO, ivosidenib; QD, once daily.
Pharmacodynamics
For both ivosidenib and enasidenib, PD parameters were generally comparable between induction chemotherapy regimens (ARA‐C + DNR vs. ARA‐C + IDR); therefore, the observations reported here are combined across induction regimens. There were differences in the PD parameters between the 2 enasidenib dosing schedules (ie, starting on induction C1D1 or C1D8); therefore, results reported here are given separately for these 2 different enasidenib dosing regimens. For consolidation, all ivosidenib and enasidenib PD parameters reported are combined across all treatment regimens (ARA‐C at different doses or ME).
The mean plasma 2‐HG concentration in healthy volunteers was previously shown to be 72.6 ng/mL. 13 In comparison, the plasma 2‐HG concentrations of the patients treated in this study were elevated at baseline and decreased after both single and multiple doses of the ivosidenib or enasidenib combination regimens (Figure 3A). After multiple doses, mean trough plasma 2‐HG concentrations decreased to within the range observed in healthy participants (up to a 99% reduction), and 2‐HG reduction was maintained with continued ivosidenib or enasidenib dosing.
Figure 3.

(A) Plasma 2‐HG reduction over time before dosing and after multiple oral doses of ivosidenib or enasidenib in combination with chemotherapy and (B) plasma 2‐HG reduction over time after multiple oral doses of enasidenib in combination with chemotherapy in patients with either IDH2‐R140 or IDH2‐R172 mutations. Cohorts for which enasidenib dosing was started on induction C1D1 or C1D8 are indicated by (D1) or (D8), respectively. Numbers above box plots represent numbers of patients. Solid lines represent medians and boxes represent interquartile ranges. Error bars were calculated using Tukey's method. For time points with n < 5, data are presented as scatter plots with medians. Plasma 2‐HG concentrations reported as BLQ were set to the value of the LLOQ for PD analyses. aExcludes 1 patient at consolidation C1D1 with 2‐HG reduction lower than –100%. 2‐HG, D‐2‐hydroxyglutarate; BLQ, below the limit of quantification; C, cycle; D, day; ENA, enasidenib; IVO, ivosidenib; LLOQ, lower limit of quantification; QD, once daily.
In the subset of patients who started enasidenib on induction C1D8, reductions in 2‐HG concentrations had already occurred, reflecting the effect of the previously administered induction chemotherapy on the leukemic blasts. By this point in time there were reductions in 2‐HG AUEC0‐8, AUEC0‐24, and Rtrough of 71.6%, 73.9%, and 82.8%, respectively. In contrast, following the first enasidenib dose in the subset of patients who started enasidenib on induction C1D1, arithmetic mean percentage reductions of plasma 2‐HG levels based on change from baseline in AUEC from time 0 (before dosing) up to 8 hours (BAUEC0‐8), 24 hours (BAUEC0‐24), and Rtrough were lower, with values of 7.1%, 18.7%, and 37.8%, respectively. Following 14 days of treatment and at consolidation C1D1, plasma 2‐HG reductions in percentage terms were comparable between the 2 enasidenib dosing regimens.
In patients receiving the enasidenib combination, a slightly lower plasma 2‐HG reduction was observed in those with IDH2‐R172 mutations than in those with IDH2‐R140 mutations (Figure 3B). In patients who started enasidenib on C1D1, those with R140 mutations (n = 41) had a mean reduction in plasma 2‐HG concentration of 89.3% by induction C1D14, while those with R172 mutations (n = 14) had a mean reduction in plasma 2‐HG concentration of 76.9% at the same point in treatment.
Mean trough bone marrow 2‐HG concentrations also decreased (up to 99% reduction) after multiple doses of the ivosidenib or enasidenib combination regimens (Figure 4). Based on the limited data, the 2‐HG concentration in bone marrow was reduced by 81.4% to 99.9% after multiple doses of ivosidenib, and by 63% to 99.7% after multiple doses of enasidenib.
Figure 4.

Bone marrow 2‐HG reduction over time predose and after multiple oral doses of ivosidenib or enasidenib in combination with chemotherapy. Cohorts for which enasidenib dosing was started on induction C1D1 or C1D8 are indicated by (D1) or (D8), respectively. Numbers above box plots represent numbers of patients. Solid lines represent medians and boxes represent interquartile ranges. Error bars were calculated using Tukey's method. For timepoints with n < 5, data are presented as scatter plots with medians. Bone marrow 2‐HG concentrations reported as BLQ were set to the value of the LLOQ for PD analyses. aExcludes 1 patient at induction C1D22 (D8) with 2‐HG reduction lower than –100%. 2‐HG, D‐2‐hydroxyglutarate; BLQ, below the limit of quantification; C, cycle; D, day; ENA, enasidenib; IVO, ivosidenib; LLOQ, lower limit of quantification; QD, once daily.
Pharmacokinetics/Pharmacodynamics
Exploratory analyses of the relationship between plasma ivosidenib/enasidenib PK parameters and reduction of plasma 2‐HG at induction C1D14 are shown in Figure 5. As more blood samples were collected at trough level, prior to the dosing of ivosidenib or enasidenib, Ctrough was determined to be the most suitable PK parameter on which to base the PK/PD analyses. Across the range of plasma ivosidenib Ctrough, plasma 2‐HG reduction at Rtrough was mostly within the range of 95% to 99.9%. Across the range of plasma enasidenib Ctrough, plasma 2‐HG reduction (Rtrough) was mostly within the range of 60% to 100%. For both ivosidenib and enasidenib, the exposure‐response curves showed no clear exposure‐dependent 2‐HG reduction since near‐maximal suppression was observed after multiple daily administration of 500 mg or 100 mg, respectively.
Figure 5.

2‐HG reduction vs Ctrough for ivosidenib or enasidenib in combination with chemotherapy (induction C1D14). 2‐HG, D‐2‐hydroxyglutarate; C, cycle; Ctrough, observed concentration at the end of a dosing interval; D, day; ENA, enasidenib; IVO, ivosidenib; QD, once daily; Rtrough, observed response value at the end of a dosing interval.
Pharmacodynamics/Pharmacodynamics
Exploratory analyses of visit‐matched plasma and bone marrow aspirate samples showed that 2‐HG concentrations in bone marrow samples correlated with those in plasma following multiple daily doses of ivosidenib or enasidenib in combination with induction and consolidation chemotherapy (Figure 6).
Figure 6.
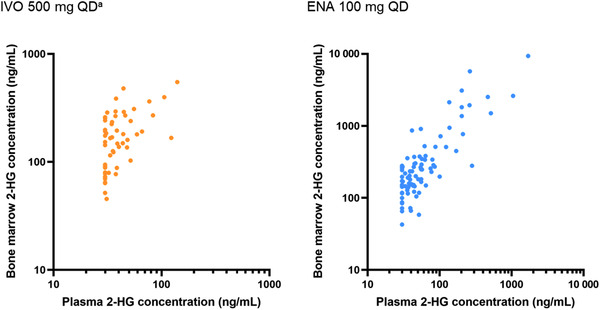
Comparisons of 2‐HG concentrations in bone marrow and plasma after oral doses of ivosidenib or enasidenib in combination with chemotherapy. Plasma BLQ values were set to the value of the LLOQ (ie, 30 ng/mL) owing to the endogenous nature of 2‐HG levels in humans. aExcludes 1 patient with unexpectedly high bone marrow 2‐HG level at induction C1D14 that exceeded the baseline level. 2‐HG, D‐2‐hydroxyglutarate; BLQ, below the limit of quantification; C, cycle; D, day; ENA, enasidenib; IVO, ivosidenib; LLOQ, lower limit of quantification; QD, once daily.
Pharmacodynamics/Clinical Efficacy
Based on plasma 2‐HG at C1D14 and best overall response, no differences were observed in plasma 2‐HG reductions among the clinical response categories in patients treated with ivosidenib or with enasidenib (Figure 7).
Figure 7.

Plasma 2‐HG reduction at induction C1D14 by best overall response after multiple oral doses of ivosidenib or enasidenib in combination with chemotherapy. Solid lines represent medians and boxes represent interquartile ranges. Error bars were calculated using Tukey's method. 2‐HG, D‐2‐hydroxyglutarate; C, cycle; CR, complete remission; D, day; ENA, enasidenib; IR, incomplete remission (comprising CR with incomplete hematologic/platelet recovery, morphologic leukemia‐free state, and partial response); IVO, ivosidenib; NR, no response (comprising stable disease and progressive disease); QD, once daily.
Discussion
When combined with intensive induction and consolidation chemotherapy in patients with newly diagnosed mIDH1 or mIDH2 AML, ivosidenib and enasidenib demonstrated PK profiles similar to those observed with their use as single agents, with high plasma exposures relative to those needed for target inhibition. The PK profiles for both ivosidenib and enasidenib were similar between the two induction chemotherapy regimens, demonstrating rapid absorption and the achievement of steady‐state concentrations within 14 days of dosing for both agents. The mean estimated accumulation ratios for enasidenib of 7.62 based on AUC0‐24 and 6.06 based on Cmax following 14 days of dosing indicate the importance of accumulation during treatment with this inhibitor. The PD profiles of ivosidenib and enasidenib were also similar to those observed in previous studies, 12 , 15 and appeared to be similar across the chemotherapy cohorts.
As both ivosidenib and enasidenib are substrates and potential inducers of multiple CYPs, drug‐drug interactions may be a possibility when either of these drugs are coadministered with specific CYP substrates and inhibitors or inducers. Given the clearance mechanisms of ivosidenib and enasidenib, there is low risk of drug‐drug interactions with the chemotherapy. The PK profiles for each drug remained consistent whether they were administered in combination with ARA‐C + DNR or ARA‐C + IDR, suggesting that the chemotherapy had minimal impact on ivosidenib or enasidenib exposure. For enasidenib, this is further supported as PK profiles were consistent between the 2 different dosing schedules.
Overall, plasma concentrations of 2‐HG were reduced to within the range found in healthy individuals, as observed in studies of ivosidenib and enasidenib given as single agents. 12 , 13 For patients who started enasidenib on induction C1D8, the delay in starting enasidenib treatment had no impact on overall plasma 2‐HG reduction compared with those who started on induction C1D1. However, we observed differences in PD profiles between these patient groups at the start of enasidenib treatment, with mean plasma 2‐HG reductions of 37.8% at C1D1 for patients starting enasidenib on C1D1 and 82.8% at C1D8 for those starting on C1D8. This likely reflects the effect of induction chemotherapy in the patients who started enasidenib on induction C1D8, with a reduction in leukemic cells in the period before the start of enasidenib treatment, resulting in a reduction in plasma 2‐HG. In addition, a high coefficient of variability was observed for induction C1D1 2‐HG levels in patients who started enasidenib on induction C1D1 based on %Rtrough (68%).
Across visits, 2‐HG reduction following enasidenib treatment was numerically lower in patients with IDH2‐R172 mutations than in patients with IDH2‐R140 mutations. However, the smaller sample size for IDH2‐R172 mutations than for IDH2‐R140 mutations contributed to the increased variability in reduction of plasma 2‐HG in the IDH2‐R172 patient subgroup. There was no association between 2‐HG reduction observed at C1D14 and clinical response, following enasidenib treatment. In the phase 1/2 study of enasidenib as a single agent in patients with advanced mIDH2 myeloid malignancies, a greater ORR was observed for those with IDH2‐R172 mutations than those with IDH‐R140 mutations. 15 Any conclusions regarding potential relationships between 2‐HG reduction and efficacy in patients with IDH2‐R140 or ‐R172 mutations are limited by the small numbers of patients with IDH2‐R172 mutations receiving enasidenib in each of these analyses. Preclinical and in vitro data suggest that enasidenib is less potent against IDH2‐R172 than against IDH2‐R140. 10 However, since the median 2‐HG reduction was >90% in patients with advanced hematological malignancies who received enasidenib as a single agent at a range of doses (50‐650 mg/day) 15 and >75% in this study, these potency differences may not be relevant at the doses used clinically.
Bone marrow 2‐HG correlated with plasma 2‐HG concentrations following multiple daily administrations of ivosidenib or enasidenib in combination with different AML induction and consolidation therapies, suggesting that plasma 2‐HG concentrations can serve as a potential surrogate marker for reduction of bone marrow 2‐HG. Although there were modest decreases in ivosidenib predose concentrations following the completion of induction therapy, likely due to the known autoinduction of CYP3A by ivosidenib, 12 there was no associated effect on the reductions in mean trough plasma 2‐HG concentrations, which remained within the range observed in healthy participants.
Overall, 2‐HG levels in patients who received ivosidenib or enasidenib in combination with ARA‐C + DNR or ARA‐C + IDR were reduced to levels observed in healthy individuals, and PK parameters for ivosidenib and enasidenib were similar for differing induction chemotherapy regimens. Following enasidenib treatment, minor differences in levels of 2‐HG reduction were observed between patients with IDH2‐R140 and IDH2‐R172 mutations, and between patients starting enasidenib on C1D1 and those starting on C1D8.
Conclusions
These findings support the dosing of ivosidenib or enasidenib in combination with intensive induction and consolidation chemotherapy with ARA‐C + DNR or ARA‐C + IDR for the treatment of patients with newly diagnosed mIDH1/2 AML.
Conflicts of Interest
B.F., F.Y., L.H., C.A., S.N., M.C., H.Y., and M.H. were employees of and held stock/ownership interests in Agios at the time of this study. M.C. and M.H. are employees of Servier. Y.C. is an employee of and holds stock/ownership interests in Agios.
Funding
This study was funded by Agios Pharmaceuticals, Inc. in collaboration with Bristol‐Myers Squibb. Medical writing assistance was provided by David Pertab, PhD, Excel Medical Affairs, Glasgow, UK, and supported by Agios Pharmaceuticals, Inc and Servier Pharmaceuticals LLC.
Data Sharing
The data collected for the study will not be made available to others. Qualified researchers may request access to related clinical study documents. Please send your data‐sharing requests to https://clinicaltrials.servier.com/data‐request‐portal/.
Supporting information
Supporting Information.
References
- 1. Dang L, Yen K, Attar EC. IDH mutations in cancer and progress toward development of targeted therapeutics. Ann Oncol. 2016;27(4): 599‐608. [DOI] [PubMed] [Google Scholar]
- 2. Medeiros BC, Fathi AT, DiNardo CD, Pollyea DA, Chan SM, Swords R. Isocitrate dehydrogenase mutations in myeloid malignancies. Leukemia. 2017;31(2): 272‐281. [DOI] [PMC free article] [PubMed] [Google Scholar]
- 3. Yan H, Parsons DW, Jin G, et al. IDH1 and IDH2 mutations in gliomas. N Engl J Med. 2009;360(8): 765‐773. [DOI] [PMC free article] [PubMed] [Google Scholar]
- 4. Cancer Genome Atlas Research Network, Brat DJ, Verhaak RGW, et al. Comprehensive, integrative genomic analysis of diffuse lower‐grade gliomas. N Engl J Med. 2015;372(26):2481‐2498. [DOI] [PMC free article] [PubMed] [Google Scholar]
- 5. Dang L, White DW, Gross S, et al. Cancer‐associated IDH1 mutations produce 2‐hydroxyglutarate. Nature. 2009;462(7274): 739‐744. [DOI] [PMC free article] [PubMed] [Google Scholar]
- 6. Ward PS, Patel J, Wise DR, et al. The common feature of leukemia‐associated IDH1 and IDH2 mutations is a neomorphic enzyme activity converting alpha‐ketoglutarate to 2‐hydroxyglutarate. Cancer Cell. 2010;17(3):225‐234. [DOI] [PMC free article] [PubMed] [Google Scholar]
- 7. Lu C, Ward PS, Kapoor GS, et al. IDH mutation impairs histone demethylation and results in a block to cell differentiation. Nature. 2012;483(7390):474‐478. [DOI] [PMC free article] [PubMed] [Google Scholar]
- 8. Xu W, Yang H, Liu Y, et al. Oncometabolite 2‐hydroxyglutarate is a competitive inhibitor of α‐ketoglutarate‐dependent dioxygenases. Cancer Cell. 2011;19(1):17‐30. [DOI] [PMC free article] [PubMed] [Google Scholar]
- 9. Popovici‐Muller J, Lemieux RM, Artin E, et al. Discovery of AG‐120 (ivosidenib): a first‐in‐class mutant IDH1 inhibitor for the treatment of IDH1 mutant cancers. ACS Med Chem Lett. 2018;9(4):300‐305. [DOI] [PMC free article] [PubMed] [Google Scholar]
- 10. Yen K, Travins J, Wang F, et al. AG‐221, a first‐in‐class therapy targeting acute myeloid leukemia harboring oncogenic IDH2 mutations. Cancer Discov. 2017;7(5):478‐493. [DOI] [PubMed] [Google Scholar]
- 11. DiNardo CD, Stein EM, de Botton S, et al. Durable remissions with ivosidenib in IDH1‐mutated relapsed or refractory AML. N Engl J Med. 2018;378(25):2386‐2398. [DOI] [PubMed] [Google Scholar]
- 12. Fan B, Dai D, DiNardo CD, et al. Clinical pharmacokinetics and pharmacodynamics of ivosidenib in patients with advanced hematologic malignancies with an IDH1 mutation. Cancer Chemother Pharmacol. 2020;85(5):959‐968. [DOI] [PubMed] [Google Scholar]
- 13. Fan B, Mellinghoff IK, Wen PY, et al. Clinical pharmacokinetics and pharmacodynamics of ivosidenib, an oral, targeted inhibitor of mutant IDH1, in patients with advanced solid tumors. Invest New Drugs. 2020;38(2):433‐444. [DOI] [PMC free article] [PubMed] [Google Scholar]
- 14. Stein EM, DiNardo CD, Fathi AT, et al. Ivosidenib or enasidenib combined with intensive chemotherapy in patients with newly diagnosed AML: a phase 1 study. Blood. 2021;137(13): 1792‐1803. [DOI] [PMC free article] [PubMed] [Google Scholar]
- 15. Stein EM, DiNardo CD, Pollyea DA, et al. Enasidenib in mutant IDH2 relapsed or refractory acute myeloid leukemia. Blood. 2017;130(6):722‐731. [DOI] [PMC free article] [PubMed] [Google Scholar]
- 16. Dai D, Yang H, Nabhan S, et al. Effect of itraconazole, food, and ethnic origin on the pharmacokinetics of ivosidenib in healthy subjects. Eur J Clin Pharmacol. 2019;75(8):1099‐1108. [DOI] [PubMed] [Google Scholar]
- 17. Prakash C, Fan B, Altaf S, Agresta S, Liu H, Yang H. Pharmacokinetics, absorption, metabolism, and excretion of [14C]ivosidenib (AG‐120) in healthy male subjects. Cancer Chemother Pharmacol. 2019;83(5):837‐848. [DOI] [PubMed] [Google Scholar]
- 18. Li Y, Liu L, Gomez D, et al. Pharmacokinetics and safety of Enasidenib following single oral doses in Japanese and Caucasian subjects. Pharmacol Res Perspect. 2018;6(6):e00436. [DOI] [PMC free article] [PubMed] [Google Scholar]
- 19. Tong Z, Atsriku C, Yerramilli U, et al. Absorption, distribution, metabolism and excretion of an isocitrate dehydrogenase‐2 inhibitor enasidenib in rats and humans. Xenobiotica. 2019;49(2):200‐210. [DOI] [PubMed] [Google Scholar]
Associated Data
This section collects any data citations, data availability statements, or supplementary materials included in this article.
Supplementary Materials
Supporting Information.