

Abstract
Aims
To investigate the seroconversion following first and second COVID‐19 vaccination in people with type 1 and type 2 diabetes in relation to glycaemic control prior to vaccination and to analyse the response in comparison to individuals without diabetes.
Materials and methods
This prospective, multicentre cohort study analysed people with type 1 and type 2 diabetes and a glycated haemoglobin level ≤58 mmol/mol (7.5%) or >58 mmol/mol (7.5%), respectively, and healthy controls. Roche's Elecsys anti‐SARS‐CoV‐2 S immunoassay targeting the receptor‐binding domain was used to quantify anti‐spike protein antibodies 7 to 14 days after the first and 14 to 21 days after the second vaccination.
Results
A total of 86 healthy controls were enrolled in the study, as well as 161 participants with diabetes, of whom 150 (75 with type 1 diabetes and 75 with type 2 diabetes) were eligible for the analysis. After the first vaccination, only 52.7% of participants in the type 1 diabetes group and 48.0% of those in the type 2 diabetes group showed antibody levels above the cut‐off for positivity. Antibody levels after the second vaccination were similar in participants with type 1 diabetes, participants with type 2 diabetes and healthy controls after adjusting for age, sex and multiple testing (P > 0.05). Age (r = −0.45, P < 0.001) and glomerular filtration rate (r = 0.28, P = 0.001) were significantly associated with antibody response.
Conclusions
Anti‐SARS‐CoV‐2 S receptor‐binding domain antibody levels after the second vaccination were comparable in healthy controls and in participants with type 1 and type 2 diabetes, irrespective of glycaemic control. Age and renal function correlated significantly with the extent of antibody levels.
Keywords: COVID‐19, observational study, type 1 diabetes, type 2 diabetes
1. INTRODUCTION
After the first occurrence of the SARS‐CoV‐2 virus causing the coronavirus disease (COVID‐19) in China in December 2019, the virus has rapidly spread globally, leading to the declaration of a COVID‐19 pandemic in March 2020 by the World Health Organization (WHO). 1 Reports from China, 2 , 3 Europe 4 and the United States 5 demonstrated that the prevalence of diabetes is as high as 20% in people hospitalized for COVID‐19. Moreover, diabetes is frequent in people experiencing a severe or fatal disease course of COVID‐19, 6 with an in‐hospital mortality reported to be as high as 25% in people with diabetes mellitus. 7
People with diabetes are therefore usually considered a high‐risk population for experiencing adverse COVID‐19 outcomes and, consequently, COVID‐19 vaccination is highly recommended in this population, leading to prioritization in current vaccination strategies of most countries. 8 Given that a compromised immune response to SARS‐CoV‐2 has been discussed as a possible reason for the increased risk of severe COVID‐19 in people with diabetes, there also remains the question of whether people with diabetes have a reduced immune response following SARS‐CoV‐2 vaccinations. While most studies on hepatitis B vaccination have demonstrated reduced immunogenicity in people with diabetes, 9 data on other vaccinations, including those against influenza, were mostly inconclusive. 9
While phase III studies on both mRNA‐ and adenovirus‐based COVID‐19 vaccines have included people with diabetes and the efficacy rates at least for mRNA vaccines in people with diabetes appear to be similar to those among their counterparts without diabetes, 10 , 11 , 12 , 13 , 14 data on the characteristics of the included people with diabetes are sparse. Recently, a study suggested that lower antibody levels are present in response to COVID‐19 vaccination in people with diabetes. However, the number of people with diabetes included was limited and there was no differentiation between type 1 and type 2 diabetes nor details of the potential impact of glycaemic control prior to receiving the vaccine. 15
The aim of this study, therefore, was to investigate the humoral immune response and side effects related to COVID‐19 vaccines in people with type 1 and type 2 diabetes in order to elucidate the impacts of type of diabetes and glycaemic control on antibody response following COVID‐19 vaccinations. Moreover, we aimed to compare antibody levels to the receptor‐binding domain (RBD) of the SARS‐CoV‐2 S protein after COVID‐19 vaccination in people with diabetes to healthy, non‐diabetes controls.
2. MATERIALS AND METHODS
The “Immune response to Covid‐19 vaccination in people with Diabetes Mellitus – COVAC‐DM” study was a prospective, multicentre, real‐world, cohort study including 161 individuals with diabetes mellitus at two centres in Austria (Medical University of Graz and Medical University of Innsbruck) and one centre in Germany (University of Bayreuth). We included adults with type 1 or type 2 diabetes, aged 18 to 80 years, who were diagnosed with diabetes prior to receiving a COVID‐19 vaccine and who were willing to give written informed consent. The main exclusion criteria were: active malignancy (excluding intraepithelial neoplasia of the prostate gland and the gastrointestinal tract and basalioma); pregnancy; acute inflammatory disease; immunosuppressant therapy; alcohol abuse (more than 15 standard drinks a week); or any contraindication to the vaccine as well as a previous episode of COVID‐19.
People with established type 1 or type 2 diabetes and planned COVID‐19 vaccination were recruited from outpatient clinics at the participating sites, from the Graz Diabetes Registry for Biomarker Research, and through advertisements in local newspapers.
Participants were then classified according to their glycated haemoglobin (HbA1c) and type of diabetes into one of the four predefined groups: type 1 diabetes with an HbA1c level ≤58 mmol/mol (≤7.5%), type 1 diabetes with an HbA1c level >58 mmol/mol (>7.5%), type 2 diabetes with an HbA1c level ≤58 mmol/mol (≤7.5%) and type 2 diabetes with an HbA1c level >58 mmol/mol (>7.5%).
All participants were asked to attend on‐site visits 60 to 2 days prior to their first vaccination, 7 to 14 days after their first vaccination and 14 to 21 days after their second vaccination. A physical examination was performed and blood samples were taken. Data on medical history and medication were collected at baseline and information about side effects from vaccination including severe allergic reaction, local injection site reaction (swelling, redness, pain), elevated body temperature between 37°C and 38°C or body temperature >38°C, headache, arthralgia, fatigue, or hospitalization within 14 days after vaccination were recorded at all follow‐up visits. Biobank samples (serum, plasma) are stored at −80°C at Biobank Graz, located at the Medical University of Graz, for further analysis. Antibody tests were conducted at the D&F Institute of Hygiene, Microbiology and Environmental Medicine at the Medical University of Graz. A CE‐marked serological test was used according to the manufacturer's protocols to determine and quantify specific antibodies against SARS‐CoV‐2. Total immunoglobulin (Ig) was determined using the Roche Elecsys anti‐SARS‐CoV‐2 S electrochemiluminescence immunoassay targeting the RBD of the viral spike protein using a Cobas e 801 analytical unit (Roche Diagnostics GmbH, Mannheim, Germany) with a cut‐off for positivity of 0.8 U/mL. According to Roche's protocol 16 no converting factor is needed to calculate binding antibody units per millilitre, which were retrospectively established for harmonization of different assays’ results and are traceable to the WHO international standard for anti‐SARS‐CoV‐2 Ig. 17
In addition, antibody levels, measured 14 to 21 days after the second COVID‐19 vaccination in a cohort of 86 healthy people, recruited in a partner study (EudraCT: 2021‐001040‐10) at the Medical University of Graz, were used for group comparisons.
The study protocol was approved by the ethics committees of the Medical University of Graz (33‐366 ex 20/21) and the Bayerische Landesaerztekammer (Nr. 21 031) as well as registered at the European Union Drug Regulation Authorities Clinical Trials registry (EudraCT‐Number 2021‐001459‐15). The study was conducted according to the guidelines of Good Clinical Practice and the Declaration of Helsinki. Prior to study inclusion, participants were informed about all study procedures by a physician and provided written informed consent.
2.1. Statistical analysis
Data were extracted in Microsoft Excel and analysed in Stata version 16 and R studio 1.4.1. Categorical variables were summarized as frequencies and percentages (%). Quantitative variables were summarized as means and standard deviations (±SD). Categorical variables were compared with diabetes groups using chi‐squared or Fisher's exact tests, as appropriate. Quantitative variables were compared with diabetes groups using one‐way analysis of variance tests. Post‐vaccination, side effects were compared between people with type 1 diabetes and type 2 diabetes using chi‐squared or Fisher's exacts tests, as appropriate. Anti‐SARS‐CoV‐2 S antibodies were summarized as median with interquartile range (IQR). The median anti‐SARS‐CoV‐2 S antibody levels were compared between diabetes groups and healthy controls using Kruskal‐Wallis tests. These group comparisons were adjusted for age and sex using quantile regression and further corrected for multiple comparisons using post‐hoc Bonferroni correction, or Wilcoxon's signed‐rank test, respectively. The correlation of anti‐SARS‐CoV‐2 S antibodies with quantitative variables was assessed using the Pearson correlation method. The P value of <0.05 was chosen to indicate statistical significance.
3. RESULTS
We enrolled 161 participants with diabetes between April and June 2021 in the study, of whom 150 were included in the final analysis (Figure S1). Two participants withdrew consent, six participants decided to postpone their vaccination for a longer period after the baseline visit and three participants had positive anti‐SARS‐CoV‐2 S antibodies at baseline without knowingly having had a COVID‐19 episode before. (Figure S1). Seventy‐five participants had type 1 diabetes (34 of whom were women) with 49 in the HbA1c ≤58 mmol/mol group and 26 in the HbA1c >58 mmol/mol group. In addition, 75 participants had type 2 diabetes (34 of whom were women), with 37 in the HbA1c ≤58 mmol/mol group and 38 in the HbA1c >58 mmol/mol group. Participants with type 2 diabetes were older as compared to those with type 1 diabetes (56.6 ± 9.9 years vs. 41.5 ± 14.5 years; P < 0.001) and had a higher prevalence of hypertension, hyperlipidaemia, liver disease and polyneuropathy (all P < 0.05). Of all participants, 86% received the BioNTech/Pfizer, 8.7% the Moderna and 5.3% the AstraZeneca vaccine. Vaccine distribution was similar in all four groups of participants with diabetes (P = 0.542). The mean time between the baseline visit and the first vaccination was 11 ± 13 days. A full list of the baseline characteristics of all four groups of study participants is provided in Table 1.
TABLE 1.
Baseline characteristics (N = 150)
| Variables | All | T1DM and HbA1c > 58 mmol/mol | T1DM and HbA1c ≤ 58 mmol/mol | T2DM and HbA1c > 58 mmol/mol | T2DM and HbA1c ≤ 58 mmol/mol | P value |
|---|---|---|---|---|---|---|
| (N = 150) | (N = 26) | (N = 49) | (N = 38) | (N = 37) | ||
| Age | 49.2 ± 14.5 | 42.7 ± 14.0 | 40.8 ± 14.8 | 56.9 ± 9.6 | 56.3 ± 10.3 | <0.001 |
| Sex, n (%) | ||||||
| Female | 68 (45.3) | 10 (38.5) | 24 (49.0) | 20 (52.6) | 14 (37.8) | 0.491 |
| Male | 82 (54.7) | 16 (61.5) | 25 (51.0) | 18 (47.4) | 23 (62.2) | |
| BMI, kg/m2 | 28.7 (5.6) | 27.9 (5.1) | 24.6 (3.9) | 32.7 (5.3) | 30.5 (4.5) | <0.001 |
| Vaccine, n (%) | ||||||
| BioNTech Pfizer | 129 (86.0) | 24 (92.2) | 40 (81.6) | 35 (92.1) | 30 (81.1) | 0.542 |
| Moderna | 13 (8.7) | 1 (3.9) | 5 (10.2) | 3 (7.9) | 4 (10.8) | |
| AstraZeneca | 8 (5.3) | 1 (3.9) | 4 (8.2) | 0 (0.0) | 3 (8.1) | |
| Duration of diabetes | 16.0 ± 12.0 | 23.6 ± 13.6 | 18.1 ± 12.9 | 13.5 ± 9.4 | 10.6 ± 8.5 | <0.001 |
| Diabetes therapy, n (%) | ||||||
| Insulin | 104 (69.3) | 26 (100.0) | 48 (98.0) a | 21 (55.3) | 9 (24.3) | <0.001 |
| Metformin | 56 (37.3) | ‐ | ‐ | 28 (73.7) | 28 (75.7) | 0.843 |
| DPP‐4 inhibitors | 19 (12.7) | ‐ | ‐ | 12 (31.6) | 7 (18.9) | 0.208 |
| SGLT2 inhibitors | 27 (18.0) | ‐ | ‐ | 16 (42.1) | 11 (29.7) | 0.264 |
| GLP‐1RAs | 15 (10.0) | ‐ | ‐ | 8 (21.1) | 7 (18.9) | 0.817 |
| Comorbidity | ||||||
| Hypertension, n (%) | 66 (44.0) | 7 (26.9) | 9 (18.4) | 25 (65.8) | 25 (67.6) | <0.001 |
| Coronary heart disease, n (%) | 14 (9.3) | 1 (3.9) | 2 (4.1) | 6 (15.8) | 5 (13.5) | 0.160 |
| Myocardial infarction, n (%) | 7 (4.7) | 0 (0.0) | 1 (2.0) | 4 (10.5) | 2 (5.4) | 0.209 |
| Stroke, n (%) | 5 (3.3) | 1 (3.9) | 0 (0.0) | 3 (7.9) | 1 (2.7) | 0.169 |
| Heart failure, n (%) | 4 (2.7) | 0 (0.0) | 1 (2.0) | 2 (5.3) | 1 (2.7) | 0.830 |
| PAD, n (%) | 10 (6.7) | 0 (0.0) | 2 (4.1) | 4 (10.5) | 4 (11.1) | 0.232 |
| PTCA/CABG, n (%) | 7 (4.7) | 0 (0.0) | 1 (2.0) | 3 (7.9) | 3 (8.1) | 0.327 |
| CVD, n (%) | 15 (10.0) | 1 (3.9) | 2 (4.1) | 6 (15.8) | 6 (16.2) | 0.111 |
| Hyperlipidaemia, n (%) | 70 (46.7) | 11 (42.3) | 12 (24.5) | 25 (65.8) | 22 (59.5) | <0.001 |
| Liver disease, n (%) | 23 (15.3) | 1 (3.9) | 1 (2.0) | 9 (23.7) | 12 (32.4) | <0.001 |
| History of cancer, n (%) | 8 (5.3) | 2 (7.7) | 0 (0.0) | 2 (5.3) | 4 (10.8) | 0.083 |
| Microvascular complications | ||||||
| Retinopathy, n (%) | 21 (14.0) | 7 (26.9) | 6 (12.2) | 5 (13.2) | 3 (8.1) | 0.215 |
| Polyneuropathy, n (%) | 29 (19.3) | 3 (11.5) | 3 (6.1) | 15 (39.5) | 8 (21.6) | 0.001 |
| Laboratory values | ||||||
| HbA1c, mmol/mol | 56.7 ± 12.5 | 67.9 ± 9.8 | 49.3 ± 6.7 | 67.8 ± 9.3 | 47.5 ± 6.9 | <0.001 |
| eGFR, mL/min/1.73m2 | 92.5 ± 20.9 | 96.3 ± 26.5 | 101.5 ± 17.5 | 80.6 ± 18.9 | 89.6 ± 15.9 | <0.001 |
| HDL cholesterol, mmol/L | 1.51 ± 0.50 | 1.63 ± 0.57 | 1.79 ± 0.44 | 1.22 ± 0.34 | 1.37 ± 0.47 | <0.001 |
| LDL cholesterol, mmol/L | 2.36 ± 0.88 | 2.46 ± 0.84 | 2.43 ± 0.75 | 2.2 ± 0.95 | 2.38 ± 1.02 | 0.633 |
| Triglycerides, mmol/L | 1.32 ± 1.14 | 1.13 ± 0.53 | 2.01 ± 1.88 | 0.89 ± 0.35 | 1.3 ± 0.74 | 0.121 |
Note: Qualitative variables are presented as frequencies and percentages (%). Quantitative variables are presented as means and standard deviations (±SD). Chi‐squared or Fischer's exact tests were applied to compare qualitative variables with diabetes groups. One‐way analysis of variance tests were applied to compare quantitative variables with diabetes groups.
Abbreviations: CVD, cardiovascular disease; DPP‐4, dipeptidyl peptidase‐4; GLP‐1RA, glucagon‐like peptide‐1 receptor agonist; HbA1c, glycated haemoglobin; HDL, high‐density lipoprotein; LDL, low‐density lipoprotein; PAD, peripheral artery disease; PTCA, percutaneous transluminal coronary angiography, CABG, coronary artery bypass graft; SGLT2, sodium glucose cotransporter‐2; T1DM, type 1 diabetes; T2DM, type 2 diabetes.
One participant was recently diagnosed with type 1 diabetes and off insulin at the time of enrolment (honeymoon period).
3.1. Healthy control group
For comparison we used a cohort of 86 healthy participants. Of these, 49 (57%) were women and the mean age was 48 ± 11.6 years and the mean body mass index (BMI) 24.2 ± 3.6 kg/m2. In this group, 96.5% received the Moderna and 3.5% the BioNTech/Pfizer vaccine. All participants in the healthy control group had no detectable anti‐SARS‐CoV2‐S antibodies pre‐vaccination and no history of COVID‐19.
3.2. Side effects of vaccination
Three cases of hospitalization occurred after the vaccination. One occurred 24 days after the first vaccination due to peripheral oedema and chronic heart failure; chronic heart failure was a preexisting condition in this patient. The second hospitalization took place 12 days after the second vaccination due to atrioventricular block grade 3 with subsequent pacemaker implantation, and the third hospitalization occurred due to a miscarriage after 10 weeks of pregnancy. Conception was estimated at 2 weeks after the first vaccination. No cases of severe allergic reactions were recorded throughout the study. The most common side effects were injection site reactions, occurring in 87.4% of all participants after the first and 63.3% after the second dose, with a significantly lower rate in people with type 2 diabetes at the latter vaccination. Fever was rarely reported in any of the groups (for a detailed overview see Figure 1).
FIGURE 1.
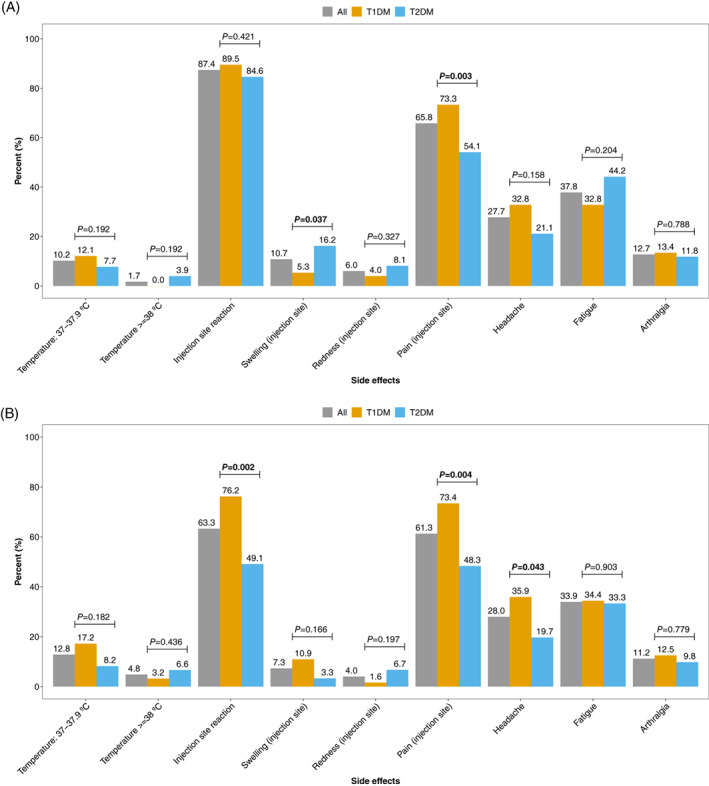
Side effects after vaccination, overall and by type of diabetes: A, after vaccination 1 and B, after vaccination 2. T1DM, type 1 diabetes; T2DM, type 2 diabetes
3.3. Antibody response
At 7 to 14 days after the first vaccination, 52.7% of the participants with type 1 diabetes and 48.0% of those with type 2 diabetes had anti‐SARS‐CoV2‐S RBD antibodies above the detection limit of 0.8, with low median levels of 1.1 (IQR 8.1) and 0.3 (IQR 2.4), respectively. When we analysed the antibody data measured after the second vaccination, we first pooled the two groups of participants with type 1 diabetes and the two groups of participants with type 2 diabetes (HbA1c ≤58 mmol/mol and >58 mmol/mol), respectively, and compared these against the healthy controls. In the unadjusted analyses we observed the highest antibody levels after second vaccination in people with type 1 diabetes (P = 0.022 vs. healthy controls and P = 0.013 vs. people with type 2 diabetes). However, these significant differences were no longer present after adjustment for age, sex and correction for multiple comparisons (Figure 2A).
FIGURE 2.
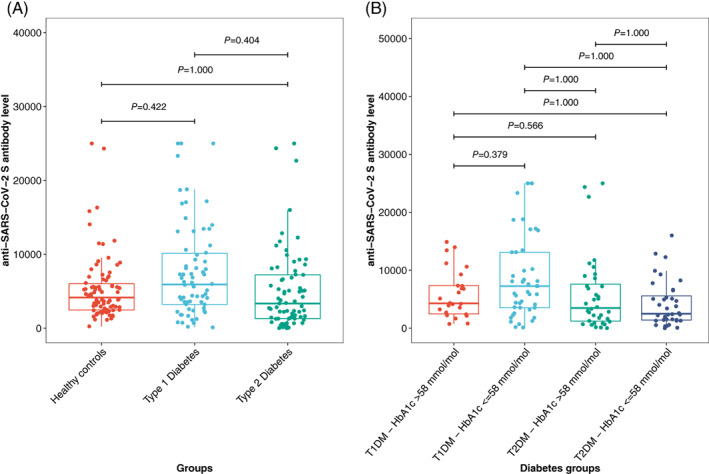
A, Comparison of anti‐SARS‐CoV‐2‐S antibodies between participants with diabetes and healthy controls after the second vaccination. B, Comparison of anti‐SARS‐CoV‐2‐S antibodies in people with type 1 (T1DM) and type 2 diabetes (T2DM) and a glycated haemoglobin (HbA1c) level of ≤58 mmol/mol or >58 mmol/mol, respectively. P values are adjusted for age and sex using quantile regression and for multiple comparison using Bonferroni correction
In addition, we investigated the impact of type of diabetes and glycaemic control on antibody response after COVID‐19 vaccination. In the group comparison corrected for multiple comparisons only, people with type 1 diabetes and an HbA1c ≤58 mmol/mol had no statistically significant different antibody levels as compared to people with type 1 diabetes and an HbA1c >58 mmol/mol (P = 0.249). In comparison to participants with type 2 diabetes, those with type 1 diabetes and an HbA1c ≤58 mmol/mol had significantly higher antibody levels (P = 0.034 for type 2 diabetes and HbA1c ≤58 mmol/mol and P = 0.003 for type 2 diabetes and HbA1c >58 mmol/mol, respectively). After adjusting for age and sex and correcting for multiple comparisons, a significant difference between the groups was no longer observed (Figure 2B). The results did not change after also adjusting for BMI and estimated glomerular filtration rate (eGFR; no significant difference between the glycaemic groups) (Figure 3).
FIGURE 3.
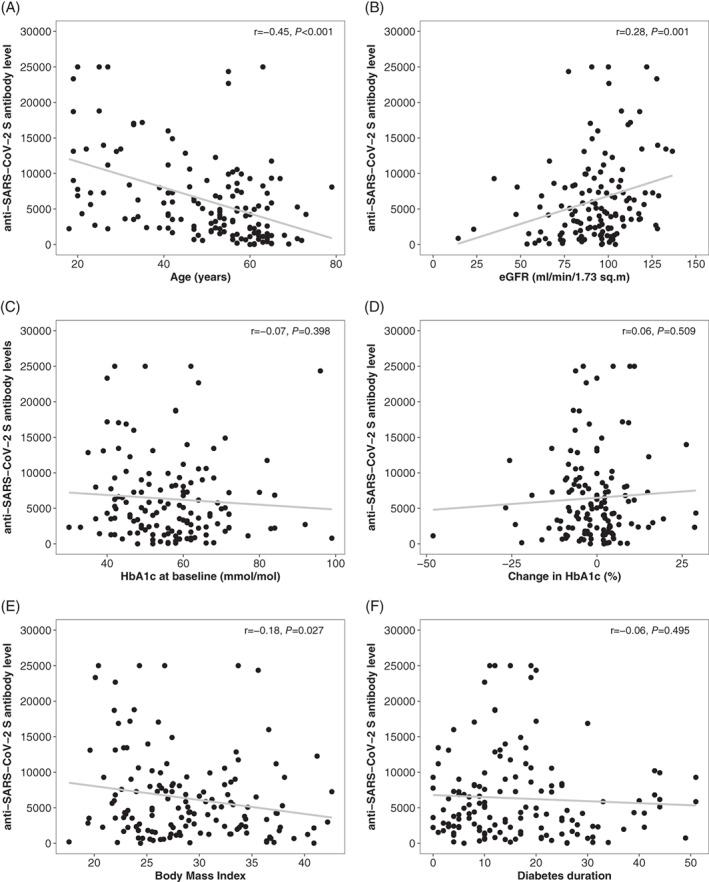
Correlation plots for selected clinical characteristics. eGFR, estimated glomerular filtration rate; HbA1c, glycated haemoglobin; r, Pearson's correlation coefficient. P values are for Pearson's correlation
We also performed a sensitivity analysis by using an HbA1c of 53 mmol/mol (7.0%) as the cut‐off for the glycaemic groups. In the age‐ and sex‐adjusted quantile regression analysis for the entire diabetes group (type 1 and type 2 diabetes together) the HbA1c category was not a predictor of anti‐SARS‐CoV2‐S antibody levels (P = 0.535). Likewise, when comparing the antibody levels of the newly formed four groups (type 1 diabetes with an HbA1c <53 mmol/mol and type 1 diabetes with an HbA1c ≥53 mmol/mol and type 2 diabetes with an HbA1c <53 mmol/mol and type 2 diabetes with an HbA1c ≥53 mmol/mol), no significant difference between the groups was observed when adjusted for age and sex (all P > 0.1). In people with type 2 diabetes, insulin treatment was not associated with the antibody response observed in adjusted quantile regression analysis (P = 0.165).
3.4. Clinical characteristics and antibody response
We pooled all participants with diabetes to perform correlation analyses, in which age was moderately to strongly correlated with anti‐SARS‐CoV‐2 S RBD antibody levels (r = −0.45, P < 0.001), an association that was more pronounced in participants with type 1 diabetes (−0.53, P < 0.001) than in those with type 2 diabetes (r = −0.20, P = .087). eGFR was also directly associated with levels of anti‐SARS‐CoV‐2 S RBD antibodies (r = 0.28, P = 0.001), while no correlation was observed with either HbA1c levels at baseline (r = −0.07, P = 0.398) or with changes of HbA1c levels between baseline and the follow‐up visit after the second vaccination (r = 0.06, P = 0.509) as a measure of change in glycaemic control between the vaccinations. BMI was weakly and inversely correlated with humoral immune response (r = −0.18, P = 0.027). Gender and diabetes duration had no impact on the antibody response.
If participants developed an elevated body temperature (>37.0°C) after the second vaccination, the antibody response appeared to be more pronounced (P = 0.036) as compared to in those without such an increase in body temperature (Figure S3).
4. DISCUSSION
This study demonstrated that people with type 1 and type 2 diabetes display a humoral immune response to COVID‐19 vaccination, measured according to SARS‐CoV‐2 S RBD antibodies, that is comparable to that of healthy controls. While unadjusted analyses suggested higher antibody levels in people with type 1 diabetes and an HbA1c ≤58 mmol/mol, no significant difference persists after adjustment for age, sex and correction for multiple comparisons. Our correlation analyses also suggest that age and eGFR are predictors for antibody levels after COVID‐19 vaccination, while HbA1c levels are not.
These study results are in contrast to a recently published observational study (CAVEAT study) that demonstrated a lower antibody response to COVID‐19 vaccination in people with type 2 diabetes having an HbA1c above 53 mmol/mol (7.0%). 18 Although we predefined a cut‐off of 58 mmol/mol (7.5%) for this analysis, the mean HbA1c levels observed in our cohort in the two groups are comparable to those in the CAVEAT study. When we analysed our data using an HbA1c cut‐off of 53 mmol/mol (7.0%) the results remained unchanged.
One explanation for the divergent results might be that the CAVEAT study used the GenScript SARS‐CoV‐2 surrogate virus neutralization test while in this study we used the Roche Elecsys anti‐SARS CoV‐2 S assay targeting the RBD. However, in direct comparison studies, both assays have demonstrated good correlation with each other, with an agreement rate of approximately 90%. 19
Our study suggests that age is a major determinant of humoral immune response to a COVID‐19 vaccination. This is in agreement with previous studies showing that elderly people not only exhibit a lower antibody response to different types of vaccines such as diphtheria, hepatitis A, hepatitis B, pneumococcal polysaccharide vaccine, tick‐borne encephalitis, tetanus or trivalent influenza vaccine, they also display a more rapid waning of antibodies. 20
In addition, the eGFR in our study was directly associated with the level of anti‐SARS‐CoV‐2 S antibodies. This is in line with previous data demonstrating that seroconversion rates after HBV vaccination decreases with lower kidney function from 95% in healthy subjects to 40% to 50% in people with CKD stages 3 to 4. 21
As in studies with hepatitis vaccines, 22 we were also able to show a significant inverse association of BMI with anti‐SARS‐CoV‐2 S RBD antibodies. However, in contrast to the hepatitis vaccination study, the correlation in our dataset was rather weak (r = −0.19, P = 0.027). Also, no correlation was found with diabetes duration in our study (r = −0.06, P = 0.495).
This study has some limitations. We aimed to recruit 40 participants into each subgroup of people with diabetes, a number which, despite large efforts, was not reached for those with type 1 diabetes and an HbA1c >58 mmol/mol. In addition, in this study we focused on the humoral immune response against the RBD of the spike protein only and did not further investigate the cellular immune response after the vaccination. However, previous studies have shown that neutralizing antibody levels are highly predictive of immune protection from symptomatic SARS‐CoV‐2 infections. 23 Although a number of studies have demonstrated that the widely used Roche Elecsys anti‐SARS‐CoV‐2 S immunoassay correlates with neutralizing anti‐SARS‐CoV‐2 antibody assays24, 25, 26, 27 we cannot completely exclude the possibility that results with other assays measuring directly neutralizing activity would differ in our cohorts.
As our study is still ongoing, with follow‐up visits planned before and after a potential 3rd vaccination and/or 12 months after the baseline visit, data on cellular immune response will be available at future visits.
Another limitation of our study is that 142 participants (94.6%) received an mRNA‐based vaccine. However, since we performed a real‐world cohort study within the setting of the national vaccination strategy of Austria and Germany, the observed distribution of vaccines represents the actual distribution in these countries in people with diabetes. Moving forward, in Austria only the mRNA‐based vaccine is available for the third vaccination. We would like to note the further limitation, that in the healthy control group, 96.5% received the Moderna vaccine, while 86% of the participants with diabetes received the BioNtech‐Pfizer and only 8.6% the Moderna vaccine. Previous studies in other cohorts showed that there appears to be a difference in the immune response between the two mRNA vaccines, with Moderna leading to higher antibody levels. 28 , 29 However, people in the healthy control group were not found to have higher anti‐SARS‐CoV2‐S antibody levels in our study, despite this potential bias.
The COVAC‐DM study demonstrated similar humoral immune response to COVID‐19 vaccination in people with type 1 and type 2 diabetes and healthy controls when results were adjusted for age, which, together with renal function, had a significant impact on antibody response in our study cohort. Additional information on cellular immune response and further follow‐up of participants in our and other clinical trials will help to clarify the full picture regarding vaccination effects and trajectories of antibody levels after COVID‐19 vaccination in people with diabetes and to provide more specific definitions of re‐vaccination intervals depending on patient characteristics.
CONFLICT OF INTEREST
None of the authors have conflicts of interest to declare.
AUTHOR CONTRIBUTIONS
Harald Sourij, Norbert J. Tripolt, Faisal Aziz, Ivo Steinmetz and Caren Sourij designed the study. Caren Sourij and Harald Sourij drafted the first version of the manuscript. Harald Kojzar, Peter N. Pferschy, Nadine Wachsmuth and Norbert J. Tripolt performed the data preparation. Faisal Aziz performed statistics and created the figures. Caren Sourij, Felix Aberer, Anna M. Obermayer, Harald Kojzar, Peter N. Pferschy, Farah Abbas, Julia K. Mader, Max L. Eckstein, Alexander Müller, Jacqueline Lenz, Gerhard Cvirn, Nandu Goswami, Michaela Steinberger, Lisa Knoll, Nazanin Sareban, performed the subject recruitment and were in charge of the conduction of study visits. Barbara Kleinhappl and Patrick Forstner performed antibody measurements. Ivo Steinmetz supervised antibody measurements. Barbara Prietl performed lab measurements. Robert Krause, Martin Stradner, Peter Schlenke supervised and designed the healthy control study. Data on healthy subjects was provided by Martin Stradner. Susanne Kaser acted as principal investigator of the participating study centre in Innsbruck. Othmar Moser was responsible for the performance of the study at the centre in Bayreuth. All authors have carefully revised the manuscript, agreed to the submission of the latest version and sufficiently contributed to this work. The samples/data used for this project have been provided by Biobank Graz of the Medical University of Graz, Austria.
All authors critically revised the manuscript.
PEER REVIEW
The peer review history for this article is available at https://publons.com/publon/10.1111/dom.14643.
Supporting information
Figure S1. Study participant flow chart
Figure S2. Correlation plot for age and anti‐SARS‐CoV‐2‐S antibody response after second vaccination separated for type 1 and type 2 diabetes
Figure S3. Anti‐SARS‐CoV‐2‐S antibodies in people with elevated body temperature (>37°C) compared to people with normal body temperature (after second vaccination)
ACKNOWLEDGMENTS
This research received no specific grant from any funding agency in the public, commercial or not‐for‐profit sectors. However, funding was applied for at the Austrian Science Fund. The authors would like to thank Marlies Leitner, Lejla Pesto, Harald Rupprecht, Beate Zunner, Sandra Haupt and Tamara Banfic for their support.
Sourij C, Tripolt NJ, Aziz F, et al. Humoral immune response to COVID‐19 vaccination in diabetes is age‐dependent but independent of type of diabetes and glycaemic control: The prospective COVAC‐DM cohort study. Diabetes Obes Metab. 2022;24(5):849‐858. doi: 10.1111/dom.14643
Caren Sourij, Norbert J. Tripolt and Faisal Aziz contributed equally and are joint first authors.
Ivo Steinmetz and Harald Sourij contributed equally and are joint last authors.
DATA AVAILABILITY STATEMENT
The data that support the findings of this study are available from the corresponding author upon reasonable request.
REFERENCES
- 1. Cucinotta D, Vanelli M. WHO declares COVID‐19 a pandemic. Acta Biomed. 2020;91(1):157‐160. [DOI] [PMC free article] [PubMed] [Google Scholar]
- 2. Guan WJ, Ni ZY, Hu Y, et al. Clinical characteristics of coronavirus disease 2019 in China. N Engl J Med. 2020;382(18):1708‐1720. [DOI] [PMC free article] [PubMed] [Google Scholar]
- 3. Zhou F, Yu T, Du R, et al. Clinical course and risk factors for mortality of adult inpatients with COVID‐19 in Wuhan, China: a retrospective cohort study. Lancet. 2020;395(10229):1054‐1062. [DOI] [PMC free article] [PubMed] [Google Scholar]
- 4. Grasselli G, Zangrillo A, Zanella A, et al. Baseline characteristics and outcomes of 1591 patients infected with SARS‐CoV‐2 admitted to ICUs of the Lombardy Region, Italy. JAMA. 2020;323(16):1574‐1581. [DOI] [PMC free article] [PubMed] [Google Scholar]
- 5. Richardson S, Hirsch JS, Narasimhan M, et al. Presenting characteristics, comorbidities, and outcomes among 5700 patients hospitalized with COVID‐19 in the New York City Area. JAMA. 2020;323(20):2052‐2059. [DOI] [PMC free article] [PubMed] [Google Scholar]
- 6. Wu Z, McGoogan JM. Characteristics of and important lessons from the coronavirus disease 2019 (COVID‐19) outbreak in China: summary of a report of 72314 cases from the Chinese Center for Disease Control and Prevention. JAMA. 2020;323(13):1239‐1242. [DOI] [PubMed] [Google Scholar]
- 7. Sourij H, Aziz F, Brauer A, et al. COVID‐19 fatality prediction in people with diabetes and prediabetes using a simple score upon hospital admission. Diabetes Obes Metab. 2021;23(2):589‐598. [DOI] [PMC free article] [PubMed] [Google Scholar]
- 8. Powers AC, Aronoff DM, Eckel RH. COVID‐19 vaccine prioritisation for type 1 and type 2 diabetes. Lancet Diabetes Endocrinol. 2021;9(3):140‐141. [DOI] [PMC free article] [PubMed] [Google Scholar]
- 9. Verstraeten T, Fletcher MA, Suaya JA, et al. Diabetes mellitus as a vaccine‐effect modifier: a review. Expert Rev Vaccines. 2020;19(5):445‐453. [DOI] [PubMed] [Google Scholar]
- 10. Polack FP, Thomas SJ, Kitchin N, et al. Safety and efficacy of the BNT162b2 mRNA Covid‐19 vaccine. N Engl J Med. 2020;383(27):2603‐2615. [DOI] [PMC free article] [PubMed] [Google Scholar]
- 11. Baden LR, El Sahly HM, Essink B, et al. Efficacy and safety of the mRNA‐1273 SARS‐CoV‐2 vaccine. N Engl J Med. 2021;384(5):403‐416. [DOI] [PMC free article] [PubMed] [Google Scholar]
- 12. Voysey M, Costa Clemens SA, Madhi SA, et al. Single‐dose administration and the influence of the timing of the booster dose on immunogenicity and efficacy of ChAdOx1 nCoV‐19 (AZD1222) vaccine: a pooled analysis of four randomised trials. Lancet. 2021;397(10277):881‐891. [DOI] [PMC free article] [PubMed] [Google Scholar]
- 13. Voysey M, Clemens SAC, Madhi SA, et al. Safety and efficacy of the ChAdOx1 nCoV‐19 vaccine (AZD1222) against SARS‐CoV‐2: an interim analysis of four randomised controlled trials in Brazil, South Africa, and the UK. Lancet. 2021;397(10269):99‐111. [DOI] [PMC free article] [PubMed] [Google Scholar]
- 14.FDA Briefing Document, Moderna COVID‐19 Vaccine, 2020. https://www.fda.gov/media/144434/download. Accessed November 23, 2021.
- 15. Lustig Y, Sapir E, Regev‐Yochay G, et al. BNT162b2 COVID‐19 vaccine and correlates of humoral immune responses and dynamics: a prospective, single‐centre, longitudinal cohort study in health‐care workers. Lancet Respir Med. 2021;9:999‐1009. [DOI] [PMC free article] [PubMed] [Google Scholar]
- 16. RDG . Correlation of the units (U) of the Elecsys® Anti‐SARS‐CoV‐2 S assay to the “binding antibody units” (BAU) of the first WHO International Standard for anti‐SARS‐CoV‐2 immunoglobulin; 2021. Penzberg, Germany.
- 17. WHO . First WHO International Standard for anti‐SARS‐CoV‐2 Immunoglobulin. https://cdn.who.int/media/docs/default‐source/biologicals/ecbs/bs‐2020‐2403‐sars‐cov‐2‐ab‐ik‐17‐nov‐2020_4ef4fdae‐e1ce‐4ba7‐b21a‐d725c68b152b.pdf?sfvrsn=662b46ae_8&download=true. Accessed October 9, 2021. [DOI] [PMC free article] [PubMed]
- 18. Marfella R, D'Onofrio N, Sardu C, et al. Does poor glycaemic control affect the immunogenicity of the COVID‐19 vaccination in patients with type 2 diabetes: the CAVEAT study. Diabetes Obes Metab. 2021;24(1):160‐165. [DOI] [PMC free article] [PubMed] [Google Scholar]
- 19. Yun S, Ryu JH, Jang JH, et al. Comparison of SARS‐CoV‐2 antibody responses and seroconversion in COVID‐19 patients using twelve commercial immunoassays. Ann Lab Med. 2021;41(6):577‐587. [DOI] [PMC free article] [PubMed] [Google Scholar]
- 20. Zimmermann P, Curtis N. Factors that influence the immune response to vaccination. Clin Microbiol Rev. 2019;32(2):e00084‐18. [DOI] [PMC free article] [PubMed] [Google Scholar]
- 21. Ma BM, Yap DYH, Yip TPS, Hung IFN, Tang SCW, Chan TM. Vaccination in patients with chronic kidney disease‐review of current recommendations and recent advances. Nephrology (Carlton). 2021;26(1):5‐11. [DOI] [PubMed] [Google Scholar]
- 22. Van der Wielen M, Van Damme P, Chlibek R, Smetana J, von Sonnenburg F. Hepatitis A/B vaccination of adults over 40 years old: comparison of three vaccine regimens and effect of influencing factors. Vaccine. 2006;24(26):5509‐5515. [DOI] [PubMed] [Google Scholar]
- 23. Khoury DS, Cromer D, Reynaldi A, et al. Neutralizing antibody levels are highly predictive of immune protection from symptomatic SARS‐CoV‐2 infection. Nat Med. 2021;27(7):1205‐1211. [DOI] [PubMed] [Google Scholar]
- 24. Patel EU, Bloch EM, Clarke W, et al. Comparative performance of five commercially available serologic assays to detect antibodies to SARS‐CoV‐2 and identify individuals with high neutralizing titers. J Clin Microbiol. 2021;59(2):e02257‐20. [DOI] [PMC free article] [PubMed] [Google Scholar]
- 25. Resman Rus K, Korva M, Knap N, Avšič Županc T, Poljak M. Performance of the rapid high‐throughput automated electrochemiluminescence immunoassay targeting total antibodies to the SARS‐CoV‐2 spike protein receptor binding domain in comparison to the neutralization assay. J Clin Virol. 2021;139:104820. [DOI] [PMC free article] [PubMed] [Google Scholar]
- 26. Rubio‐Acero R, Castelletti N, Fingerle V, et al. In search of the SARS‐CoV‐2 protection correlate: head‐to‐head comparison of two quantitative S1 assays in pre‐characterized oligo‐/asymptomatic patients. Infect Dis Ther. 2021;10(3):1505‐1518. [DOI] [PMC free article] [PubMed] [Google Scholar]
- 27. Mahmoud SA, Ganesan S, Naik S, et al. Serological assays for assessing Postvaccination SARS‐CoV‐2 antibody response. Microbiol Spectr. 2021;9(2):e0073321. [DOI] [PMC free article] [PubMed] [Google Scholar]
- 28. Montoya JG, Adams AE, Bonetti V, et al. Differences in IgG antibody responses following BNT162b2 and mRNA‐1273 SARS‐CoV‐2 vaccines. Microbiol Spectr. 2021;9:e0116221. [DOI] [PMC free article] [PubMed] [Google Scholar]
- 29. Puranik A, Lenehan PJ, Silvert E, et al. Comparison of two highly‐effective mRNA vaccines for COVID‐19 during periods of alpha and Delta variant prevalence. medRxiv 2021.
Associated Data
This section collects any data citations, data availability statements, or supplementary materials included in this article.
Supplementary Materials
Figure S1. Study participant flow chart
Figure S2. Correlation plot for age and anti‐SARS‐CoV‐2‐S antibody response after second vaccination separated for type 1 and type 2 diabetes
Figure S3. Anti‐SARS‐CoV‐2‐S antibodies in people with elevated body temperature (>37°C) compared to people with normal body temperature (after second vaccination)
Data Availability Statement
The data that support the findings of this study are available from the corresponding author upon reasonable request.