Significance
Systematic optimization of a pyrrolysyl–tRNA synthetase pair (tRNA: transfer ribonucleic acid) is shown to improve the incorporation of clickable amino acids into structured regions of proteins, in both bacterial and mammalian cells. The enhanced labeling of target proteins is demonstrated in fluorescence nanoscopy experiments of β-actin. MINFLUX measurements of filopodia at ∼2-nm three-dimensional precision contain segments with localization patterns that are consistent with a triangular filament bundling pattern, featuring interfilament separations close to 12 nm, that was previously only accessible via cryogenic imaging methods. This study highlights the potential of molecular-scale fluorescence nanoscopies when paired with minimally displacing labeling tags.
Keywords: nanoscopy, genetic code expansion, fluorescence, click chemistry, actin
Abstract
With few-nanometer resolution recently achieved by a new generation of fluorescence nanoscopes (MINFLUX and MINSTED), the size of the tags used to label proteins will increasingly limit the ability to dissect nanoscopic biological structures. Bioorthogonal (click) chemical groups are powerful tools for the specific detection of biomolecules. Through the introduction of an engineered aminoacyl–tRNA synthetase/tRNA pair (tRNA: transfer ribonucleic acid), genetic code expansion allows for the site-specific introduction of amino acids with “clickable” side chains into proteins of interest. Well-defined label positions and the subnanometer scale of the protein modification provide unique advantages over other labeling approaches for imaging at molecular-scale resolution. We report that, by pairing a new N-terminally optimized pyrrolysyl–tRNA synthetase (chPylRS2020) with a previously engineered orthogonal tRNA, clickable amino acids are incorporated with improved efficiency into bacteria and into mammalian cells. The resulting enhanced genetic code expansion machinery was used to label β-actin in U2OS cell filopodia for MINFLUX imaging with minimal separation of fluorophores from the protein backbone. Selected data were found to be consistent with previously reported high-resolution information from cryoelectron tomography about the cross-sectional filament bundling architecture. Our study underscores the need for further improvements to the degree of labeling with minimal-offset methods in order to fully exploit molecular-scale optical three-dimensional resolution.
Fluorescence imaging techniques have become indispensable tools for exploring the in situ spatial organizations and compositions of cellular structures. As resolution has improved, increasingly intricate biological observations have become possible (1). A major leap was made when superresolution fluorescence microscopes began to discern molecules spaced much closer than the ∼200-nm resolution limit imposed by diffraction of light (2–5). Routinely realizing 20- to 40-nm resolution, fluorescence nanoscopy methods like STED, PALM and STORM have allowed for the characterization of many cellular assemblies (6–8). Recently, major new advancements were reported with MINFLUX (9) and MINSTED (10), nanoscopy approaches that combine principles from coordinate-targeted approaches like STED with those from coordinate-stochastic single-molecule-based methods, like PALM/STORM. Outperforming established superresolution methods by 10-fold, MINFLUX localizes fluorophores with three-dimensional (3D) precisions <3 nm (SD) in biological samples, i.e., at length scales equal to or smaller than the size of commonly used labeling tags (11–13).
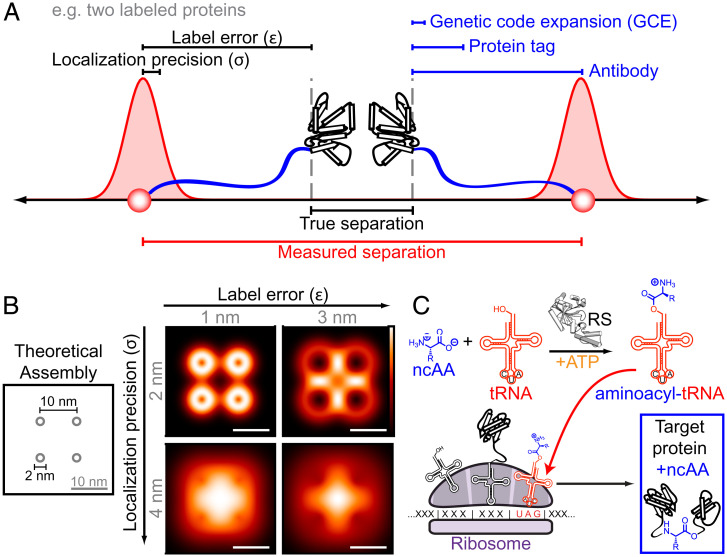
Antibodies, fluorescent proteins, and self-labeling (enzymatic) protein tags, such as SNAP-tag, Halo-tag, and CLIP-tag (14–16), have been used to specifically label proteins with fluorophores for a variety of superresolution methods. However, each of these labeling approaches introduces an offset between the target biomolecule and the fluorescent label, limiting the accuracy with which the imaging measurement represents the biological structure in question. Furthermore, given that biological assemblies have multiple molecules, labeling errors (ε) will often manifest in opposing directions, doubling the effect of the tag offset on the measurement (Fig. 1A). To measure small structures with minimal artifacts, both high localization precisions and low labeling errors are needed (Fig. 1B).
Fig. 1.
Concepts behind pairing MINFLUX with genetic code expansion. (A) Offsets between the fluorescent labels and target biomolecules can compromise the accuracy with which a measurement reflects the underlying structure, particularly given the molecular-scale localization precisions achieved by MINFLUX. (B) Simulated molecular assembly illustrating how different combinations of precision and label error can produce different measured patterns. (Scale bar: 10 nm.) (C) In genetic code expansion, an engineered tRNA and RS are introduced. The RS will specifically conjugate a ncAA to the new tRNA, which has an anticodon that corresponds to a stop codon, typically amber (5′-UAG-3′). If a single mutation is introduced to the protein of interest that exchanges a sense codon for the amber codon, the ribosome will insert the ncAA from the aminoacyl-tRNA into the protein at that site.
For each antibody used, fluorophores are offset from the target protein by an average of ∼10 nm. Furthermore, the flexibility of the antibodies can lead to inconsistent labeling errors between molecules within the same structure (17). Protein tags introduce around 3 nm of separation from the N or C terminus of the tagged protein. These terminal regions are themselves unstructured and flexible in many proteins (18, 19), introducing additional uncertainty and often separation from structured regions. The magnitudes of such systemic inaccuracies are large enough to limit the biological information extracted from the (sub)nanometer localization precision provided by MINFLUX. In fact, fluorophore-to-target separations have been shown to impact measurements obtained with established superresolution methods as well (20–22). Furthermore, the bulk from large tags on protein termini can modify or disrupt protein function and dynamics (23–26). To fully maximize the information extracted from MINFLUX measurements, a labeling approach should be used that introduces minimally disruptive protein labels that are subnanometer in size and that can be specifically introduced into structured regions of proteins.
Genetic code expansion (GCE) is a promising method that meets these requirements. In GCE, an amino acid with a unique nonnatural side chain, a noncanonical amino acid (ncAA), is site-specifically incorporated into the sequence of a protein of interest (27). These modified side chains are typically equally as long as (or only a few atoms longer than) those of the amino acids naturally found in proteins (28). For site-specific protein labeling, ncAAs have been developed, which feature special chemical groups that can react bioorthogonally, i.e., these moieties will specifically react with their partners without labeling the chemical groups that are naturally found in biological molecules. To genetically incorporate clickable amino acids into proteins in living cells, an engineered tRNA (transfer ribonucleic acid) and aminoacyl–tRNA synthetase (RS) must be introduced to cells, allowing for introduction of the ncAA at a nonsense (stop) mutation substituted into the target molecule’s sequence (Fig. 1C).
ncAAs for the major click reactions (29–32) have been genetically incorporated through engineered machinery from Methanosarcina barkeri and Methanosarcina mazei (Mb and Mm, respectively), the organisms of which naturally use an additional amino acid called pyrrolysine (Pyl). Such tRNA/RS pairs have been used to introduce clickable ncAAs into a variety of targets and organisms, even allowing for superresolution imaging in some cases (33–35).
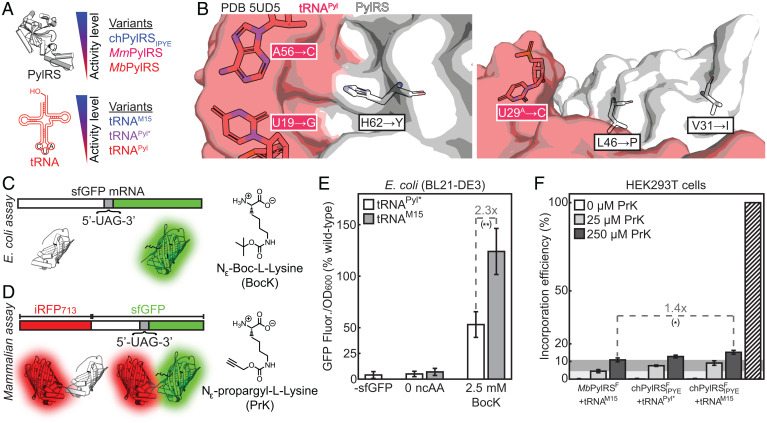
To achieve high signal-to-background ratio in fluorescence microscopy, it is desirable to use a tRNA/RS pair that incorporates clickable amino acids as efficiently as possible (33, 36). Mutations in the tRNA and the RS have been shown to improve the efficiencies of pyrrolysyl GCE pairs both in bacteria and in mammalian cells (Fig. 2A).
Fig. 2.
The orthogonal tRNAM15 is compatible with the highly efficient chPylRSIPYE enzyme, substantially improving incorporation efficiency in E. coli, compared to the previously used tRNAPyl*. Bars in plots represent the mean of three biological replicates and error bars show SD between biological replicates. *P < 0.05, **P < 0.01 (see SI Appendix, section S14 for exact P values). (A) Several variants of Methanosarcina PylRS enzymes and of orthogonal tRNAs have been used for genetic code expansion, but the highly efficient chPylRSIPYE enzyme has not been paired with a recently reported enhanced orthogonal tRNA (tRNAM15). (B) Analysis of a published crystal structure shows that the resolved residues mutated in chPylRSIPYE do not interact with any nucleobases modified in tRNAM15. Residue 100 (A→E) was not included in the structure. (C) Fluorescent-reporter assay for determining relative amber suppression efficiency in E. coli. Bacteria are transformed with a plasmid encoding superfolder-GFP with a stop codon N-terminal to the chromophore. Efficient orthogonal pairs produce larger amounts of aminoacylated-tRNA, resulting in high levels of amber stop-codon readthrough and expression of full-length fluorescent superfolder-GFP. On the other hand, less efficient orthogonal pairs will produce more truncated-sfGFP and less sfGFP fluorescence. (D) Fluorescent-reporter assay for mammalian cell amber suppression efficiency, where increased incorporation results in more sfGFP fluorescence while iRFP713 serves as a transfection control. (E) The chPylRSIPYE/tRNAM15 pair incorporates BocK more than twice as efficiently as the reported chPylRSIPYE/tRNAPyl* pair in E. coli. (F) In HEK293T cells, the chPylRSFIPYE/tRNAM15 pair incorporates PrK 1.4 times more efficiently than the previously reported MbPylRSF/tRNAM15 pair, and only slightly more efficiently than chPylRSIPYE/tRNAPyl*. Light and dark gray horizontal regions demonstrate mean incorporation efficiency for MbPylRSF/tRNAM15 with 25 and 250 μM PrK, respectively. The striped bar illustrates theoretically perfect (100%) incorporation efficiency.
By combining a recently reported tRNA with a reengineered pyrrolysyl synthetase featuring a set of mutations in the N-terminal domain, we arrived at a pair that improved the incorporation of clickable amino acids by severalfold in both mammalian and bacterial cells. The pair provides substantially higher fluorescence imaging signal when compared to existing GCE pairs. This GCE machinery was used for superresolution imaging of the actin cytoskeleton, resolving details about the 3D assembly of actin filaments in filopodia with MINFLUX nanoscopy.
Results
Testing a Previously Optimized RS with an Engineered tRNA.
The pyrrolysyl-tRNA/RS system was chosen due to established compatibility with major click chemistry groups and due to the unique two-domain structure of PylRS. The C-terminal domain of the enzyme contains the amino acid binding pocket while the N-terminal domain is responsible for facilitating binding to the tRNA. Thus, mutations can be made in the N-terminal domain to optimize the tRNA/RS interaction without affecting the shape of the amino acid binding pocket, preserving the enzyme’s specificity for ncAAs.
A particularly efficient RS with N-terminal mutations emerged from continuous evolution of a chimeric RS. Four mutations were identified and this enzyme, chPylRSIPYE, outperformed both MbPylRS and MmPylRS in Escherichia coli and recently also in mammalian cells (37–39). Additionally, the orthogonal tRNA has been enhanced by increasing its stability and expression levels (tRNAPyl*) (40) and then further by adjusting regions known to bind elongation factors (tRNAM15) (41).
To date, chPylRSIPYE and tRNAM15 have not been paired in either bacterial or mammalian cells, and it is unclear whether the modifications to the tRNA and to the RS would be compatible with one another. To begin answering this question, we evaluated a published structure (42) of the MmPylRS N-terminal domain complexed with tRNAPyl*. No substantial structural relationships were seen between the regions mutated in chPylRSIPYE and tRNAM15, opening the possibility that the improved RS and tRNA can function together (Fig. 2B). Therefore, we tested the compatibility and efficiency of this pair in E. coli. chPylRSIPYE was cloned into the pULTRA expression vector (40) along with either tRNAPyl* or tRNAM15. This GCE plasmid was cotransformed in E. coli (BL21-DE3) together with a published pBAD-sfGFPN149* reporter plasmid encoding sfGFP with an amber nonsense mutation at the 149th codon (43). Since this region is upstream of the chromophore, successful GCE results in readthrough of a fluorescent product, while unsuccessful incorporation leads to the expression of a nonfluorescent truncation product (Fig. 2C). When paired with tRNAM15, chPylRSIPYE incorporates a standard Boc-lysine test-ncAA an average of 2.3 times more efficiently than when paired with the standard tRNAPyl*, as judged by expressed full-length sfGFP fluorescence normalized by OD600 (Fig. 2E). Encouraged by this result, we tested the performance of the chPylRSIPYE/tRNAM15 pair in mammalian cells. After adding a previously described activity-enhancing active site Tyr→Phe mutation, we compared the incorporation efficiency of the resulting chPylRSFIPYE/tRNAM15 pair in mammalian cells with that of the highly active MbPylRSF/tRNAM15 pair (41, 44). Using a previously described iRFP713-sfGFP reporter system (Fig. 2D) in HEK293T cells, we found a 1.4 fold improvement in the incorporation of a clickable amino acid with the pair featuring chPylRSFIPYE as compared to the previously reported MbPylRSF/tRNAM15 pair (Fig. 2F) (34).
Developing the chPylRS2020 Enzymes.
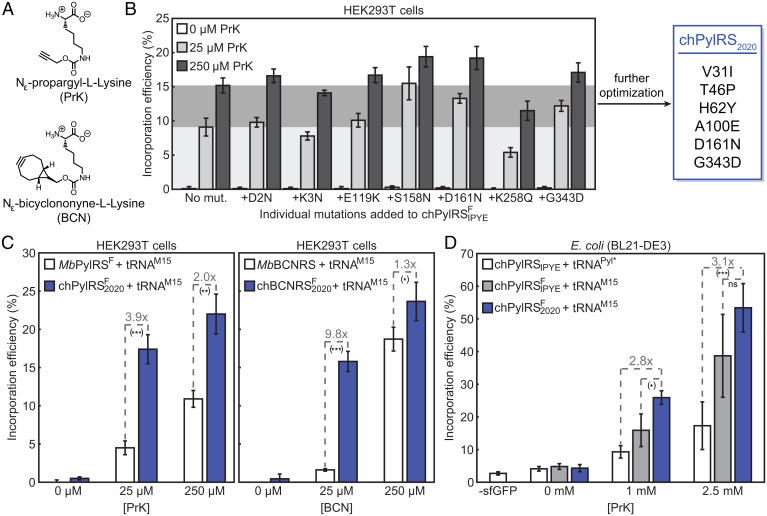
Unsatisfied with the modest improvement in mammalian cells, we aimed to generate a synthetase that performs better than chPylRSFIPYE. Avoiding modification of the binding pocket, so as to prevent disruption of click-ncAA binding, we sought to introduce additional N-terminal mutations. Given previous studies concerning the function of the N-terminal domain, these mutations would be expected to improve the enzyme’s binding to and positioning of the tRNA, without affecting ncAA binding. A study parallel to that which originally identified chPylRSIPYE reported several additional productive N-terminal mutations (42). These mutations were never tested together with the IPYE mutations, and so we examined the effect of each point mutant on the activity of the chPylRSFIPYE enzyme. Several of these modifications were found to substantially improve the incorporation efficiency of a clickable amino acid, Nε-propargyl-L-lysine (PrK, Fig. 3 A and B). Subsequently, all pairs of the top-three most beneficial mutations were screened, as well as the full set of the three and the originally reported combinations. In this way, an optimized enzyme, chPylRSF2020, was identified (Fig. 3B and SI Appendix, Fig. S4.1). This synthetase incorporated PrK twice as efficiently as the previously reported MbPylRSF at high amino acid concentrations and almost four times as efficiently at low levels of amino acid (Fig. 3C). Encouraged by these results, we decided to examine whether the “2020” mutations could improve the incorporation of clickable amino acids for other types of bioorthogonal chemistry, specifically the inverse electron-demand Diels–Alder reaction (iEDDA). To test this hypothesis, the binding pocket mutations from a previously reported M. barkeri enzyme that incorporates Nε-bicyclononyne-L-lysine (BCN) (Fig. 3A) were added into chPylRS2020 (30). The resulting chBCNRS2020 enzyme provided a major improvement over the previously published MbBCNRS, incorporating BCN nearly tenfold more efficiently at a low concentration of BCN (Fig. 3C). Interestingly, although incorporation efficiency increased at 250 μM BCN, total protein expression decreased, suggesting interference with protein synthesis at higher concentrations (SI Appendix, Fig. S4.3). Notably, the 2020 mutations did not confer substantial improvements in incorporation efficiencies of two other iEDDA amino acids (Nε-trans-cyclooct-2-en-L-lysine, Nε-cyclopropene-L-lysine) at the 25- and 250-μM concentrations. However, with these amino acids there was not a substantial difference in incorporation efficiency between conditions with high and low amino acid concentrations, even when using the M. barkeri enzyme. This suggests that enzyme kinetics is already saturated for these amino acids at these concentrations (SI Appendix, Fig. S4.2). Nevertheless, given that the 2020 mutations enhanced incorporation efficiency in enzymes with two different binding pockets in mammalian cells, it is possible that this mutation set may be transferrable to other reported PylRS enzymes.
Fig. 3.
A newly reported set of synthetases, chPylRSF2020 and chBCNRS2020, improve incorporation efficiency of clickable amino acids in bacterial and mammalian cells. Bars in plots represent the mean of three biological replicates and error bars show SD between biological replicates. nsP > 0.05, *P < 0.05, **P < 0.01, ***P < 0.001 (see SI Appendix, Fig. S14 for exact P values). (A) Chemical structures of the clickable amino acids studied in this section. (B) Point mutations identified in a previous publication were introduced into chPylRSFIPYE and the incorporation efficiency of the mutant enzymes with tRNAM15 was analyzed in cultured HEK293T cells. Beneficial mutations were combinatorically analyzed and the best-performing enzyme, chPylRSF2020, included two mutations in addition to IPYE and Y349F. Light and dark gray horizontal regions demonstrate mean incorporation efficiency for chPylRSFIPYE/tRNAM15 with 25 and 250 μM PrK, respectively. (C) chPylRS2020/tRNAM15 orthogonal pairs incorporate both PrK and BCN several times more effectively than the previously reported MbPylRS/tRNAM15 system in HEK293T cells. (D) The chPylRSF2020/tRNAM15 orthogonal pair outperforms chPylRSFIPYE/tRNAM15 at incorporating PrK in E. coli and substantially improves protein expression levels as compared to the published chPylRSIPYE/tRNAPyl* pair.
To see whether the 2020 mutations also enhance incorporation efficiency in bacteria, chPylRSF2020 was inserted into the pULTRA vector encoding tRNAM15. The enzyme incorporated PrK more efficiently than chPylRSFIPYE at 1 mM PrK. Furthermore, powered largely by the effects of tRNAM15, the chPylRSF2020/tRNAM15 pair incorporates PrK 3.1 times more efficiently than the published chPylRSIPYE/tRNAPyl* pair (Fig. 3D).
Fluorescence Microscopy with chPylRSF2020 and chBCNRS2020 + tRNAM15 Orthogonal Pairs.
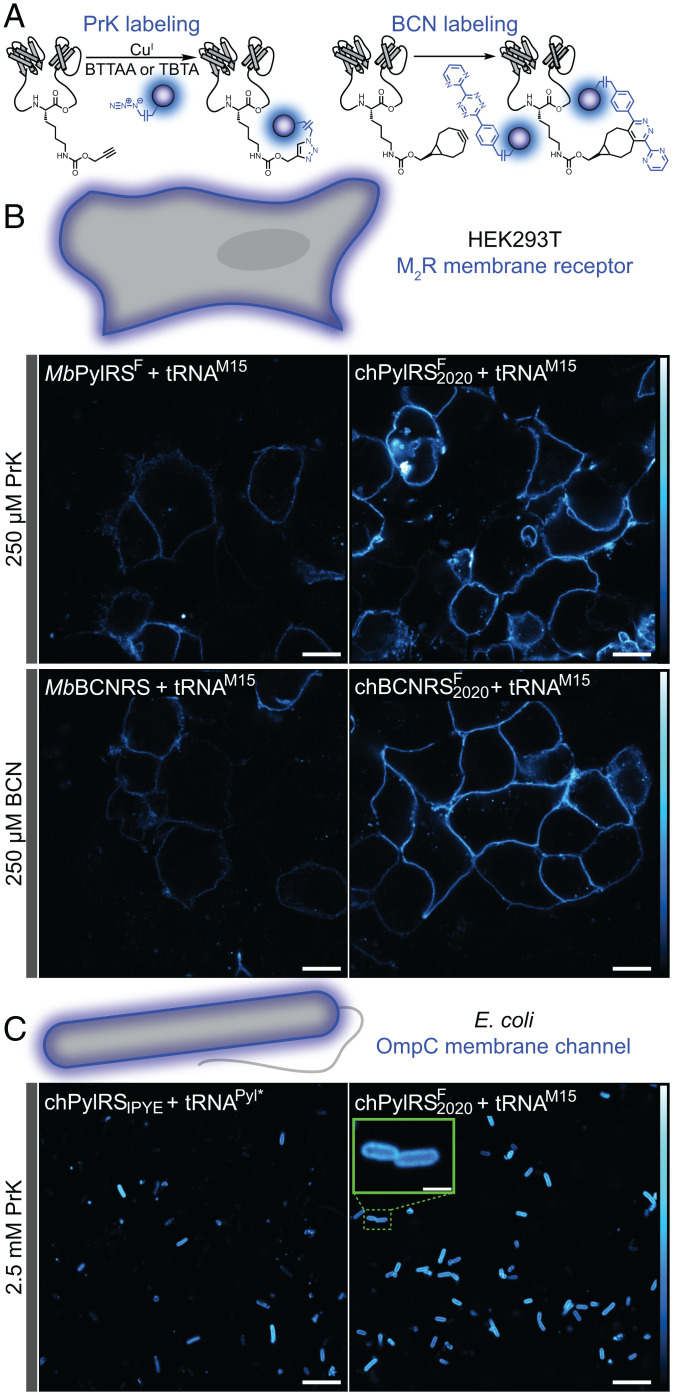
Motivated by the strongly enhanced incorporation of PrK and BCN via the chPylRSF2020 and chBCNRS2020 enzymes, we sought to test whether this improvement could increase fluorescence signal in imaging experiments. To answer this question, we incorporated PrK and BCN via chPylRSF2020 into a muscarinic G protein-coupled receptor (GPCR), M2RV186*, a construct which has been previously labeled using GCE (24). This GPCR was expressed in HEK293T cells together with a GCE orthogonal pair and was labeled under live-cell conditions with the switchable fluorophore Alexa Fluor-647, either via chelation-assisted copper-catalyzed azide-alkyne cycloaddition (CuAAC) or iEDDA (Fig. 4A). Cells were imaged after fixation. Brighter GPCR labeling was seen for both PrK and BCN incorporation with chPylRSF2020 and chBCNRS2020 as compared to MbPylRSF and MbBCNRS, respectively (Fig. 4B and SI Appendix, Figs. S5.1–S5.4).
Fig. 4.
Incorporation and labeling of clickable ncAAs in mammalian and bacterial membrane proteins. (A) PrK-tagged proteins were labeled with chelation-assisted copper-catalyzed azide/alkyne click chemistry using the azide-plus variant of Alexa Fluor-647. BCN-tagged proteins were labeled by inverse electron-demand Diels–Alder chemistry and a tetrazine variant of Alexa Fluor-647. (B) With tRNAM15, chPylRSF2020 greatly enhanced staining of M2R GPCRs as compared to MbPylRSF when PrK was incorporated at position 186 in the protein. In addition, chBCNRS2020 substantially improves the level of labeled M2RBCN186 as compared to MbBCNRS. (C) The new chPylRSF2020 + tRNAM15 pair significantly improves the level of labeled OmpCPrK311 as compared to the existing chPylRSIPYE + tRNAPyl* pair. (Scale bars [Inset]: 2 μm. All other scale bars: 10 μm.)
Asking whether the chPylRSF2020/tRNAM15 orthogonal pair would also improve fluorescence signal for labeled bacterial proteins, a similar experiment was performed in E. coli. A previously reported osmoporin C construct for GCE (OmpCD311*) was expressed in BL21-DE3 E. coli with several orthogonal pairs (45). As in mammalian cells, the chPylRSF2020/tRNAM15 pair presented an enhancement over the previously reported pair, chPylRSIPYE/tRNAPyl* (Fig. 4C and SI Appendix, Figs. S6.1 and S6.2).
Three-Dimensional MINFLUX Fluorescence Imaging of β-Actin in Filopodia Labeled with chPylRS2020/tRNAM15.
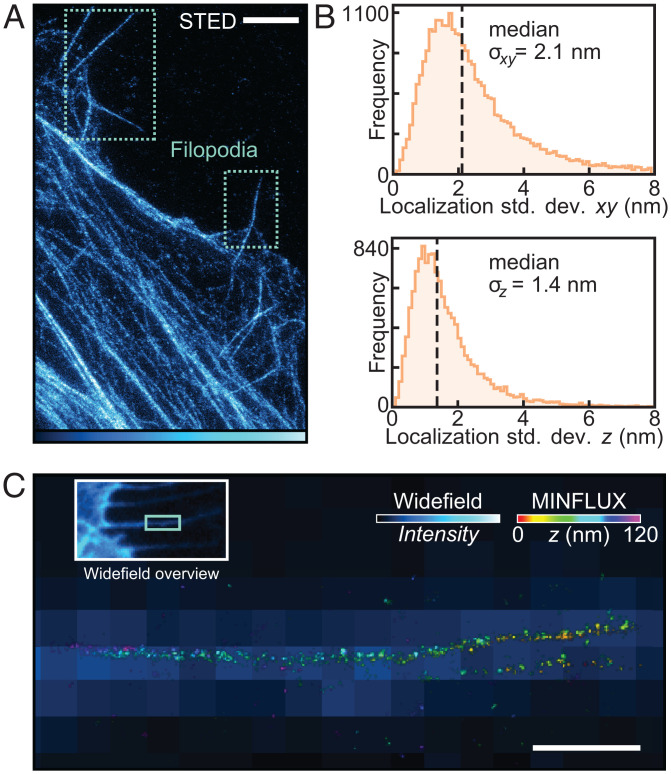
Encouraged by the improved labeling efficiencies, we sought to apply our GCE pair for fluorescence imaging at the highest precisions using 3D MINFLUX nanoscopy. Since we aimed to explore whether GCE can be used to tag proteins with minimal label-related changes, we sought to study a tightly packed structure, which may be influenced by bulky tags, such as fluorescent proteins (46). Therefore, we chose to label β-actin, focusing on filopodia, narrow plasma-membrane projections of cells that are formed from β-actin filaments and that have previously been studied by electron tomographic approaches (Fig. 5A) (47).
Fig. 5.
Superresolution imaging of U2OS filopodia labeled by genetic code expansion. (A) STED image of β-actinPrK118 labeled with picolyl-azide silicon rhodamine in U2OS cells, highlighting filopodia. (Scale bar: 2 μm.) (B) Distributions for the estimated precision of Alexa Fluor-647 localizations from 14 separate MINFLUX measurements of filopodia. (C) Overlay of a widefield and corresponding MINFLUX image depicting a representative filopodium that protrudes straight out of the cell. MINFLUX localizations were processed and then rendered by the program Imaris as described in SI Appendix, section 1. (Scale bar: 500 nm.)
A previously reported β-actinK118* construct was cotransfected with orthogonal pairs featuring the 2020 mutations in U2OS cells (33). Incorporation of PrK, BCN, and two other clickable amino acids was tested. To obtain biological relevance, high label density and low background fluorescence are mandatory. To minimize background, nonfilamentous β-actin monomer was removed via a previously reported cofixation/extraction protocol with glutaraldehyde and Triton X-100 prior to fixation with glutaraldehyde (48). Cells with PrK incorporated into β-actin showed lower background and cleaner protein labeling (higher-contrast images) than those with other ncAAs (SI Appendix, Fig. S7.1). Furthermore, PrK is the smallest of these ncAAs (∼0.7 nm, SI Appendix, section 10), so the chPylRSF2020/tRNAM15 pair with PrK was used moving forward.
To investigate whether the degree of labeling might be high enough, we labeled β-actinPrK118 with the nonswitchable fluorophore picolyl-azide silicon rhodamine and then recorded the samples using STED nanoscopy. Labeling with PrK via our orthogonal synthetase allowed us to routinely obtain STED images, suggesting a substantial labeled fraction of the β-actin (Fig. 5A).
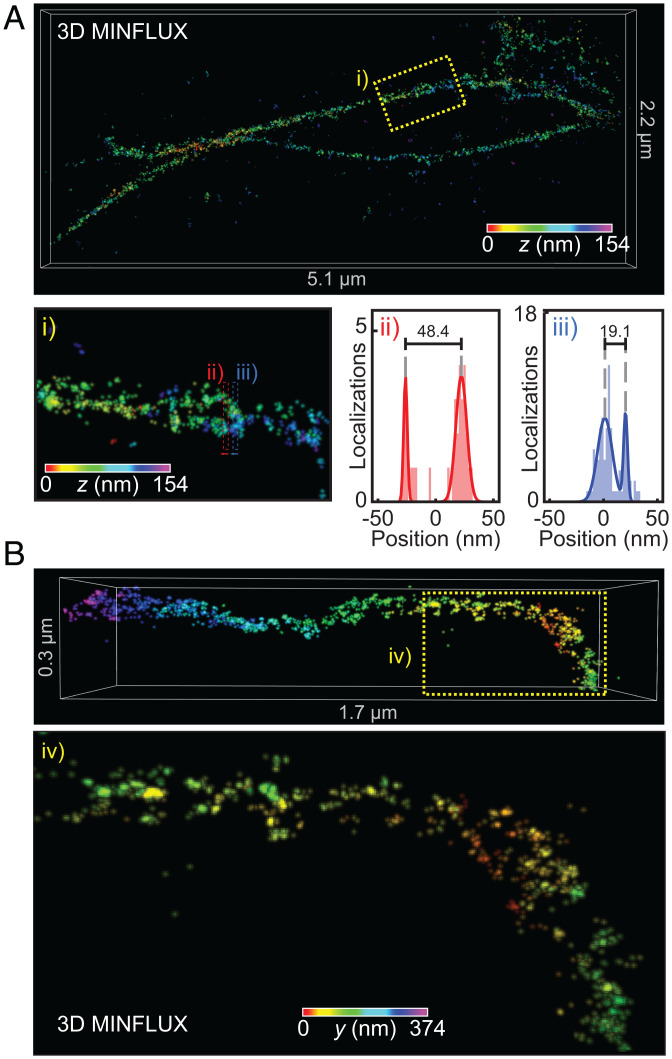
We therefore moved on to image β-actinPrK118 using 3D MINFLUX nanoscopy, labeling PrK with a rapidly reacting azide-plus variant of the switchable Alexa Fluor-647 fluorescent dye (AF647Az+). Actin filopodia were measured in 3D with spatial precisions (σ) between 1 and 2.5 nm in all directions (Fig. 5B) and, after drift correction (SI Appendix, Fig. S11.1), were rendered in 3D (Fig. 5C). Most measured filopodia were found to be straight projections, with diameters of ∼40 nm. One measurement featured filopodia crossing over one another (Fig. 6A). Although still suboptimally labeled, some substructure could be discerned. Toward the base of the assembly, a region can be identified wherein two actin bundles can be resolved as being separated by ∼20 to 50 nm at different points, possibly also twisting around each other (Fig. 6 A, i–iii). A measurement of a kinked filopodium similarly showed actin bundles, which appear to twist around one another (Fig. 6B). Filopodia have been shown to kink and twist in response to frictional forces (49–51), so it is possible that internal actin bundles must also coil to allow for such deformations, as has been suggested (51).
Fig. 6.
Inspection of U2OS filopodia measured by MINFLUX nanoscopy. (A) MINFLUX image showing crossing filopodia. (i) Expanded view of the same region labeled at the Top. Substructure can be seen with actin bundles crossing around each other. (ii/iii) Cross-sectional localization histograms from the corresponding regions shown in i, demonstrating measured separations as close as ∼20 nm and up to ∼50 nm between the two bundles. (B) MINFLUX measurement of a kinked filopodium. (iv) Expanded view of the region boxed in yellow, depicting actin bundles that appear to wrap around each other.
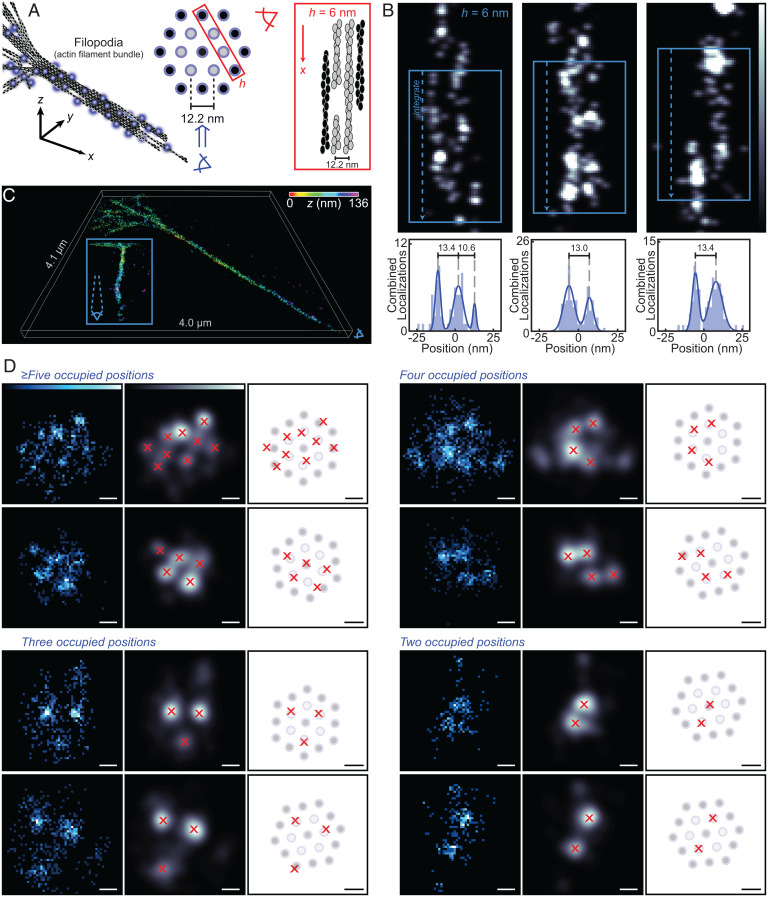
We examined the extent to which information about the packing of individual filaments within the filopodia could be extracted at the presently achieved labeling degree. Cryoelectron tomographs of filopodia have shown that, in straight segments, single filaments are separated by ∼12 nm and are mostly parallel, arranged on a triangular lattice (Fig. 7A) (47). Given that the combination of the ncAA side chain with the linker on the fluorophore adds only an ∼1.25-nm displacement from the protein backbone (SI Appendix, Fig. S10.1), and given the ∼2-nm localization precision of the MINFLUX measurements, such a pattern is right on the limits of what might be visible in the data, particularly given mechanical drift (SI Appendix, Fig. S9.1). To begin exploring this possibility, we sliced the measurement data into overlapping 6-nm-thick slices in z and selected regions where adjacent actin filaments could be discerned. Several regions with two to three adjacent filaments were identified that featured spacings close to 12 nm (Fig. 7B and SI Appendix, Fig. S12.1).
Fig. 7.
Cross-sectional analysis of filopodia measured by 3D MINFLUX nanoscopy. (A) Within filopodia, actin filaments are expected to be arranged on a triangular lattice with 12.2 ± 0.9(σ) nm spacing between nearest neighbors. (B) Blue box widths = 60 nm. Two-dimensional intensity projections of adjacent actin filaments within filopodia, discerned in 6-nm-thick slices of the 3D localizations. Histograms calculated from drift-corrected localization data. Images shown are processed via Gaussian blurs in yz and xy (σ = 1.5 nm). (C) 3D MINFLUX rendering of a filopodium color coded in z. The Inset shows the same dataset from an alternate angle, demonstrating the existence of bending along the length of filopodia. (D) After modeling the central axis of filopodia (SI Appendix, section 13), the actin filament bundling pattern can be resolved in multiple 200-nm projections of 3D MINFLUX data along the filopodia axis. Many projections correspond well with the lattice on which the filaments should be positioned. Representative images featuring different lattice occupancies are shown (Left: intensity image from localization data; Center: Gaussian blur [σ = 3.5 nm]; and Right: overlay of peaks on theoretical lattice). (Scale bars: 12 nm.)
Seeking to extend the analysis into the z direction, we asked whether molecular distributions consistent with the triangular-lattice pattern might be appreciable. Although the incomplete labeling would likely prevent cross-sectional visualization of the full bundle of actin filaments, thinner regions along the length of the filopodium might be identified. Given that some amount of curvature does exist in the measured filopodia (Fig. 7C, Inset), their central axis was modeled (SI Appendix, Fig. S13.1) and 200-nm-thick cross-sectional slices were analyzed. In several regions across multiple measurements, patterns consistent with the putative packing distribution could be discerned (Fig. 7D and SI Appendix, Fig. S13.2). These results suggest that the subnanometer modification introduced by the PrK amino acid indeed preserves the delicate bundling structure of actin filaments in filopodia.
Discussion
Given the single-nanometer localization precisions achieved by MINFLUX and related molecular-scale fluorescence nanoscopy techniques, we optimized a labeling system that introduces fluorophore-to-target offsets at or below those length scales. Systematic optimization of a PylRS/tRNA pair allowed us to develop an enzyme, chPylRSF2020, which improves the incorporation of clickable amino acids in both mammalian cells and E. coli. Paired with tRNAM15, this enzyme enhanced labeling for fluorescent imaging of target proteins and allowed for robust STED and MINFLUX imaging of β-actin. Subsequent analysis of 3D MINFLUX filopodia measurements identified localization patterns that can be rationalized to originate from an underlying triangular filament bundling pattern, with an average nearest-neighbor distance of around 12 nm. Although the fluorophore labeling degree was not sufficient to independently prove the bundling geometry, visualization of localization patterns consistent with structural elements that were previously only accessible via cryogenic imaging methods highlights the potential of molecular-scale fluorescence imaging when paired with minimally displacing labeling tags.
Despite this, the density of localized molecules can be advanced, and further evolution of the MINFLUX acquisition sequence should additionally improve the proportion of active labels that are detected. The labeling itself must also still be substantially improved, enhancing signal and reducing background. Incorporation efficiency might be further increased by introducing even more tRNA copies or by also expressing a previously reported engineered eukaryotic release factor (52). In our experiments, protein-of-interest plasmid with the UAG stop codon was transiently transfected into cells alongside the GCE plasmid. In β-actin labeling, the tagged protein must compete with the cell’s endogenous wild-type actin for incorporation into filaments, so knockdown of endogenous protein (e.g., via siRNA) is likely to enhance label density. With the newly optimized GCE pair reported in this study, it should even be possible to stably replace an essential endogenous protein such as actin with the tagged version via stable CRISPR-based genetic code modification.
Due to the presence of background staining in GCE-labeled samples, high-quality superresolution imaging has been practically limited to dense structures (such as the cytoskeleton) and membrane proteins. Some of this background has previously been shown to originate from labeling of aminoacylated-tRNAs (33, 34, 36) and from the suppression of endogenous mRNA amber codons in the cells (SI Appendix, Fig. S7.1) (33, 34, 36). Spatial sequestration of GCE machinery into designer membraneless organelles has enabled amber suppression of selected mRNAs, removing ncAA incorporation into endogenous proteins (53). Furthermore, recent demonstration of membraneless organelle formation within ∼100-nm zones of selected cell membranes shows that GCE machinery can be spatially positioned at known regions within cells (54). In this way, directing ncAA incorporation machinery exclusively for proteins of interest at specified positions in space away from imaging targets, or developing a method to eliminate signal from labeled tRNAs, might enable nanometer-scale fluorescence imaging of low-abundance protein targets in the cytosol and other compartments.
Despite these present limitations, our results show that the pairing of GCE and MINFLUX holds considerable promise as a powerful method for the imaging of small and sensitive biological structures at the molecular scale.
Materials and Methods
A detailed description of the materials and experimental methods, including sample preparation procedures, measurements of relative noncanonical amino acid incorporation efficiencies, mutation analysis and generation of chPylRS variants, and the MINFLUX data acquisition and analysis are provided in SI Appendix, SI Materials and Methods.
Supplementary Material
Acknowledgments
T.S.M. was the recipient of a 2019–2020 Fulbright Scholarship. We are grateful to Dr. Alexey Butkevich (Max Planck Institute for Medical Research, Heidelberg) for providing the picolyl-azide silicon rhodamine dye.
Footnotes
Reviewers: E.L., Johannes Gutenberg University of Mainz; D.S., Yale University.
Competing interest statement: The Max Planck Society holds patents on selected embodiments and procedures of MINFLUX, benefitting S.W.H.
This article contains supporting information online at https://www.pnas.org/lookup/suppl/doi:10.1073/pnas.2201861119/-/DCSupplemental.
Data Availability
All study data are included in the article and/or SI Appendix.
References
- 1.Sahl S. J., Hell S. W., Jakobs S., Fluorescence nanoscopy in cell biology. Nat. Rev. Mol. Cell Biol. 18, 685–701 (2017). [DOI] [PubMed] [Google Scholar]
- 2.Hell S. W., Wichmann J., Breaking the diffraction resolution limit by stimulated emission: Stimulated-emission-depletion fluorescence microscopy. Opt. Lett. 19, 780–782 (1994). [DOI] [PubMed] [Google Scholar]
- 3.Betzig E., et al. , Imaging intracellular fluorescent proteins at nanometer resolution. Science 313, 1642–1645 (2006). [DOI] [PubMed] [Google Scholar]
- 4.Rust M. J., Bates M., Zhuang X., Sub-diffraction-limit imaging by stochastic optical reconstruction microscopy (STORM). Nat. Methods 3, 793–795 (2006). [DOI] [PMC free article] [PubMed] [Google Scholar]
- 5.Hess S. T., Girirajan T. P. K., Mason M. D., Ultra-high resolution imaging by fluorescence photoactivation localization microscopy. Biophys. J. 91, 4258–4272 (2006). [DOI] [PMC free article] [PubMed] [Google Scholar]
- 6.Xu K., Zhong G., Zhuang X., Actin, spectrin, and associated proteins form a periodic cytoskeletal structure in axons. Science 339, 452–456 (2013). [DOI] [PMC free article] [PubMed] [Google Scholar]
- 7.Barth R., Bystricky K., Shaban H. A., Coupling chromatin structure and dynamics by live super-resolution imaging. Sci. Adv. 6, eaaz2196 (2020). [DOI] [PMC free article] [PubMed] [Google Scholar]
- 8.Velasco M. G. M., et al. , 3D super-resolution deep-tissue imaging in living mice. Optica 8, 442–450 (2021). [DOI] [PMC free article] [PubMed] [Google Scholar]
- 9.Balzarotti F., et al. , Nanometer resolution imaging and tracking of fluorescent molecules with minimal photon fluxes. Science 355, 606–612 (2017). [DOI] [PubMed] [Google Scholar]
- 10.Weber M., et al. , MINSTED fluorescence localization and nanoscopy. Nat. Photonics 15, 361–366 (2021). [DOI] [PMC free article] [PubMed] [Google Scholar]
- 11.Gwosch K. C., et al. , MINFLUX nanoscopy delivers 3D multicolor nanometer resolution in cells. Nat. Methods 17, 217–224 (2020). [DOI] [PubMed] [Google Scholar]
- 12.Pape J. K., et al. , Multicolor 3D MINFLUX nanoscopy of mitochondrial MICOS proteins. Proc. Natl. Acad. Sci. U.S.A. 117, 20607–20614 (2020). [DOI] [PMC free article] [PubMed] [Google Scholar]
- 13.Schmidt R., et al. , MINFLUX nanometer-scale 3D imaging and microsecond-range tracking on a common fluorescence microscope. Nat. Commun. 12, 1478 (2021). [DOI] [PMC free article] [PubMed] [Google Scholar]
- 14.Keppler A., et al. , A general method for the covalent labeling of fusion proteins with small molecules in vivo. Nat. Biotechnol. 21, 86–89 (2003). [DOI] [PubMed] [Google Scholar]
- 15.Los G. V., et al. , HaloTag: A novel protein labeling technology for cell imaging and protein analysis. ACS Chem. Biol. 3, 373–382 (2008). [DOI] [PubMed] [Google Scholar]
- 16.Gautier A., et al. , An engineered protein tag for multiprotein labeling in living cells. Chem. Biol. 15, 128–136 (2008). [DOI] [PubMed] [Google Scholar]
- 17.Früh S. M., et al. , Site-specifically-labeled antibodies for super-resolution microscopy reveal in situ linkage errors. ACS Nano 15, 12161–12170 (2021). [DOI] [PMC free article] [PubMed] [Google Scholar]
- 18.Lobanov M. Y., Furletova E. I., Bogatyreva N. S., Roytberg M. A., Galzitskaya O. V., Library of disordered patterns in 3D protein structures. PLOS Comput. Biol. 6, e1000958 (2010). [DOI] [PMC free article] [PubMed] [Google Scholar]
- 19.Uversky V. N., The most important thing is the tail: Multitudinous functionalities of intrinsically disordered protein termini. FEBS Lett. 587, 1891–1901 (2013). [DOI] [PubMed] [Google Scholar]
- 20.Xue L., Karpenko I. A., Hiblot J., Johnsson K., Imaging and manipulating proteins in live cells through covalent labeling. Nat. Chem. Biol. 11, 917–923 (2015). [DOI] [PubMed] [Google Scholar]
- 21.Wildanger D., Medda R., Kastrup L., Hell S. W., A compact STED microscope providing 3D nanoscale resolution. J. Microsc. 236, 35–43 (2009). [DOI] [PubMed] [Google Scholar]
- 22.Opazo F., et al. , Aptamers as potential tools for super-resolution microscopy. Nat. Methods 9, 938–939 (2012). [DOI] [PubMed] [Google Scholar]
- 23.Rappoport J. Z., Simon S. M., A functional GFP fusion for imaging clathrin-mediated endocytosis. Traffic 9, 1250–1255 (2008). [DOI] [PMC free article] [PubMed] [Google Scholar]
- 24.Serfling R., et al. , Quantitative single-residue bioorthogonal labeling of G protein-coupled receptors in live cells. ACS Chem. Biol. 14, 1141–1149 (2019). [DOI] [PubMed] [Google Scholar]
- 25.Köchl R., et al. , The signal peptide of the G protein-coupled human endothelin B receptor is necessary for translocation of the N-terminal tail across the endoplasmic reticulum membrane. J. Biol. Chem. 277, 16131–16138 (2002). [DOI] [PubMed] [Google Scholar]
- 26.Afitska K., Fucikova A., Shvadchak V. V., Yushchenko D. A., Modification of C terminus provides new insights into the mechanism of α-synuclein aggregation. Biophys. J. 113, 2182–2191 (2017). [DOI] [PMC free article] [PubMed] [Google Scholar]
- 27.Chin J. W., et al. , An expanded eukaryotic genetic code. Science 301, 964–967 (2003). [DOI] [PubMed] [Google Scholar]
- 28.Lang K., Chin J. W., Cellular incorporation of unnatural amino acids and bioorthogonal labeling of proteins. Chem. Rev. 114, 4764–4806 (2014). [DOI] [PubMed] [Google Scholar]
- 29.Nguyen D. P., et al. , Genetic encoding and labeling of aliphatic azides and alkynes in recombinant proteins via a pyrrolysyl-tRNA Synthetase/tRNA(CUA) pair and click chemistry. J. Am. Chem. Soc. 131, 8720–8721 (2009). [DOI] [PubMed] [Google Scholar]
- 30.Lang K., et al. , Genetic encoding of bicyclononynes and trans-cyclooctenes for site-specific protein labeling in vitro and in live mammalian cells via rapid fluorogenic Diels-Alder reactions. J. Am. Chem. Soc. 134, 10317–10320 (2012). [DOI] [PMC free article] [PubMed] [Google Scholar]
- 31.Hoffmann J. E., et al. , Highly stable trans-cyclooctene amino acids for live-cell labeling. Chemistry 21, 12266–12270 (2015). [DOI] [PubMed] [Google Scholar]
- 32.Nikić I., Kang J. H., Girona G. E., Aramburu I. V., Lemke E. A., Labeling proteins on live mammalian cells using click chemistry. Nat. Protoc. 10, 780–791 (2015). [DOI] [PubMed] [Google Scholar]
- 33.Uttamapinant C., et al. , Genetic code expansion enables live-cell and super-resolution imaging of site-specifically labeled cellular proteins. J. Am. Chem. Soc. 137, 4602–4605 (2015). [DOI] [PMC free article] [PubMed] [Google Scholar]
- 34.Nikić I., et al. , Debugging eukaryotic genetic code expansion for site-specific click-PAINT super-resolution microscopy. Angew. Chem. Int. Ed. Engl. 55, 16172–16176 (2016). [DOI] [PMC free article] [PubMed] [Google Scholar]
- 35.Neubert F., et al. , Bioorthogonal click chemistry enables site-specific fluorescence labeling of functional NMDA receptors for super-resolution imaging. Angew. Chem. Int. Ed. Engl. 57, 16364–16369 (2018). [DOI] [PubMed] [Google Scholar]
- 36.Aloush N., et al. , Live cell imaging of bioorthogonally labelled proteins generated with a single pyrrolysine tRNA gene. Sci. Rep. 8, 14527 (2018). [DOI] [PMC free article] [PubMed] [Google Scholar]
- 37.Bryson D. I., et al. , Continuous directed evolution of aminoacyl-tRNA synthetases. Nat. Chem. Biol. 13, 1253–1260 (2017). [DOI] [PMC free article] [PubMed] [Google Scholar]
- 38.Chen Y., et al. , Addition of isocyanide-containing amino acids to the genetic code for protein labeling and activation. ACS Chem. Biol. 14, 2793–2799 (2019). [DOI] [PMC free article] [PubMed] [Google Scholar]
- 39.Zhou W., Wesalo J. S., Liu J., Deiters A., Genetic code expansion in mammalian cells: A plasmid system comparison. Bioorg. Med. Chem. 28, 115772 (2020). [DOI] [PMC free article] [PubMed] [Google Scholar]
- 40.Chatterjee A., Sun S. B., Furman J. L., Xiao H., Schultz P. G., A versatile platform for single- and multiple-unnatural amino acid mutagenesis in Escherichia coli. Biochemistry 52, 1828–1837 (2013). [DOI] [PMC free article] [PubMed] [Google Scholar]
- 41.Serfling R., et al. , Designer tRNAs for efficient incorporation of non-canonical amino acids by the pyrrolysine system in mammalian cells. Nucleic Acids Res. 46, 1–10 (2018). [DOI] [PMC free article] [PubMed] [Google Scholar]
- 42.Suzuki T., et al. , Crystal structures reveal an elusive functional domain of pyrrolysyl-tRNA synthetase. Nat. Chem. Biol. 13, 1261–1266 (2017). [DOI] [PMC free article] [PubMed] [Google Scholar]
- 43.Miyake-Stoner S. J., et al. , Generating permissive site-specific unnatural aminoacyl-tRNA synthetases. Biochemistry 49, 1667–1677 (2010). [DOI] [PubMed] [Google Scholar]
- 44.Yanagisawa T., et al. , Multistep engineering of pyrrolysyl-tRNA synthetase to genetically encode N(epsilon)-(o-azidobenzyloxycarbonyl) lysine for site-specific protein modification. Chem. Biol. 15, 1187–1197 (2008). [DOI] [PubMed] [Google Scholar]
- 45.Kipper K., et al. , Application of noncanonical amino acids for protein labeling in a genomically recoded Escherichia coli. ACS Synth. Biol. 6, 233–255 (2017). [DOI] [PubMed] [Google Scholar]
- 46.Belin B. J., Goins L. M., Mullins R. D., Comparative analysis of tools for live cell imaging of actin network architecture. Bioarchitecture 4, 189–202 (2014). [DOI] [PMC free article] [PubMed] [Google Scholar]
- 47.Jasnin M., et al. , Three-dimensional architecture of actin filaments in Listeria monocytogenes comet tails. Proc. Natl. Acad. Sci. U.S.A. 110, 20521–20526 (2013). [DOI] [PMC free article] [PubMed] [Google Scholar]
- 48.Gu L., et al. , Molecular resolution imaging by repetitive optical selective exposure. Nat. Methods 16, 1114–1118 (2019). [DOI] [PubMed] [Google Scholar]
- 49.Leijnse N., Oddershede L. B., Bendix P. M., Helical buckling of actin inside filopodia generates traction. Proc. Natl. Acad. Sci. U.S.A. 112, 136–141 (2015). [DOI] [PMC free article] [PubMed] [Google Scholar]
- 50.Claessens M. M. A. E., Semmrich C., Ramos L., Bausch A. R., Helical twist controls the thickness of F-actin bundles. Proc. Natl. Acad. Sci. U.S.A. 105, 8819–8822 (2008). [DOI] [PMC free article] [PubMed] [Google Scholar]
- 51.Leijnse N., et al. , Filopodia rotate and coil by actively generating twist in their actin shaft. Nat. Commun. 13, 1636 (2022). [DOI] [PMC free article] [PubMed] [Google Scholar]
- 52.Schmied W. H., Elsässer S. J., Uttamapinant C., Chin J. W., Efficient multisite unnatural amino acid incorporation in mammalian cells via optimized pyrrolysyl tRNA synthetase/tRNA expression and engineered eRF1. J. Am. Chem. Soc. 136, 15577–15583 (2014). [DOI] [PMC free article] [PubMed] [Google Scholar]
- 53.Reinkemeier C. D., Girona G. E., Lemke E. A., Designer membraneless organelles enable codon reassignment of selected mRNAs in eukaryotes. Science 363, eaaw2644 (2019). [DOI] [PMC free article] [PubMed] [Google Scholar]
- 54.Reinkemeier C. D., Lemke E. A., Dual film-like organelles enable spatial separation of orthogonal eukaryotic translation. Cell 184, 4886–4903.e21 (2021). [DOI] [PMC free article] [PubMed] [Google Scholar]
Associated Data
This section collects any data citations, data availability statements, or supplementary materials included in this article.
Supplementary Materials
Data Availability Statement
All study data are included in the article and/or SI Appendix.


