

Abstract
In this research, the possibility of estimating the time a video was recorded at through electric network frequency is explored by examining various light sources in differentiating circumstances. This research focuses on videos made with smartphones. The smartphone cameras make use of an integrated complementary metal oxide semiconductor sensor. The filmed videos are analyzed using software, which employs a small electric network frequency (ENF) database to determine the time of recording of a video made in experimental circumstances. This research shows that in ideal circumstances, it is possible to determine the time stamp of a video recording made with a smartphone. However, it becomes clear that different light sources greatly influence the outcome. The best results are achieved with Halogen and Incandescent light sources, both of which also seem promising in less ideal circumstances. LED sources do work in ideal circumstances and, however, do not show much success in lesser circumstances. This research further demonstrates that there is potential in using ENF to determine a time stamp of recorded videos and provides validation on prior research on this topic. It proves usable in ideal circumstances with the presence of a clear light source on a white wall. With additional research, it has potential to become a feasible method to use for forensic settings in circumstances that are less ideal.
Highlights.
Electric network frequency (ENF) can be visualized in video material due to light sources.
Electric network frequency is a signal unique over time and thus can be used in time estimation for videos.
Electric network frequency leads to a time of recording estimation for smartphone videos utilizing a rolling shutter.
Time estimation using ENF can be done with different light sources and different phones.
1. INTRODUCTION
Within the forensic field, video evidence becomes more relevant due to the wide availability of camera devices everyone carries with them. Due to this rise in camera devices, more video evidence is available for forensic investigations. Within video forensics, it is important to verify the authenticity and estimate or validate the time of a recording. A new method of this time verification is using hidden information present in videos. A type of this hidden information is the electric network frequency (ENF), which is a fluctuating signal within the power grid. This time‐unique signal can be used to determine the time stamp, if it can be matched with data [1]. This study will focus on the presence of ENF in videos to determine a time of recording. The proposed method could lead to a faster and better verification of video material, an estimation of the time of recording of a video and a method to distinguish between fabricated and real video evidence.
1.1. Electric network frequency
Electric network frequency (ENF) is the frequency of the power grid. This signal is alternating current (AC). The grid has a frequency of 50 Hz in most of the world and 60 Hz in North America and parts of Asia [2]. However, this frequency is not stable and fluctuates around 50 Hz (in Europe) depending on the load on the grid. This makes the ENF unique over time. These small variations can be visualized and consequently analyzed [1]. A visualization of 1‐day ENF in the Netherlands is shown in Figure 1. These data were provided by TenneT. In this figure, the frequency (around 50 Hz) is plotted over time. The time is from midnight to midnight on February the eleventh.
FIGURE 1.

ENF data from November 2, 2021, provided by TenneT
Electrical devices are influenced by ENF. This influence is clearer when a device is directly connected to the grid. These devices are tuned in such a way that they do not suffer from the frequency fluctuations. Light sources are devices that show ENF variations as a flickering of the light intensity [3].
1.2. ENF in video
The flickering of a light source is visible in videos. This flickering can be extracted from an illuminated video as a signal, showing the variations in frequency created by the load on the grid (as can be seen in Figure 1). Therefore, the frequency variation can give a time estimation if reference material is available [1, 4].
Different light sources respond differently on the ENF presence. It has been shown in previous research that the light source has an effect on the estimation of the time of recording [5]. This indicates that using a variety of light sources is important to clearly validate ENF extraction from video material.
There are different proposed methods how the extraction of an ENF signal can be done depending on the shutter mechanism of the recording device. Two methods are based on a global shutter mechanism, in which all pixels in a frame are recorded simultaneously. These include the super pixel‐based [6, 7] and a steady average pixel approach [3]. Both these methods focus on an intensity change of pixels in between each frame. A third method makes use of another shutter mechanism, namely, the rolling shutter mechanism. With this mechanism, there are multiple subframes available for each frame. Subsequently creating a higher sampling rate, making it easier to detect a (relatively) high frequency [8, 9]. This method is based on the light intensity difference within a single frame. The rolling shutter mechanism will be used in this research.
The above‐described methods all work best with static imagery. For this paper, static videos will be looked at to validate the possibility of extraction and time stamping video material. Nonstatic videos often occur within video forensics. Different methods are needed when looking at nonstatic videos [10], which will not be applied within this paper.
1.3. Relevance of ENF
With digital forensic evidence, it is not always clear when and where a recording was made, nor if it is legitimate. Video material in forensic cases may contain proof of a crime or provide evidence in a different manner. With these videos, it is important to know whether they are real and whether the information in them is accurate. Questions that may arise on the validity of evidence given could include whether or not the location and date stamps match with those purported or if any tampering has occurred. This tampering phenomenon can happen in the form of replay attacks, in which a video is given an incorrect time stamp and played during a later occurrence. Consequently, it is perceived that the video is from a different time instance than when originally recorded.
With an ENF signal from a recording, this signal could uncover information concerning the time of this recording, which might not be available directly from the video. This information could be extracted in the form of a fluctuating frequency. By matching this signal with available known ENF signals, an estimation regarding the time and location of the recording can be used as evidence. In cases of fraudulent recordings, the lack of such a frequency or gaps within the timeline could be an indication of tampering.
Proving the legitimacy of a video is only one example how useful time determination can be. Within forensics, there is often a need to create a timeline of events. Today, these events are often captured by a video recorder such as a smartphone. When police obtain such recordings, they can be admitted as proof. Therefore, it is important that this proof is real, as well as that the time and location indication dictated in the video has not been tampered with. A potential solution is to examine the hidden information present in videos, such as the ENF signal.
In this paper, the possibility of extracting an ENF signal from static smartphone videos will be investigated. Research is available on video material; however, a large‐scale proof‐of‐concept research on smartphone videos has yet to be done. This research offers a larger validation on the extraction and matching of ENF.
Within this report, a method will be discussed to prove the concept of ENF extraction from a video and the time estimation using the extracted signal. This methodology will include a list of experiments. Subsequently, results for these investigations will be presented, after which conclusions will be made based on their outcomes. The full process and potential future work will be discussed in detail.
2. MATERIALS AND METHODS
The scope of this research was to determine the possibility of ENF extraction from videos and estimating the time stamp for these videos. This was tested with different phones and light sources.
2.1. Materials
For the extraction of ENF signals, videos were made using four different light sources. The four distinct light sources used in this research include a compact fluorescent light bulb (CFL), a light emitting diode bulb (LED), a halogen bulb, and an incandescent light bulb.
The videos were made using a Huawei P20 Lite cell phone. The Huawei P20 Lite has a Full HD video resolution of 1920 × 1080 pixels. It records videos at approximately 30 frames per second. To verify whether the Huawei P20 Lite performs comparably to other phones, a set of similar videos were recorded with different phones, namely, a HTC One mini 2, a Motorola Moto G (3rd Generation), an iPhone 7, and a Samsung Galaxy A71. All these phones utilize the complementary metal oxide semiconductor (CMOS) sensor and therefore have a rolling shutter mechanism. The specifications of the different phones are shown in Table 1.
TABLE 1.
Different phones and their specification
| Phone | Resolution | Frame rate (fps) |
|---|---|---|
| Huawei P20 Lite | 1920 × 1080 | 29.5 |
| HTC One Mini 2 | 1280 × 720 | 30.0 |
| Motorola Moto G (3G) | 1920 × 1080 | 29.4 |
| IPhone 7 | 1920 × 1088 | 30.0 |
| Samsung Galaxy A71 | 1920 × 1080 | 30.0 |
2.2. Videos
The different experiments are shown in Table 2. After each experiment, an analysis of the videos was done in order to determine the correct next steps.
TABLE 2.
Different experimental setups
| Experiment | Test description |
|---|---|
| Test 1 |
A single light source directly on a white background 30 cm distance between background and camera. Matching with audio |
| Test 2 |
All light sources directly on a white background 30 cm distance between background and camera Matching with ENF data |
| Test 3 |
Different light sources in less ideal circumstances 100 cm distance between background and camera Matching with ENF data |
| Test 4 |
All light sources Longer videos (5 min, 10 min, 15 min, 20 min, 25 min, and 30 min) Matching with ENF data |
| Test 5 |
Single light source (Halogen) Different distances (50 cm, 100 cm, 150 cm, and 200 cm) Matching with ENF data |
| Test 6 |
Two light sources (Halogen and Incandescent) 30 cm distance between background and camera Matching with two different ENF databases |
| Test 7 | Halogen light source, different phones (Huawei P20 Lite, HTC One mini 2, Motorola Moto G (3rd), IPhone 7, and Samsung Galaxy A71) matching with ENF data |
| Test 8 | Different light sources, different phones (Huawei P20 Lite, HTC One mini 2, IPhone 7, and Samsung Galaxy A71) matching with ENF data |
ENF, Electric network frequency.
2.3. Analysis of the videos
The analysis of the videos was done using MATLAB 2020b [11]. The full code is available via GitHub (https://github.com/GuusF16/ENF_extraction_from_video).
The first step of analysis was to extract a light intensity signal from the video. This was done by taking the average of the gray values of the separate frames in the video. The gray value of a pixel is a representation of the light intensity at that pixel. To take the rolling shutter into account, the average value was taken for each column of every frame. This can be adjusted to rows whether the CMOS‐chip was rotated by 90 degrees in the camera. In ideal circumstances, this can be checked by testing the camera on a white wall illuminated by a light source from close distance. This step resulted in a signal from a video. The signal represents the light intensity per column per frame. If the video recorded an ENF signal, it was present in the light intensity signal.
A high‐pass filter was applied to the light intensity signal in order to remove the direct current component. The DC component creates an offset in the signal and does not provide any information on the ENF. With the DC component removed, the signal contained multiple frequency components. These can be visualized by applying the Fast Fourier transform (FFT) to the signal. This will create a power spectrum of all available frequencies within the signal. For each frequency component of interest in the signal, a band‐pass filter around that frequency was applied. This removed everything from the signal except the part within the passband. Then, a possible ENF signal could be extracted by using a short‐time Fourier transform (STFT) on the band‐pass signal. The STFT checks the precise frequency for small time steps. This resulted in a varying frequency around the specific frequency component, much like the ENF signal is a varying frequency around 50 Hz. These steps can be seen in Figure 2.
FIGURE 2.

A schematic visualization of the extraction of ENF from a video
2.4. Matching
The variation around the specific frequency can be matched with an available ENF database signal. Since these signals vary around a different frequency, a simple differential comparison does not work. Therefore, matching was done using cross‐correlations. The cross‐correlation determines a similarity between the shape of two signals, independent of amplitude or offset. Indicating that a high correlation coefficient simply means a large similarity between the shapes of the different signals. The location of the highest correlation forms a shift at which point the two signals are most similar. This shift can be translated to a timestamp with respect to the length of the signal. Since the ENF data have a defined time, the shift with respect to the ENF data can be transformed into a time estimation.
For this research, a set of requirements were determined for a match. If the two signals had a correlation coefficient of 0.5 or lower, the similarity between the signals could be due to chance, which does not give a good estimation of the time of recording. For a cross‐correlation above 0.8, the similarity was determined high enough to state that the signals are nearly identical. While coefficients between 0.5 and 0.8 clearly indicated that the signals showed similarity, not enough similarity was present to give certainty.
The error of the time of recording with respect to the actual time stamp was defined as acceptable for this research if a mismatch of 1 min was present. There is a dependency on the video length and the correlation; therefore, for each case around the minute‐mark, a decision was made whether this time‐shift was acceptable.
2.5. Databases
The database to match ENF signals with was gathered via TenneT. TenneT controls the grid in the Netherlands and has all the frequency data. These data can be requested per day. The ENF data can then be gathered for the specified day and stored as an excel file. Next to the TenneT data, the Netherlands Forensic Institute (NFI) is able to record ENF at high precision for short periods of time. This second dataset can be used; in case, the TenneT data do not suffice. Although the data are a recording of the ENF signal and not available as a database with different recordings, the data requested (from either TenneT or the NFI) will be seen as a database for this research. The difference between the databases is their resolution. The database of TenneT is recorded with one sample per 4 s, whereas the NFI database is recorded approximately once per second.
This higher resolution from the NFI also results in a more precise ENF signal as reference.
3. RESULTS
From footage obtained in different experiments, an ENF signal is extracted before analysis. The experiments have the following results with regard to extracting and matching the ENF from a video with the reference ENF from a database.
3.1. Test 1
In order to establish the possibility of ENF extraction, a short video was compared with a short audio fragment according to test 1 (Table 2). A single light source was used on a white background. The video was recorded from a short distance of 30 cm. ENF was extracted from the video as well as audio fragments and subsequently matched with each other. The visualization of this match is shown in Figure 3. It can be seen that the ENF available from the audio fragment shows a near perfect match with the ENF extracted from the video.
FIGURE 3.

Overlayed ENF signals from an audio signal and a video signal (test 1)
3.2. Test 2
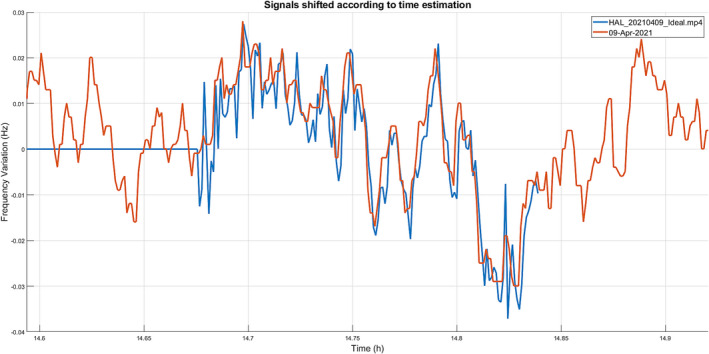
In ideal circumstances, the four different light sources are matched with reference ENF from the database. This is done using the setup from test 2 (Table 2). The light sources were directed at a white wall and from a short distance filmed with the camera. Upon examination, the results show that the highest correlation coefficient for all light sources is above 0.95. These highest correlation coefficients matched with a certain time with respect to the ENF data. This time is compared to the actual time of recording (Table 3). This indicates that for all these light sources, a correct time estimation can be done in ideal circumstances. A visualization of the match using a halogen light source is shown in Figure 4. The shape of the signal is similar, while the amplitude of certain peaks is not the same. Both frequency signals are normalized around zero for this graph and all other graphs.
TABLE 3.
Results of different light sources in ideal circumstances (test 2)
| Light source | Highest CC | Time error |
|---|---|---|
| Compact fluorescent light | 0.9865 | 0 s |
| Halogen light bulb | 0.9888 | 0 s |
| Incandescent light bulb | 0.9563 | 0 s |
| Light emitting diode bulb | 0.9628 | 0 s |
FIGURE 4.

Halogen light source matched with ENF data (test 2)
3.3. Test 3
The results for the third test are shown in Table 4. This test used the different light sources set at larger distances. The light is directed at the wall but the camera films from a larger distance. It shows that in less ideal circumstances, the CFL bulb and the LED bulb do not match correctly.
TABLE 4.
Results of different light sources in nonideal circumstances (test 3)
| Light source | Highest CC | Time error | Matching CC | Time error |
|---|---|---|---|---|
| Compact Fluorescent Light | 0.7785 | 1 h 20 m 22 s | 0.5413 | 1 m 10 s |
| Halogen Light Bulb | 0.8326 | 10 s | 0.8326 | 10 s |
| Incandescent Light Bulb | 0.9384 | 12 s | 0.9384 | 12 s |
| Light Emitting Diode Bulb | 0.7727 | 29 m 21 s | 0.5225 | 1 s |
3.4. Test 4
During testing, it was noticed that short videos in different settings did not provide an acceptable correlation score. Test 4 resulted in a better understanding about estimating time of recording with different video lengths. With this test, long videos were made from a short distance to the wall. The outcomes are visible in Table 5.
TABLE 5.
Results of different video lengths (test 4)
| Length | Highest CC | Time error |
|---|---|---|
| Halogen | ||
| 5 min | 0.8586 | 14 s |
| 10 min | 0.9537 | 14 s |
| 15 min | 0.9431 | 14 s |
| 20 min | 0.9392 | 14 s |
| 25 min | 0.9364 | 14 s |
| 30 min | 0.9408 | 14 s |
| Incandescent | ||
| 5 min | 0.7911 | 20 s |
| 10 min | 0.8193 | 20 s |
| 15 min | 0.8661 | 16 s |
| 20 min | 0.9099 | 16 s |
| 25 min | 0.9343 | 16 s |
| 30 min | 0.9285 | 16 s |
In Figure 5, the highest correlation coefficient is visualized. The 25‐min recording using the incandescent light source shows a clear similarity in shape with some differences in spikes not present in the ENF data.
FIGURE 5.

Incandescent light bulb video of 25 min matched with ENF (test 4)
3.5. Test 5
Test 5 communicates the evaluation of various distances between the wall and the camera. The halogen light source remained static. The distances all showed matching possibilities with differing correlation coefficients. The results are shown in Table 6. The highest correlation coefficient is shown including the time error with respect to the actual time of recording. The correlation for the signal closest to the actual time of recording is also shown.
TABLE 6.
Results of different distances using a halogen light bulb (test 5)
| Distance | Highest CC | Time error | Matching CC | Time error |
|---|---|---|---|---|
| 50 cm | 0.7611 | 13 h 08 m 00 s | 0.5226 | 48 s |
| 100 cm | 0.7558 | 14 s | 0.7558 | 14 s |
| 100 cm Zoomed | 0.9093 | 13 s | 0.9093 | 13 s |
| 150 cm | 0.6108 | 11 s | 0.6108 | 11 s |
| 150 cm Zoomed | 0.8108 | 14 s | 0.8108 | 14 s |
| 200 cm | 0.7185 | 9 h00 m45 s | 0.6543 | 3 s |
| 200 cm Zoomed | 0.6692 | 15 s | 0.6692 | 15 s |
3.6. Test 6
The sixth test was done in order to determine the better reference database and resulted in Table 7. This test involved recording a video in ideal circumstances, meaning a small distance between camera and the wall. The videos were correlated with both datasets. The biggest difference between the datasets is the run time. For the Halogen bulb, the run time as well as the correlation coefficient is a bit lower.
TABLE 7.
Results of different databases (test 6)
| Light source | Database | Run time | Highest CC | Time error |
|---|---|---|---|---|
| Incandescent bulb | TenneT | 784.00 s | 0.9400 | 13 s |
| NFI | 3663.34 s | 0.9629 | 11 s | |
| Halogen bulb | TenneT | 519.46 s | 0.9245 | 15 s |
| NFI | 3135.84 s | 0.9408 | 5 s |
NFI, Netherlands Forensic Institute.
The match with the NFI database (Figure 6) and the match with the TenneT database (Figure 7) are both shown for the halogen bulb tests. From these figures, it becomes clear that both show matching signals. The largest deviation is the precision of the signals. This precision is due to the video analysis. In processing, the sample rate is changed in order to match the sample rate with reference material from the database. The sample rate is changed from one sample per 5 s (for the TenneT data) to 1 sample per second (for the NFI data). This shows up in the figure as a more precise signal, which can be seen in the figures. Due to the prior results of the LED light and CFL light, the decision was made to not explore these light sources in this test.
FIGURE 6.

Result of the halogen light matched with data from the NFI (1 sample per second)
FIGURE 7.
Result of the halogen light matched with data from TenneT (1 sample per 4 s)
3.7. Test 7
The results of the phone‐verification test are shown in Table 8. In this table, it can be seen that phones other than the Huawei P20 Lite are consistent in performance with regard to estimating the time of recording. From these results, it can be extrapolated that the Huawei P20 Lite is representative for different types of phones, and therefore, the different phones would have performed similar in the prior tests.
TABLE 8.
Results of different phones with halogen light source (test 7)
| Phone | Highest CC | Time error |
|---|---|---|
| iPhone 7 | 0.9814 | 12 s |
| Motorola Moto G | 0.9849 | 16 s |
| Samsung Galaxy A71 | 0.9137 | 12 s |
| HTC One Mini 2 | 0.9944 | 12 s |
| Huawei P20 Lite | 0.9834 | 12 s |
In Figures 8 and 9, the visualization of the match is shown for the Huawei P20 Lite and the HTC One Mini 2. Both these matches have a clear similar shape to the ENF data, which shows that the time estimation is visually correct as well.
FIGURE 8.

Result using the Huawei in combination with halogen light (test 7)
FIGURE 9.

Result using the HTC in combination with halogen light (test 7)
3.8. Test 8
This continuation test for phone verification was done with the remaining light sources. For this test, the Motorola Moto 3 was left out due to old age of the phone itself which caused the battery to fully deplete after a single recording. The rest of the results are shown in Tables 9, 10, 11. It can be seen however that in an earlier test (test 2), the Huawei P20 Lite did uncover the correct time of recording with video illuminated by a LED bulb.
TABLE 9.
Results of different phones with a LED (test 8)
| Phone | Highest CC | Time error |
|---|---|---|
| iPhone 7 | 0.7317 | 11 s |
| Samsung Galaxy A71 | 0.5927 | 16 s |
| HTC One Mini 2 | 0.7509 | 16 s |
| Huawei P20 Lite | 0.5451 | 9 h 35 m 20 s |
TABLE 10.
Results of different phones with a CFL (test 8)
| Phone | Highest CC | Time error |
|---|---|---|
| iPhone 7 | 0.5418 | 9 h 10 m 44 s |
| Samsung Galaxy A71 | 0.4964 | 9 h 01 m 08 s |
| HTC One Mini 2 | 0.8308 | 20 s |
| Huawei P20 Lite | 0.6462 | 9 h 07 m 02 s |
TABLE 11.
Results of different phones with an incandescent light source (test 8)
| Phone | Highest CC | Time error |
|---|---|---|
| iPhone 7 | 0.9800 | 14 s |
| Samsung Galaxy A71 | 0.6457 | 6 h 18 m 58 s |
| HTC One Mini 2 | 0.9846 | 14 s |
| Huawei P20 Lite | 0.7529 | 10 s |
With the CFL bulb, videos with the HTC One Mini 2 can correctly estimate the time of recording, where the other phones do not.
With the incandescent light source, it is again visible that the Huawei P20 Lite performs dissimilar from test 2.
4. DISCUSSION
In the section, the results and the methods will be discussed as well as the forensic relevance of this research and recommendations for future research.
4.1. Light sources
The aim of this research was to determine whether ENF signals could be detected in video material made with smartphones and a time estimation uncovered from the found signal. During research, choices were made with regards to the further experimentation in order to achieve this goal. These choices were made in cases where the ENF signal could not be extracted, time of recording of a video containing a certain light source could not be correctly estimated and the follow‐up experimentation did not improve the estimation. In these instances, more insight could not be gained by performing experiments, which would not result in correct estimations for the time of recording. This was the case with video material containing LED and CFL sources. The circumstances for videos containing these light sources were therefore not further explored. The process that occurred for these decisions are described in more detail below.
From the results in Table 4, it was visible that a video containing a LED light source under nonideal circumstances could not estimate the correct time stamp with a correlation coefficient that showed clear similarity between the signals (higher than 0.8). This is also the case for videos containing a CFL bulb. For both situations, it was hypothesized that this may be due to the video length of these lights; therefore, the fourth test was also done for the CFL bulb and LED bulb. However, for both light sources, there was no possible match detectable or even an ENF signal to extract. Further hypothesizing led to an experimentation with different LED sources since it might be the case that different LED bulbs respond differently to the ENF. This test did not show promising results and consequently was left out of analysis. An explanation for the results for LED sources could be that the LED works on a direct current: It functions with a single direction of current. The switching of currents in an alternating current may subsequently not clearly show up with a LED source.
For the CFL bulb, it is intriguing to note that in previous research [4, 12], fluorescent light illumination seemed to be working for ENF extraction and matching, while in this specific study, the time of recording for videos illuminated by a CFL could not be correctly estimated as soon as the circumstances were less than ideal. This could be due to the type of light source used. In this study, a compact fluorescent light bulb was used, which is based on similar principles as fluorescent tube. In previous research [4, 12], the most likely light source that was used is the fluorescent tube since this is used in most office spaces. However, it is not explicitly mentioned in these papers [4, 12]. The length of a fluorescent tube in comparison with the size of the CFL bulb might have influenced the presence of ENF due to the amount influence that polarity switching has. Since the results for videos containing a CFL bulb were not matchable with the correct time of recording, they were also mostly left out of this report.
4.2. Forensic relevance
With a correct and simple way to verify or estimate the time stamp of videos, video forensics can be improved and streamlined. Verifying time stamps of recordings could become more efficient with the proposed method. The research outcomes exhibited that, within limits, there are valid possibilities to correctly estimate the time of recording for videos using the ENF presence. A video with illumination from a halogen or incandescent light source can be correctly time stamped in the circumstances tested. LED and CFL sources were correctly time stamped in ideal circumstances (30 cm distance, white background, 10 min), indicating that the relevance of this research is currently still dependent on type of illumination and circumstances of videos. The method designed in this research can directly be used in the ideal circumstances outlined previously as well as applied in future research.
In practice, how long it takes to find the correct time stamp for a video would be of much less importance. This would mean that a higher correlation coefficient can be achieved by having a database with a higher sample rate such as the NFI database. In reality, a larger database would have to be accessed as the precise time (or which day) the video was recorded in is unknown. A higher correlation coefficient is therefore important since there is also a higher chance of a false positive due to this increased database. This research shows that it is possible to match with a higher correlation provided that the reference data have higher sample rate and the computational time is available. In cases where a quick result is needed, a lower sampling rate and less precision can be used to reach an approximate time quicker.
In addition, to prove validity of video evidence in the court room, a visual comparison of the matching signals by a researcher is ideal. With this visual comparison, the conclusions would be supported by both a researcher and the system build in this research. This indicates that the forensic relevance and the applicability of this research can be vastly improved by having a visual output on which a researcher can base clear conclusions in tandem with the outcomes made by the program. The provided figures already provide some form of visual inspection; however, these figures are not currently interactive and a better match cannot be visually explored.
4.3. Recommendations
This research shows promising results with respect to ENF in video material and the possibility to obtain an estimation of the time of recording from videos. Most results were achieved in ideal or semi‐ideal situations. For future research, it is important to test for time estimation in less ideal circumstances, which are more likely to occur in real life, such as moving videos, other background colors, or moving objects within the video.
In addition, it would be beneficial to examine this method on actual case videos in order to test whether a time estimation is possible in these situations. Knowing the real time of these recordings is imperative to be able to verify whether the results uncovered with this method are correct.
It is also recommended to investigate with more light sources and phones. For this research, four different light sources were used with one bulb per type. However, earlier research showed promising results with CFL sources, which was not confirmed in this study. As previously mentioned, this could be due to the type of bulb used. It may also be beneficial to determine the most frequently used light sources in real forensic settings test with. The same is true for different phones. More (and newer) phones should be tested to take into account higher framerates present in newer phones. Phones that have a higher presence in society should be tested as well.
For future research in respect to ENF data collection, testing with multiple types of phones is recommended. For this research, only five different types of phones were used. Similar to the importance of investigating varying light sources, different phone types may show different results. Despite the fact that in this study several phones produced similar outcomes, this does not indicate that this is the case for phones not tested.
Alongside the video‐track, it could be a possibility to combine the images with the audio‐track accompanying the videos. The combination of the ENF presence due to light sources and ENF presence in the audio‐part of the file could result in more precise ENF extraction. Using audio to support the ENF extraction could give more options in cases where a clear light source might not be present.
It is recommended for future work to start a database with ENF patterns. Currently, ENF can be recalled for some period; however, it is not yet stored in a database. This could make using ENF as evidence challenging since there are no proper references to match with. In this study, the date the videos were taken was not an unknown variable, making it possible to gather ENF data from that day. For real‐life situations, this would likely not be known. A database is therefore necessary.
The localization of a video recording is not explored during this research. This could prove useful in future research. The time‐shift due to the travel speed of the current might not be eligible for a location determination within a relatively small region; however, different methods to determine the location based on ENF might be possible.
Lastly, more testing is needed to prove out the potential applications of ENF data collection and identification. The proposed method can currently be used on videos with a clear background, which is illuminated by a light source. If this method is to be used in a forensic setting, validation is imperative, meaning that testing should be done under more circumstances to verify the correct workings of the method. This should include testing with different light sources, extra distances, and different backgrounds.
5. CONCLUSION
This research shows that it is possible to extract the ENF pattern from a video file recorded with a smartphone utilizing a CMOS sensor. It also revealed that the quality of the ENF extraction is dependent on the circumstances of the video (background, distance to background, and light source). In certain circumstances, it is possible to match a video to the time of recording. In less ideal situations (larger distance, darker background, and shorter video), it depends on the light source that was used.
It can be concluded that estimating the time stamp for a video based on the ENF signal present under artificial lighting can be achieved. With the proposed method, it is possible to reliably have a correct estimation for the time of recording in cases where the video is made in near ideal circumstances, dependent on the light source, also in less ideal circumstances. This study showed that the method had a low error rate and can accurately and precisely identify approximate time stamps in similar situations. Time estimation based on ENF signal extraction could therefore be used in video forensics and shows precise matching for videos containing halogen or incandescent light sources.
ACKNOWLEDGEMENTS
Thanks for this research goes out to TenneT for the provision of ENF data from the Netherlands. Time estimation of videos based on reference ENF data would have been impossible without their data.
Frijters G, Geradts ZJ. (2022). Use of electric network frequency presence in video material for time estimation. J Forensic Sci. 2022;67:1021–1032. 10.1111/1556-4029.15003
Accepted for presentation at the 74th Annual Scientific Conference of the American Academy of Forensic Sciences, February 21‐25, 2022, in Seattle, WA.
REFERENCES
- 1. Grigoras C. Digital audio recording analysis: the electric network frequency (ENF) criterion. Int J Speech Lang Law. 2005;12(6):63–76. 10.1558/sll.2005.12.1.63 [DOI] [Google Scholar]
- 2. Grigoras C. Applications of ENF criterion in forensic audio, video, computer and telecommunication analysis. Forensic Sci Int. 2007;167(2–3):136–45. 10.1016/j.forsciint.2006.06.033 [DOI] [PubMed] [Google Scholar]
- 3. Garg R, Varna AL, Wu M. "seeing" ENF: Natural time stamp for digital video via optical sensing and signal processing. In: Proceedings of the 19th ACM International Conference on Multimedia; 2011 Nov 28‐Dec 1; Scottsdale, AZ. New York, NY: Association for Computing Machinery; 2011; p. 23–32. 10.1145/2072298.2072303 [DOI] [Google Scholar]
- 4. Garg R, Varna AL, Hajj‐Ahmad A, Wu M. "seeing" ENF: Power‐signature‐based timestamp for digital multimedia via optical sensing and signal processing. IEEE Trans Inf Foren Sec. 2013;8(9):1417–32. 10.1109/TIFS.2013.2272217 [DOI] [Google Scholar]
- 5. Vatansever S, Dirik AE, Memon N. Factors affecting ENV based time‐of‐recording estimation for video. In: Proceedings of the ICASSP 2019–2019 IEEE International Conference on Acoustics, Speech and Signal Processing (ICASSP); May 12, 2019–17; Brighton, U.K. Piscataway, NJ: IEEE; 2019. p. 2497–501. 10.1109/ICASSP.2019.8682419 [DOI] [Google Scholar]
- 6. Vatansever S, Dirik AE, Memon N. Detecting the presence of ENF signal in digital videos: a superpixel‐based approach. IEEE Signal Process Lett. 2017;24(10):1463–7. 10.1109/LSP.2017.2741440 [DOI] [Google Scholar]
- 7. Nagothu D, Chen Y, Aved A, Blasch E. Authenticating video feeds using electric network frequency estimation at the edge. ICST Trans Sec Safety. 2021;7(24):168648. 10.4108/eai.4-2-2021.168648 [DOI] [Google Scholar]
- 8. Vatansever S, Dirik EA, Memon DN. Analysis of rolling shutter effect on ENF based video forensics. IEEE Trans Inf Foren Sec. 2019;14(9):2262–75. 10.1109/TIFS.2019.2895540 [DOI] [Google Scholar]
- 9. Su H, Hajj‐Ahmad A, Garg R, Wu M. Exploiting rolling shutter for ENF signal extraction from video. In: Proceedings of the IEEE International Conference on Image Processing (ICIP 2014); 2014 Oct 27–30; Paris, France. Piscataway, NJ: IEEE; 2014. p. 5367–71. 10.1109/ICIP.2014.7026086 [DOI] [Google Scholar]
- 10. Fernández‐Menduiña S, Pérez‐González F. Temporal localization of non‐static digital videos using the electrical network frequency. IEEE Signal Process Lett. 2020;27:745–9. 10.1109/LSP.2020.2988145 [DOI] [Google Scholar]
- 11. MATLAB . 9.9.0.1538559 (R2020b) update 3. Natick, MA: The MathWorks Inc.; 2020. [Google Scholar]
- 12. Su H, Hajj‐Ahmad A, Wong CW, Garg R, Wu M. ENF signal induced by power grid: A new modality for video synchronization. In: Proceedings of the 2nd ACM International Workshop on Immersive Media Experiences. ImmersiveMe ‘14; 2014 Nov 7; Orlando, FL. New York, NY: Association for Computing Machinery; 2014; p. 13–8. 10.1145/2660579.2660588 [DOI] [Google Scholar]