

Abstract
Electrode dissolution was monitored in real‐time during Kolbe electrolysis along with the characteristic products. The fast determination of appropriate reaction conditions in electro‐organic chemistry enables the minimization of electrode degradation while keeping an eye on the optimal formation rate and distribution of products. Herein, essential parameters influencing the dissolution of the electrode material platinum in a Kolbe electrolysis were pinpointed. The formation of reaction products and soluble platinum species were monitored during potentiodynamic and potentiostatic experiments using an electroanalytical flow cell coupled to two different mass spectrometers. The approach opens new vistas in the field of electro‐organic chemistry because it enables precise and quick quantification of dissolved metals during electrosynthesis, also involving electrode materials other than platinum. Furthermore, it draws attention to the vital topic of electrode stability in electro‐organic synthesis, which becomes increasingly important for the implementation of green chemical processes utilizing renewable energy.
Keywords: electrochemistry, electrode stability, Kolbe electrolysis, online electrochemical mass spectrometer, Pt dissolution
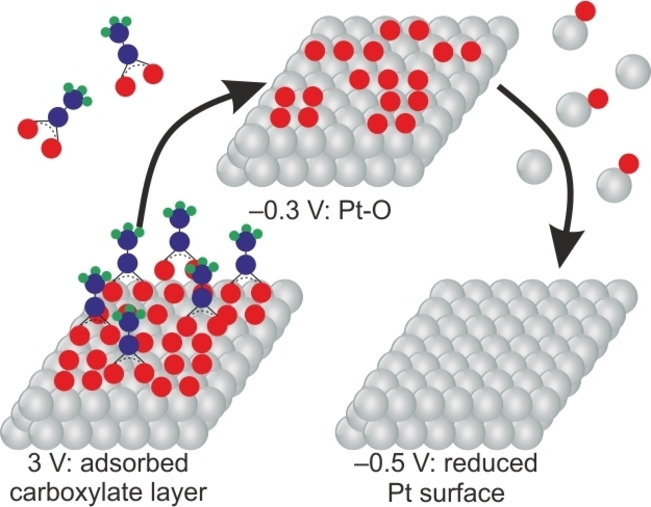
Kolbe electrolysis: An electroanalytical flow cell coupled with an inductively coupled plasma mass spectrometer and an online electrochemical mass spectrometer is used to quantify Pt dissolution during Kolbe electrolysis of acetic acid. The results show that cathodic dissolution occurs at more negative potentials compared to other electrolytes, suggesting that adsorbed carboxylate has to be removed from the surface before Pt−O can be reduced.
Introduction
Electrosynthesis is a growing research field due to its potential to achieve greener chemical processes via novel, more sustainable synthesis strategies. [1] The uniqueness of this discipline resides in the aspect of directly transferring electrons from renewable sources into base chemicals in order to convert them into value‐added products. With the growing demand, fundamental research is challenged with the quest for better electrocatalysts demonstrating superior activity, selectivity, and stability in these processes. While activity and selectivity performance have so far been in the focus of most studies, the topic of electrode stability is rather uninvestigated in the field of organic electrochemistry and so far limited to ex‐situ characterizations. [2] In other fields, like lithium‐ion batteries [3] or fuel cells, [4] this challenge is long known and actively investigated. Aside from the deleterious electrode material loss directly limiting the lifetime of reactors, effects like metal re‐deposition on the counter electrode or product contamination might also cause severe problems. To address this issue, we present for the first time a quantitative, time‐resolved analysis of Pt electrode dissolution during a classical but very relevant electro‐organic synthetic reaction, the Kolbe electrolysis. While different electrode materials have been applied for the Kolbe electrolysis, it has been shown that the application of Pt increases the radical density at the electrode surface and favors the dimerized Kolbe product. [5] Generally, Pt, despite its high costs, is widely applied for electro‐organic synthesis reactions as electrocatalyst but also as inert electrode material. [6]
The Kolbe electrolysis has recently attracted renewed attention as a promising strategy for converting biomass‐based molecules into renewable fuels and as a green synthetic methodology to achieve value‐added chemicals.[ 5 , 7 ] One of the most commonly used solvents for Kolbe electrolysis is methanol. [8] The Kolbe electrolysis is usually performed at slightly acidic pH, and an adequate conductivity of the solution is achieved upon partial neutralization of the acid with an appropriate base (1–10 %). Different foreign ions have a detrimental effect on the synthesis process and the product scope, except for tetraalkylammonium and alkali metal ions. Therefore, the most frequently used bases for the neutralization process are simple alkali metal hydroxides or triethylamine (NEt3). [8] Here, we show the effect of reaction conditions on the stability of Pt electrodes in a methanol‐based electrolyte using two different bases, that is, LiOH and NEt3, and acetic acid as a model system.
We not only monitor the stability of the electrode but also analyze reaction products in parallel, demonstrating the successful run of the reaction. An electroanalytical flow cell (EFC) coupled with an inductively coupled plasma mass spectrometer (ICP‐MS) [9] and an online electrochemical mass spectrometer (OLEMS) were used for real‐time analysis of simultaneous electrode dissolution and product formation. This new approach brings us further in revealing the importance of electrode stability by showing electrode dissolution with unprecedented temporal and potential resolution and understanding the role of surface oxide formation on Pt during the reaction.
Results and Discussion
Comparison of different electrolytes
First, Pt dissolution was measured in methanol containing LiOH or NEt3 during Kolbe electrolysis of acetic acid. In the course of neutralization of acetic acid with LiOH, one equivalent of water is released, which can significantly influence the reaction as well as the electrode dissolution behavior.[ 9c , 10 ] Compared to this water‐containing system, the system with NEt3 base is practically water‐free. Hence, an additional electrolyte system with 1 mol L−1 acetic acid, 0.1 mol L−1 NEt3 containing 0.1 mol L−1 H2O was also tested to pay heed to the effect of water. We conducted chronoamperometric measurements in the EFC at three different anodic potentials: 1, 2, and 3 V [all potentials are referred to the ferrocene/ferrocenium (Fc/Fc+) couple in this paper] in all three electrolytes. Substantial product formation in all three electrolytes was observed first at 3 V. Figure 1a shows the measurement results at an applied potential of 3 V for 3 min (for the other experiments, see the Supporting Information). The first two rows are the electrochemical data, and the subsequent rows show the simultaneously detected Pt dissolution and formed volatile products, respectively. The m/z=27 value belongs to the Kolbe product C2H6, formed from acetic acid, while m/z=44 represents CO2 as a side product, and m/z=2 corresponds to hydrogen evolution from methanol, water, or acetic acid reduction as the counter reaction. CO2 could also stem from methanol oxidation, but as shown in the Supporting Information, we could unambiguously determine the source of CO2 using 13C‐isotopic labeled acetic acid. The reaction starts instantaneously as the anodic potential is applied. The somewhat later onset of the signals corresponding to C2H6 and CO2 compared to H2 is caused by the delayed permeation of the gases through the degasser membrane. While quantification in terms of concentrations is not trivial, the Kolbe product can be detected in all three electrolytes. Although the current densities are somewhat similar in all three cases, the dissolution of Pt shows remarkable differences. Common in all three cases is the presence of both forms of dissolution. [9a] This observation seems to be independent of the Kolbe electrolysis since the same trend can be observed at the other two applied potentials, too (see the Supporting Information). The total dissolved amounts of Pt at different potentials applying 3 min anodic and subsequent cathodic potential steps are shown in Figure 1b. The measurements were conducted at least three times, and the standard deviation is indicated as error bars in the graph. For the 3 min anodic polarization, Pt dissolution in different electrolytes increases in the order of LiOH<NEt3≤NEt3+H2O. Various reasons can be identified for that trend, and different factors have to be considered in the explanation, separately for the anodic and cathodic dissolution behavior. While anodic dissolution is associated with the direct dissolution of Pt in the form of Pt ions, the presence of a cathodic dissolution feature in the course of the potential step to −0.5 V is a sign for Pt−O formation at positive potentials.
Figure 1.

(a) Kolbe electrolysis in the course of a chronoamperometric measurement at 3 V vs. Fc/Fc+ for 3 min followed by a potential step to −0.5 V vs. Fc/Fc+ for 10 min in methanol containing 1 mol L−1 acetic acid and 0.1 mol L−1 LiOH (left), NEt3 (middle), and NEt3+0.1 mol L−1 H2O (right), respectively. Applied potential (black), measured current density (gray), transient Pt dissolution (orange), H2: m/z=2 (green), C2H6: m/z=27 (red), CO2: m/z=44 (blue). (b) Total dissolved amounts of Pt at the potentials of 1 (blue), 2 (red), and 3 V (green) for a 3 min step followed by 10 min at reductive potentials in LiOH (left), NEt3 (middle), and NEt3+H2O (right).
The first striking observation is that although the LiOH‐based system contains 0.1 mol L−1 H2O, the cathodic dissolution is very comparable to that in the NEt3‐based system, the water content of which is below 100 ppm. This phenomenon contradicts the common logic that higher water contents would cause a higher grade of Pt oxidation, evoking a higher amount of cathodically dissolved Pt. However, there is a fundamental difference in the properties of the two cations found in the systems. Whereas Li+ ions are hydrophilic and keep water bound in their hydration shell, the hydrophobic NEt3H+ cations solvate less water. [11] The differences in the reactivity of hydrated and free water in nonaqueous media are described already in several publications.[ 11 , 12 ] Therefore, even though more water is present in the LiOH‐based electrolyte, it is less reactive at anodic potentials. Moreover, water molecules are transported away with Li+ ions from the positively charged electrode surface during the anodic potential step and cannot oxidize Pt to a much greater extent than the NEt3‐based water‐free electrolyte.
The anodic dissolution profiles of the first two systems contradict the above explanation at first glance. In this case, the increased anodic dissolution in NEt3, despite the presence of more reactive water molecules, can be rationalized by considering the complexing effect of amines towards Pt. [13] The effect is similar to that found in aqueous electrolytes containing halide anions.
Finally, it seems that for the water‐containing NEt3 case, the anodic dissolution is only slightly lower but decreases faster, and cathodic dissolution increases, which leads to similar total dissolution values compared to the water‐free system. Although the concentration of water is the same in both systems, the lower cathodic dissolution for the Li+‐containing system compared to the NEt3‐containing system results from the different hydration properties of Li+ and NEt3H+ ions, as explained above. It is also worth mentioning that the dissolution increases in all electrolyte systems significantly from 1 V, at which potential only solvent oxidation occurs, to 2 V, at which potential Kolbe electrolysis commences. However, the dissolution does not increase significantly when 3 instead of 2 V is applied, even though more product formation is observed at higher potentials (see Figure 1b and the Supporting Information). This observation suggests that an increased radical concentration at the electrode surface has only a minor influence on the electrode dissolution rate. Unfortunately, the presented setup does not allow for the quantification of products and therefore the calculation of coulombic efficiencies (CE). The correlation of CE and electrode dissolution could be an important parameter for organic electrochemists to assess the economic feasibility of their reactions, but this would require an even more complex setup, which is the subject of further developments and investigations.
Influence of electrolysis time
Even though the dissolution rate is in the order of some 100 pg s−1 cm−2 during the electrolysis, which might seem to be negligibly low, in long‐term electrolysis, the direct material loss can also accumulate to a more substantial value using electrodes of some 100 cm2 size. This could cause severe performance degradation, counter electrode modification, and product contamination. To estimate the dissolved amount, we have conducted chronoamperometric (CA) measurements at a constant anodic potential for different times in the water‐containing and water‐free NEt3‐based electrolytes. The results are shown in Figure 2. The anodic dissolution in the water‐containing system is somewhat suppressed compared to the water‐free system and converges in both cases to a stable value after a transient signal. This feature is especially well observable as the electrolysis time increases. Therefore, to be able to estimate the total dissolved amount after longer electrolysis times, the rate of the anodic dissolution curve after the transient signal gives a more realistic estimation than a simple linear fit of data points in Figure 2c (see the Supporting Information). Especially since longer electrolysis times are more realistic in real applications, the contribution of initial transient dissolution diminishes. The stable value lies at around 90 pg s−1 cm−2 in the water‐free system. That means in the case of electrolysis over one day using an electrode with a surface area of 1 m2 results in the dissolution of 77.8 mg Pt. Over one year, this accumulates to about 28.4 g, which is 13.3 % of the mass of a 10 μm thick electrode. From the results, we can also see that water has a beneficial effect on Pt dissolution. In the water‐containing electrolyte, the material loss accumulates to 8.1 % in the above example. As mentioned in the introduction, aside from the material loss, secondary effects might interfere with the desired reaction. Considering a lab‐scale electrolysis in a 3 mL solution using a Pt electrode with 1 cm2 electrode area, the 90 pg s−1 cm−2 Pt dissolution rate in the anhydrous electrolyte would result in a 0.55 μmol L−1 Pt ion concentration after 1 h, which could result in an unknown and unwanted homogenous catalytic effect.
Figure 2.

Kolbe electrolysis in the course of chronoamperometric measurements at 3 V vs. Fc/Fc+ for varying anodic polarization times (10, 5, 3, 1 min) followed by a potential step to −0.5 V vs. Fc/Fc+ for 10 min in methanol containing 1 mol L−1 acetic acid and (a) NEt3 and (b) NEt3+0.1 mol L−1 H2O, respectively. Applied potential (black), measured current density (gray), transient Pt dissolution (orange), H2: m/z=2(green), C2H6: m/z=27 (red), CO2: m/z=44 (blue). (c) Total dissolved amounts of Pt as the function of the duration of the anodic potential step at 3 V.
The dissolution curves corresponding to the series of electrolysis steps carried out for different duration show that the extent of cathodic dissolution is independent of the length of time spent at the anodic potential. In addition, this phenomenon is independent of the presence of water in low or high concentration in the system. This observation completely contradicts the behavior of aqueous systems, in which the extent of cathodic dissolution strongly depends on the time spent at anodic potentials, where oxide and subsurface oxide formation take place. [14] The occurrence of oxide formation is evidenced by the cathodic dissolution; however, its independency from the electrolysis time suggests that the surface is protected from extensive oxide formation during the reaction.
Electrode dissolution during cyclic voltammetry
In order to go deeper into the mechanistic details of the processes, we have carried out potentiodynamic measurements with the abovementioned three electrolyte systems and isotopically labeled acetic acid (see also the Supporting Information).
Figure 3 shows cyclic voltammetry (CV) measurements together with the simultaneously detected dissolution and product formation curves as a function of time. The three columns represent the situations with the different bases added to acetic acid in the methanol‐based electrolyte. The potential was cycled between −0.5 and 3 V with a scan rate of 10 mV s−1. In systems with 0.1 mol L−1 water present (LiOH and NEt3+H2O), the onset of oxidation current is shifted to more negative potentials by 300 mV. As obvious from the mass spectrometric signals of C2H6 and CO2, this first oxidation process does not correspond to the Kolbe electrolysis but is characteristic for the oxidation of the solvent methanol. The shift in the onset of the methanol oxidation reaction (MOR) could be explained by the increasing availability of OH− species at the surface, which are known to be essential for methanol oxidation in aqueous media. [15] Note that the methanol oxidation at such low water concentration does not result in the formation of CO2 even at higher potentials, as evidenced from measurements with isotopic labeled acetic acid (see Figure S5). Additionally, a peak in LiOH and a shoulder in the NEt3+H2O containing reaction mixture appear in the current and the H2 signal. The decreasing current in the range of 1.5–2 V shows the decreasing rate of MOR and is associated with the formation of a protective Pt−O layer, which is less active than Pt for MOR. The observations in the H2 evolution curve are analogous to the change of the current curve since it is the counter reaction for methanol oxidation and at higher potentials for the Kolbe electrolysis. The Kolbe product formation occurs around 1.8 V for all electrolytes, independent of the water concentration in the electrolyte. This is contrary to previous observations based on pure electrochemical measurements. [16]
Figure 3.

CVs recorded between −0.5 and 3 V vs. Fc/Fc+ in methanol containing 1 mol L−1 acetic acid and 0.1 mol L−1 LiOH (left), 0.1 mol L−1 NEt3 (middle), 0.1 mol L−1 NEt3+0.1 mol L−1 H2O (right) with a scan rate of 10 mV s−1. Applied potential (black), measured current density (gray), transient Pt dissolution (orange), H2: m/z 2(green), C2H6: m/z 27 (red), CO2: m/z 44 (blue). The potential values in the graph refer to the onset potentials of the Pt dissolution, the Kolbe product formation, and the Pt dissolution associated with Pt−O species, respectively.
Pt dissolution for the system containing NEt3 starts at around 0.8 V, approximately 400 mV more negative than for the system containing LiOH. Since NEt3 is a weaker base (pK B=2.99) than LiOH (pK B=0.18), both species NEt3H+ and NEt3 exist. The complexation properties of NEt3 could be the reason for the increased Pt dissolution at lower potentials. [13] The addition of water to the NEt3 system does not limit the anodic Pt dissolution significantly, probably because of the stronger Pt−NEt3 interaction compared to Pt−H2O interaction. However, the expected increased cathodic Pt dissolution associated with the reduction of Pt−O can be observed. The onset of the oxide reduction, which is expressed as cathodic dissolution in the analysis, is shifted around 600 mV to negative potentials compared to pure methanol. [9c] We speculate that the substituted oxide layer, as described by Conway and Vijh, [16] is the reason for this shift. The strongly adsorbed CH3COO species stabilize the underlying oxide. Only after their removal by the negative potential excursion, the reduction of oxide becomes possible. This mechanistic observation is summarized in the Table of Contents graphic.
The method was also applied during galvanostatic measurements at 5, 10, 15, and 20 mA cm−2 in methanol containing 1 mol L−1 acetic acid and 0.1 mol L−1 LiOH to illustrate the electrode dissolution behavior under galvanostatic conditions. For details, we refer to the Supporting Information.
Conclusions
We have described the simultaneous, time‐ and potential‐resolved electrode dissolution and gaseous product monitoring with a high resolution during the Kolbe synthesis reaction. We have shown the crucial effect of base and water addition on the stability of the electrodes. Furthermore, with the help of our approach, we unveiled hitherto unknown features of the reaction, especially with regard to dissolution mechanisms. We have demonstrated that the detected amounts of dissolved platinum are significant and might affect the technical implementation of the electrosynthesis reaction. With that, we want to emphasize the importance of such investigations for similar reactions in the future, utilizing other, in some cases, more reactive metals with respect to dissolution. Even at relatively high water concentrations, Pt is protected from the continuous formation of oxide by an adsorbed layer. This observation is evidenced by the cathodic dissolution independent of the time of previous anodic polarization. It is also very possible that this same adsorbed layer prohibits the reduction of Pt−O that is reflected in a highly shifted onset of cathodic dissolution during cyclic voltammetry measurements.
Experimental Section
Chemicals and materials
The electrolytes were prepared from methanol (max. water content 0.003 %, SeccoSolv, Merck), acetic acid (≥99 %, HiPerSolv CHROMANORM, VWR Chemicals), anhydrous LiOH (98 %, Alfa Aesar), NEt3 (99 %, Alfa Aesar), and ultrapure water (18 MΩ cm) from a Milli‐Q IQ 7000 system (Merck). All chemicals were used as received without further purification. The water content of the used electrolytes was measured using a Karl Fischer 917 Coulometer (Metrohm). All electrolytes were prepared and the water content was determined in an Ar‐filled glovebox (MBraun), where H2O and O2 contents were kept below 0.1 ppm. Determined water contents of electrolytes: methanol containing 1 mol L−1 acetic acid and 0.1 mol L−1 base: LiOH: 2275 ppm, NEt3: 65 ppm, NEt3 and 0.1 mol L−1 H2O: 2305 ppm.
Measurement setup
The details of the homemade EFC coupled with a Nexion 2000 ICP‐MS (PerkinElmer) setup for on‐line electrode stability investigations in nonaqueous media were previously described. [9a] For the on‐line stability investigation of electrode materials during electrosynthesis, a homemade degasser was added between the outlet of the EFC and the ICP‐MS for product formation control (see Figure 4). The degasser consisted of a Silastic membrane mounted in a Swagelok T‐piece with two short fused silica pieces at the inlet and outlet of the T‐piece inserted into the membrane tube and short pieces of flexible tubing connecting the degasser with the outlet of the EFC and the inlet of the ICP‐MS. The stainless‐steel capillary (Vici Jour) that connected the degasser with the MS was 1.2 m long and had an inner diameter of 0.18 mm. The capillary was heated to 150 °C to prevent condensation of products in the capillary. The size of the capillary was optimized to the pumping rate of the turbomolecular pump of the MS. The measured capillary vacuum was p c=7×10⁻⁴ mbar, and the vacuum in the analyzer chamber was p ac=5×10⁻⁸ mbar.
Figure 4.

Measurement setup for on‐line monitoring of electrode dissolution and simultaneous gaseous product detection during electrosynthesis reactions.
The electrolyte was pumped through the EFC with a flow rate of 150 μL min−1 using a syringe pump (Legato® 100, KD Scientific Inc.). The working electrode, polycrystalline Pt (99.99 %, MaTeK), was polished prior to measurements using 0.3 μm Al2O3 paste on a MD‐Mol polishing cloth (Struers). A glassy carbon rod (HTW Hochtemperatur‐Werkstoffe GmbH) was used as a counter electrode (CE) and positioned upstream of the working electrode to prevent Pt ion redeposition on the CE. As reference electrode (RE), a homemade leakage‐free RE (cell body purchased from Innovative Instruments, Inc.) was prepared by immersing an Ag wire in methanol containing 0.1 mol L−1 tetrabutylammonium perchlorate and 0.01 mol L−1 AgNO3.
Electrochemical measurements
All electrochemical measurements were conducted using a VSP 300 potentiostat (BioLogic). Prior to measurements in the EFC, the homemade reference electrode was calibrated against the Fc/Fc+ couple in a glass cell using the same electrode materials and electrolytes. Before the measurements, the internal resistance in the EFC was determined with electrochemical impedance measurements. Resistance varied between 40 and 200 Ω depending on the conductivity of the electrolyte system and the exact electrode position. 85 % of the determined internal resistance was compensated for during the measurement using the manual internal compensation mode of the potentiostat. No post‐measurement compensation was performed. Before recording measurements, 40 cleaning cycles were performed with a scan rate of 200 mV s−1 between −0.5 and 3 V.
ICP‐MS measurement conditions
ICP‐MS measurement conditions for methanol‐based electrolytes were previously described in detail. [9a] For calibration of the ICP‐MS, calibration standards in the electrolyte matrix with concentrations of 0.5, 1, and 5 μg L−1 were prepared from H2PtCl6 in HCl 7 % (Certipur, Merck). The internal standard (10 μg L−1 Re in ethanol) was prepared from (NH4)ReO4 in water (Certipur, Merck).
OLEMS
A QMG 700 quadrupole mass spectrometer (Q‐MS) (Pfeiffer Vacuum, Asslar) was equipped with an electron ionization (EI) ion source (ionization voltage set to 70 V) and a secondary electron multiplier (SEM) detector for the gas evolution measurement.
Synchronization of measurements and delay time
To determine the delay time and synchronize the electrochemical measurement with the ICP‐MS and Q‐MS data before each measurement, a potential of 1.5 V was applied for 10 s. At this potential, Pt dissolution and H2 evolution occur. The onset of Pt dissolution and H2 evolution was determined as the time at which the intensity of the ICP‐MS and Q‐MS signals exceeded three times the standard deviation of the background signal. The delay time is the difference between the times of the onsets and the beginning of the potential pulse. The delay times are 60 s for the ICP‐MS and 35 s for the Q‐MS.
Conflict of interest
The authors declare no conflict of interest.
Supporting information
As a service to our authors and readers, this journal provides supporting information supplied by the authors. Such materials are peer reviewed and may be re‐organized for online delivery, but are not copy‐edited or typeset. Technical support issues arising from supporting information (other than missing files) should be addressed to the authors.
Supporting Information
Acknowledgements
This work was funded by the Deutsche Forschungsgemeinschaft (DFG, German Research Foundation) under Germany's Excellence Strategy‐Exzellenzcluster 2186 “The Fuel Science Center” ID: 390919832. The authors thank Jonas Möller for developing a LabVIEW data evaluation software. Open Access funding enabled and organized by Projekt DEAL.
J. Ranninger, P. Nikolaienko, K. J. J. Mayrhofer, B. B. Berkes, ChemSusChem 2022, 15, e202102228.
Contributor Information
Johanna Ranninger, Email: j.ranninger@fz-juelich.de.
Dr. Balázs B. Berkes, Email: b.berkes@fz-juelich.de.
References
- 1.
- 1a. Frontana-Uribe B. A., Little R. D., Ibanez J. G., Palma A., Vasquez-Medrano R., Green Chem. 2010, 12, 2099–2119; [Google Scholar]
- 1b. Yan M., Kawamata Y., Baran P. S., Chem. Rev. 2017, 117, 13230–13319; [DOI] [PMC free article] [PubMed] [Google Scholar]
- 1c. Mohle S., Zirbes M., Rodrigo E., Gieshoff T., Wiebe A., Waldvogel S. R., Angew. Chem. Int. Ed. 2018, 57, 6018–6041; [DOI] [PMC free article] [PubMed] [Google Scholar]; Angew. Chem. 2018, 130, 6124–6149; [Google Scholar]
- 1d. Yuan Y., Lei A., Nat. Commun. 2020, 11, 802. [DOI] [PMC free article] [PubMed] [Google Scholar]
- 2.
- 2a. Neubert K., Schmidt M., Harnisch F., ChemSusChem 2021, 14, 3097–3109; [DOI] [PMC free article] [PubMed] [Google Scholar]
- 2b. Gütz C., Selt M., Bänziger M., Bucher C., Römelt C., Hecken N., Gallou F., Galvão T. R., Waldvogel S. R., Chem. Eur. J. 2015, 21, 13878–13882. [DOI] [PubMed] [Google Scholar]
- 3.
- 3a. Wandt J., Freiberg A., Thomas R., Gorlin Y., Siebel A., Jung R., Gasteiger H. A., Tromp M., J. Mater. Chem. A 2016, 4, 18300–18305; [Google Scholar]
- 3b. Lopes P. P., Zorko M., Hawthorne K. L., Connell J. G., Ingram B. J., Strmcnik D., Stamenkovic V. R., Markovic N. M., J. Phys. Chem. Lett. 2018, 9, 4935–4940; [DOI] [PubMed] [Google Scholar]
- 3c. Wachs S. J., Behling C., Ranninger J., Möller J., Mayrhofer K. J. J., Berkes B. B., ACS Appl. Mater. Interfaces 2021, 13, 33075–33082. [DOI] [PubMed] [Google Scholar]
- 4.
- 4a. Cherevko S., Keeley G. P., Geiger S., Zeradjanin A. R., Hodnik N., Kulyk N., Mayrhofer K. J., ChemElectroChem 2015, 2, 1471–1478; [DOI] [PMC free article] [PubMed] [Google Scholar]
- 4b. Sandbeck D. J. S., Secher N. M., Speck F. D., Sørensen J. E., Kibsgaard J., Chorkendorff I., Cherevko S., ACS Catal. 2020, 10, 6281–6290. [Google Scholar]
- 5. Sbei N., Aslam S., Ahmed N., React. Chem. Eng. 2021, 6, 1342–1366. [Google Scholar]
- 6. Heard D. M., Lennox A. J. J., Angew. Chem. Int. Ed. 2020, 59, 18866–18884; [DOI] [PMC free article] [PubMed] [Google Scholar]; Angew. Chem. 2020, 132, 19026–19044. [Google Scholar]
- 7.
- 7a. Holzhäuser F. J., Mensah J. B., Palkovits R., Green Chem. 2020, 22, 286–301; [Google Scholar]
- 7b. Klüh D., Waldmüller W., Gaderer M., Clean Technol. 2021, 3, 1–18. [Google Scholar]
- 8. Schäfer H. J., in Comprehensive Organic Synthesis, Vol. 3, 1991, pp. 633–658. [Google Scholar]
- 9.
- 9a. Ranninger J., Wachs S. J., Möller J., Mayrhofer K. J. J., Berkes B. B., Electrochem. Commun. 2020, 114, 106702; [Google Scholar]
- 9b. Ranninger J., Nikolaienko P., Wachs S. J., Möller J., Mayrhofer K. J. J., Berkes B. B., J. Electrochem. Soc. 2020, 167, 121507; [Google Scholar]
- 9c. Ranninger J., Mayrhofer K. J. J., Berkes B. B., J. Phys. Chem. C 2021, 125, 13254–13263. [Google Scholar]
- 10. Staszak-Jirkovský J., Subbaraman R., Strmcnik D., Harrison K. L., Diesendruck C. E., Assary R., Frank O., Kobr L., Wiberg G. K. H., Genorio B., Connell J. G., Lopes P. P., Stamenkovic V. R., Curtiss L., Moore J. S., Zavadil K. R., Markovic N. M., ACS Catal. 2015, 5, 6600–6607. [Google Scholar]
- 11.
- 11a. Dubouis N., Serva A., Salager E., Deschamps M., Salanne M., Grimaud A., J. Phys. Chem. Lett. 2018, 9, 6683–6688; [DOI] [PubMed] [Google Scholar]
- 11b. Dubouis N., Serva A., Berthin R., Jeanmairet G., Porcheron B., Salager E., Salanne M., Grimaud A., Nat. Catal. 2020, 3, 656–663. [Google Scholar]
- 12. Suarez-Herrera M. F., Costa-Figueiredo M., Feliu J. M., Langmuir 2012, 28, 5286–5294. [DOI] [PubMed] [Google Scholar]
- 13. Kalinowska-Lis U., Ochocki J., Matlawska-Wasowska K., Coord. Chem. Rev. 2008, 252, 1328–1345. [Google Scholar]
- 14. Topalov A. A., Cherevko S., Zeradjanin A. R., Meier J. C., Katsounaros I., Mayrhofer K. J. J., Chem. Sci. 2014, 5, 631–638. [Google Scholar]
- 15. Romano R. L., Oliveira M. G., Varela H., J. Electrochem. Soc. 2020, 167, 046506. [Google Scholar]
- 16. Conway B. E., Vijh A. K., J. Phys. Chem. 1967, 71, 3637–3654. [Google Scholar]
Associated Data
This section collects any data citations, data availability statements, or supplementary materials included in this article.
Supplementary Materials
As a service to our authors and readers, this journal provides supporting information supplied by the authors. Such materials are peer reviewed and may be re‐organized for online delivery, but are not copy‐edited or typeset. Technical support issues arising from supporting information (other than missing files) should be addressed to the authors.
Supporting Information