

Abstract
Background and objectives
Metformin is used to treat gestational diabetes. It is also used to treat women with polycystic ovary syndrome and has been shown to prevent late miscarriage and preterm birth. However, increased renal clearance during pregnancy causes a decline in serum concentrations of metformin. The aim of this study was to explore the time course of the pregnancy‐related changes in metformin pharmacokinetics and the return to the non‐pregnant state.
Method
A subgroup of women in the PregMet2 study (n = 73) agreed to provide serum samples at three time‐points in pregnancy (gestational weeks 19, 28 and 32) and once in post partum, (either 2, 4 or 8 weeks after delivery). Serum metformin concentrations were compared using a four‐parameter logistic model.
Findings
The mean steady‐state serum concentration of metformin during pregnancy was 9.39 μmoL/L, whereas the post partum concentration was 12.36 μmoL/L, an increase of 32% (p = 0,019). This change took place already during the first 2 weeks post partum.
Conclusion
Clinicians who treat pregnant women with metformin should be aware of the significant decrease in metformin concentration mediated by pregnancy, and the rapid increase after delivery, as it may impact both the therapeutic efficacy and the risk of adverse drug reactions.
Keywords: metformin, pharmacokinetics, polycystic ovary syndrome, post partum, pregnancy
1. BACKGROUND
Metformin is widely used as first choice treatment for type 2 diabetes mellitus (T2DM). It has been considered safe during pregnancy both for women with T2DM and women with gestational diabetes mellitus (GDM). 1 The main anti‐diabetic mechanisms of action of metformin are reduced glucose uptake in the gut, increased peripheral insulin sensitivity, decreased hepatic gluconeogenesis and decreased fat synthesis. Metformin has a mild inhibitory effect on the mitochondrial respiratory complex, resulting in increased adenosine monophosphate (AMP)/adenosine triphosphate ratio mediated by AMP‐activated protein kinase. 2 , 3 , 4
Metformin is also used to treat polycystic ovary syndrome (PCOS), a common endocrine disorder. 5 , 6 , 7 In non‐pregnant women with PCOS, metformin has a mild androgen lowering and ovulation stimulating effect. 8 Women with PCOS have increased risk of pregnancy complications such as GDM, preeclampsia, miscarriage and preterm birth. 9 Pooled data from randomized controlled trials from our research group indicate that metformin treatment during pregnancy reduces the risk of late miscarriage and preterm birth. 10 , 11 Its mechanisms of action in pregnancy are unclear. Surprisingly, in an earlier publication from our study group, 12 as well as in three randomized controlled trials (RCTs) with 800 PCOS participants, metformin had, compared with placebo, no effect on the glucose homeostasis, measured as the incidence of GDM, time of GDM debute, insulin need, insulin resistance or fasting glucose levels. 13 Metformin however, significantly reduced the incidence of late miscarriage, preterm birth and gestational weight gain. 13
The dosage of metformin in studies involving pregnancy has mainly been based on data from non‐pregnant women. Pharmacokinetic data from pregnant women treated with metformin 14 , 15 , 16 , 17 suggest that drug elimination is increased during pregnancy, leading to a lower plasma concentration compared with the non‐pregnant state. Thus, there is a possibility that a higher dosage of metformin would be needed to achieve the desired plasma levels during pregnancy.
Two studies from Brazil 14 , 15 report on metformin pharmacokinetics in the third trimester of pregnancy in eight women with PCOS and nine women with T2DM and compared the findings with data from non‐pregnant controls obtained from the literature. The authors found that oral metformin clearance increased significantly during pregnancy. Another study 16 followed seven women longitudinally and found that the mean peak serum metformin concentration in the third trimester was 81% of the concentration 8 weeks post partum. This decrease supported the authors' hypothesis of a 40–50% increase in renal metformin clearance, caused by the known pregnancy‐associated increase in glomerular filtration rate (GFR). Based on results from 35 women, another study 17 reported that the mean serum metformin concentration during late pregnancy was 71% of the concentration 3 months post partum, with a corresponding 31% higher renal clearance during late pregnancy. However, it should be noted that none of these four studies 14 , 15 , 16 , 17 present data from early post partum, that is, before 8 weeks after delivery.
As the dynamics of the changes in metformin plasma concentrations in the early post partum period is not known, the aim of the present study was to explore the time course of the changes in metformin pharmacokinetics during the first weeks after delivery.
2. MATERIALS AND METHODS
The study was conducted in accordance with the Basic & Clinical Pharmacology & Toxicology policy for experimental and clinical studies. 18
2.1. Participants and sampling
The participants in this study were recruited among the local participants in the PregMet2 study. The PregMet2 study 13 was a randomized, double‐blinded, placebo‐controlled, Nordic multicenter trial on metformin treatment of pregnant women with PCOS. The study was registered with ClinicalTrials.gov, number NCT01587378, and EudraCT, number 2011–002203‐15. Inclusion and exclusion criteria as well as the main results from this study are published elsewhere. 13 Women with PCOS were randomized to either metformin 1000 mg twice daily or placebo.
Of the 127 participants recruited to the PregMet2 study at St. Olav's Hospital in Trondheim, 73 gave written informed consent to participate in the present sub‐study. During pregnancy, blood samples were obtained in gestational weeks 19, 28 and 32 (Figure 1). Specimens were included only when the women reported regular drug intake and the blood samples were obtained between one and 6 h after last tablet intake.
FIGURE 1.
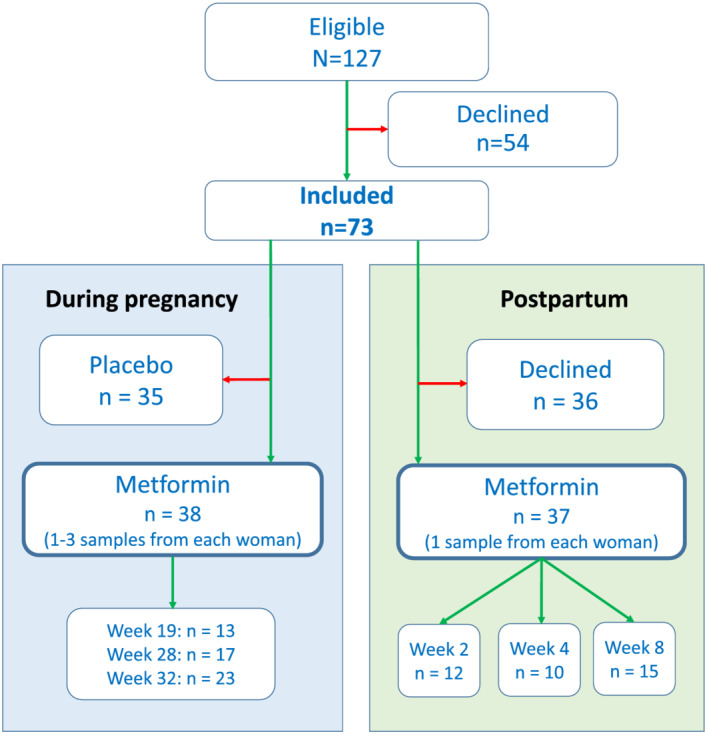
Flow diagram illustrating the inclusion and exclusion of patients
In the post partum period, the women were randomized for sampling at 2, 4 or 8 weeks after delivery (Figure 1). They ingested 1000 mg metformin 28, 16 and 4 h before blood sampling. Given the plasma elimination half‐life of metformin of 4–5 h, 19 this was considered sufficient to achieve steady‐state conditions.
The study was approved by the Regional Committee for Health Research Ethics of Central Norway (approval No. 2011/1434).
2.2. Analysis of metformin
After sampling, blood was allowed to coagulate. Following centrifugation, serum was pipetted off and stored frozen at −80°C until analysis. At the day of analysis, samples were thawed to room temperature and during preparation handled with a pipetting robot. Six levels of calibrators (ranging from 0.20 to 40 μmoL/L), three quality control samples (0.40, 10 and 30 μmoL/L) and patient samples were transferred to a 96‐well plate in aliquots of 100 μL. Subsequently, 25 μL of the internal standard solution (1.0 μg/mL metformin‐d6 in methanol/water (20%, v:v) was added. For protein precipitation 300 μL of ice‐cold acetonitrile with formic acid (1%, v:v) was added. The wells were then sealed with aluminium foil and mixed followed by centrifugation at 4600 rpm for 4 min. The plate was then stored in a freezer at −20°C for 30 min before 150 μL of the supernatant was transferred to another 96‐well plate.
A volume of 1 μL prepared sample was injected onto the analytical instrument. The instrumental detection was performed by an Agilent 1290 ultra‐high performance liquid chromatography system coupled to an Agilent 6550 quadrupole time‐of‐flight mass spectrometer (QTOF‐MS) (Agilent, Santa Clara, CA, USA). Chromatographic separation was performed on an Acquity UPLC HSS T3 column (150 mm × 2.1 mm, 1.8 μm) (Waters, Milford, MA, USA) with the two mobile phases 0.025% formic acid in 5‐mM ammonium formate and 0.05% formic acid in acetonitrile.
The QTOF‐MS was operated with positive ionization in full scan MS mode alternating between low and high collision energies. Acquired data were processed with the MassHunter Quantitative Analysis QTOF software B.07. Protonated metformin (m/z 130.1087) and metformin‐d6 (m/z 136.1464) from the low energy spectra with a mass accuracy tolerance of ± 6 parts per million were used for quantification. The presence of a metformin fragment ion (m/z 71.0604) in high collision energy spectra, co‐eluting with the precursor, was used for identification in addition to retention time and mass accuracy.
Limit of quantification was estimated to 0.20 μmoL/L. Within‐ and between‐series precisions were below a coefficient of variation (CV) of 4.0% at both low (0.20 μmoL/L) and high (30 μmoL/L) concentrations. Bias was −4.2% and −2.6% at low and high concentrations, respectively. No signs of degradation of metformin were observed after storage in test tubes for 4 weeks at 4–8°C and 4 days at 30°C.
2.3. Pharmacokinetic and statistical procedures
The measured serum metformin concentrations obtained 1–6 h after drug ingestion were standardized to 4 h. As this time interval represents the distribution phase of metformin, for which no half‐life is readily available from the literature, the distribution half‐life used for the standardization was calculated as follows: In a recent pharmacokinetic study, the elimination half‐life of oral metformin was 4.2 h. 19 Assuming that the distribution phase also represents transport from plasma to red blood cells, a transport coefficient of 0.044 h−1 20 was added to the elimination coefficient of ln2/4.2 h, 19 leading to a resultant distribution half‐life of 3.3 h. By applying this procedure, concentrations retrieved during pregnancy could be directly compared with those collected post partum, where all samples were obtained 4 h after tablet intake.
We developed two statistical models for the outcome variable serum metformin concentration (in μmol/L). In the first model, we included pregnancy status (pregnant vs non‐pregnant), and the different per protocol‐based time points as categorical predictor variables using a linear mixed model with patient ID as random intercept, using the Stata version 17 mixed procedure. 21
In the second model, the outcome was modelled as a function of gestational length (pregnant) or time after delivery (non‐pregnant) on a continuous time scale, using a four‐parameter logistic model (not to be confused with logistic regression). This model has the following features and parameters: a left asymptote at early pregnancy (before gestational week 20), a right asymptote of non‐pregnancy (beyond 12 weeks post partum), an inflection point where the concentration changes and a scale parameter without direct interpretation. The inflection point was set a priori (not estimated from the present data) at the day of birth. 22 Parameters were estimated using the method of restricted maximum likelihood, employing the Stata version 17 menl procedure for nonlinear mixed effects. 21 The patient identity was included as a random intercept, so individual patients may start and end differently while still exhibiting the general relation described above.
3. RESULTS
The number of women who provided samples at various time points during pregnancy and post partum is shown in Figure 1. Of the 73 women who accepted the invitation, 38 were randomized to metformin and could be included in the pregnancy part of this study, whereas 35 had been randomized to the placebo group. In the post partum part, 37 of the 73 women contributed with samples. Key characteristics of the study participants are presented in Table 1.
TABLE 1.
Baseline characteristics at inclusion and pregnancy complications of women with polycystic ovary syndrome (N = 73)
| Variable | Mean (SD) | Range |
|---|---|---|
| Age (years) | 30.1 (4.6) | 21–40 |
| Body weight (kg) | 79.2 (17.5) | 54–146 |
| Height (cm) | 168.1 (5.8) | 156–188 |
| Body mass index (kg/m2) | 28.0 (6.1) | 20–54 |
| Plasma creatinine (μmoL/L) | 49.6 (6.0) | 36–71 |
| eGFR (mL/min/1.73 m2) | 125.7 (7.2) | 97–144 |
| Systolic blood pressure (mmHg) | 120.2 (9.5) | 95–146 |
| Diastolic blood pressure (mmHg) | 76.7 (7.7) | 56–103 |
| Ethnicity (Caucasian/other) | 72/1 | |
| Parity (0/1/2/3) | 44/25/3/1 |
| Pregnancy complications | No. (%) | |
|---|---|---|
| Pregnancy‐induced hypertension | 5 (6.9) | |
| Gestational diabetes mellitus | 12 (16.4) | |
| Preeclampsia | 4 (5.5) |
Mean metformin serum concentrations at the various pre‐defined sampling time points are shown in Table 2. Mean concentrations varied between 8.24 and 9.96 μmoL/L during pregnancy and between 11.95 and 12.76 μmoL/L post partum. According to the linear mixed model (the first model), being in the post partum period adds an average of 2.92 μmoL/L (+ 30%) to the serum metformin concentration during pregnancy (p = 0.019).
TABLE 2.
Metformin concentrations (mean ± standard deviation) during pregnancy and post partum
| Number of samples | Metformin concentration (μmol/L) | |
|---|---|---|
| Gestational week 19 | 13 | 9.87 ± 2.52 |
| Gestational week 28 | 17 | 8.24 ± 2.81 |
| Gestational week 32 | 23 | 9.96 ± 2.99 |
| Week 2 post partum | 12 | 11.95 ± 2.64 |
| Week 4 post partum | 10 | 12.24 ± 4.50 |
| Week 8 post partum | 15 | 12.76 ± 3.83 |
Individual concentrations of metformin during pregnancy and in the post partum period are shown in Figure 2. The asymptotes from the four‐parameter logistic model (the second model) are superimposed on the observations. The left asymptote (mid‐pregnant) was estimated to 9.18 μmoL/L and the right asymptote (non‐pregnant) to 13.24 μmoL/L. The random effects (i.e. patient individual intercepts) were estimated with standard deviations (SD) of 1.25 and the residuals with a SD of 3.08. This yields a relatively low intraclass correlation of 0.14 between observations of the same patient.
FIGURE 2.

Plot showing individual metformin concentrations during pregnancy and in the post partum period. Each dot represents a single measurement, corrected for time of ingestion. The lines represents mean metformin concentration (with 95% confidence interval) as a function of gestational length, according to a four‐parameter mixed logistic model with the inflection point set at 0 (i.e. birth). The left asymptote (mid‐pregnant) is 9.18 μmoL/L, and the right asymptote (non‐pregnant) is 13.24 μmoL/L. GW = gestational week, WPP = weeks post partum
4. DISCUSSION
The main finding of the present study is that concentrations of metformin during pregnancy were 76% of the concentrations in non‐pregnant state. The return to non‐pregnant state took place during the first 2 weeks post partum.
In previous studies, 14 , 15 , 16 , 17 serum metformin concentrations during pregnancy have ranged between 60% and 80% of those measured 8 weeks or more post partum. Our finding of a mean concentration of 76% during pregnancy compared with post partum is clearly consistent with the data from those previous studies. Notably, the concentrations in our study reached non‐pregnant values already during the first 2 weeks post partum.
As metformin is not metabolized in humans and is not bound to plasma proteins to a significant extent, 23 , 24 the lower metformin concentrations during pregnancy are believed to be primarily caused by increased renal elimination. A review article from 2016 25 describes increased GFR already in the first trimester, with a peak at mid‐pregnancy with an average increase of 37–45% compared with before pregnancy, and a decline during the last few weeks of pregnancy. Similar findings were demonstrated in a systematic review and meta‐analysis from 2019, 26 with a gradual and significant rise in GFR during the first two trimesters, an apparent peak around gestational weeks 28–32 and a modest decrease towards the end of pregnancy.
As the mechanisms of action of metformin to reduce late miscarriage and preterm deliveries in PCOS are unclear, we can only speculate on the optimal plasma concentrations in pregnancy. It seems, however, likely that the effect in PCOS, in contrast to in T2DM, is mediated predominantly via systemic drug absorption rather than via local effects in the gut. Theoretically, PCOS severity may also be a factor taken into account for metformin dosage. PCOS severity is a difficult concept, as the condition is multifactorial and studies on how different PCOS phenotypes affect pregnancy complications are contradicting. 27 , 28 , 29 As we could demonstrate favourable effects of metformin on gestational weight gain and miscarriage/preterm delivery incidence in the pooled data of three RCTs, 13 we believe that despite of reduced serum concentrations the metformin dosage was sufficient.
Although GFR is held to be the main pathway for renal clearance of metformin, tubular excretion via transport proteins such as organic cation transporters, multidrug and toxin extrusion transporters and, to a lesser extent, the plasma membrane monoamine transporter seem to contribute to its elimination. 23 Some authors have suggested that there is an increased tubular secretion of metformin during pregnancy, 17 , 30 but the extent to which the activities of the renal tubular transport proteins in general are changed during pregnancy remains unclear. 25 The total clearance of metformin is about 500 mL/min, 23 which is considerably higher than the GFR. Thus, we can assume that tubular excretion accounts for a significant part of the total clearance of metformin. This is further substantiated by the fact that drugs that inhibit renal tubular secretion without changing GFR, such as trimetoprim and abemaciclib, reduce renal clearance of metformin. 31 , 32 The increase in GFR during pregnancy has been estimated to 45%, 25 which corresponds to a 31% decrease in the plasma concentration. As the decrease in metformin concentration during pregnancy in the present study was 25%, we cannot confirm that the tubular excretion of metformin is increased during pregnancy.
It should also be taken into account that some data indicate that the oral bioavailability of metformin increases during pregnancy, thereby counteracting the decrease in plasma concentrations that would have been excepted on the basis of the increased clearance alone. 30 In order to elucidate this effect further, studies including intravenous administration of metformin should be performed.
This study has some weaknesses, but also some strengths, that should be acknowledged. The strengths of this study are the randomized placebo‐controlled design and the longitudinal, multiple sampling strategy during pregnancy and post partum. Although it is generally assumed that drug adherence is reduced in pregnancy, the women in our study participated in a clinical trial investigating the positive effects of metformin during pregnancy. They were asked about drug intake before sampling, and samples were excluded if any irregularities were revealed or suspected. Thus, it seems unlikely that reduced drug adherence during pregnancy has contributed to the lower metformin concentrations measured.
A potential limitation of this study is that the time interval from last tablet intake to sampling was not possible to standardize during pregnancy for practical reasons. We therefore calculated these time intervals carefully, excluded samples obtained outside the 1‐ to 6‐h interval, and used pharmacokinetic modelling to standardize the remaining concentrations to a 4‐h interval, which was identical to the interval used in the post partum samplings. This procedure may have introduced some uncertainty related to the precision of individual pregnancy concentrations. However, as our key findings regarding the difference between concentrations during pregnancy and post partum are the same as in previous studies, it seems unlikely that this procedure has introduced any systematic bias.
Another limitation to be mentioned is that we did not collect samples during the last weeks of pregnancy or during the first 2 weeks post partum. Therefore, we cannot exclude possibility that the metformin concentrations started to increase already before delivery. On the other hand, based on previous studies, 33 , 34 this seems unlikely. Samples obtained before the 2‐week interval after delivery would have allowed us to describe the post partum pharmacokinetic changes in even more detail. Moreover, by collecting urinary samples, we would have been able to provide a deeper understanding of the pharmacokinetic changes taking place.
In conclusion, we have shown that the lower serum metformin concentrations during pregnancy increased to non‐pregnant levels as early as 2 weeks after delivery. Further studies are needed to elucidate whether the decrease in metformin concentration during pregnancy and the rapid increase after delivery may affect its therapeutic efficacy and the risk of adverse drug reactions.
CONFLICTS OF INTEREST
None of the authors has conflicting or competing interests to declare.
ETHICS APPROVAL
The study was approved by the Regional Committee for Health Research Ethics of Central Norway (approval No. 2011/1434).
CONSENT TO PARTICIPATE
Of the 127 participants recruited to the PregMet2 study at St. Olav's Hospital in Trondheim, 73 gave written informed consent to participate in the present sub‐study.
ACKNOWLEDGEMENTS
We thank the midwives at The Department of Obstetrics and Gynecology, St. Olav's Hospital for their help in management and care for the patients. We also want to thank the Clinical Research Facility, St. Olav's University Hospital for their assistance, and Biobank1 for the help in storing and administering the blood samples. The study was supported by a research grant from The Clinic of Laboratory Medicine, St. Olav's Hospital. Main funding went through the affiliated institutions' annuum.
Espnes KA, Hønnås A, Løvvik TS, et al. Metformin serum concentrations during pregnancy and post partum – A clinical study in patients with polycystic ovary syndrome. Basic Clin Pharmacol Toxicol. 2022;130(3):415-422. doi: 10.1111/bcpt.13703
[Correction added on 7 February 2022, after first online publication: ORCID ID has been added for authors Arne Hønnås, Tone S. Løvvik, Audhild Naavik, Eirik Skogvoll, Andreas A. Westin, Olav Spigset, and Eszter Vanky.]
Funding information The Clinic of Laboratory Medicine, St. Olav's Hospital
DATA AVAILABILITY STATEMENT
The data that support the findings of this study are available from the corresponding author upon reasonable request.
REFERENCES
- 1. Given JE, Loane M, Garne E, et al. Metformin exposure in first trimester of pregnancy and risk of all or specific congenital anomalies: exploratory case‐control study. BMJ. 2018;361:k2477. Published 2018 Jun 25 doi: 10.1136/bmj.k2477 [DOI] [PMC free article] [PubMed] [Google Scholar]
- 2. Foretz M, Guigas B, Bertrand L, Pollak M, Viollet B. Metformin: from mechanisms of action to therapies. Cell Metab. 2014;20(6):953‐966. doi: 10.1016/j.cmet.2014.09.018 [DOI] [PubMed] [Google Scholar]
- 3. Rena G, Pearson ER, Sakamoto K. Molecular mechanism of action of metformin: old or new insights? Diabetologia. 2013;56(9):1898‐1906. doi: 10.1007/s00125-013-2991-0 [DOI] [PMC free article] [PubMed] [Google Scholar]
- 4. Rittig N, Aagaard NK, Sundelin E, et al. Metformin stimulates intestinal glycolysis and lactate release: a single‐dose study of metformin in patients with intrahepatic portosystemic stent. Clin Pharmacol Ther. 2021;110(5):1329‐1336. doi: 10.1002/cpt.2382 [DOI] [PubMed] [Google Scholar]
- 5. Bozdag G, Mumusoglu S, Zengin D, Karabulut E, Yildiz BO. The prevalence and phenotypic features of polycystic ovary syndrome: a systematic review and meta‐analysis. Hum Reprod. 2016;31(12):2841‐2855. doi: 10.1093/humrep/dew218 [DOI] [PubMed] [Google Scholar]
- 6. March WA, Moore VM, Willson KJ, Phillips DIW, Norman RJ, Davies MJ. The prevalence of polycystic ovary syndrome in a community sample assessed under contrasting diagnostic criteria. Hum Reprod. 2010;25(2):544‐551. doi: 10.1093/humrep/dep399 [DOI] [PubMed] [Google Scholar]
- 7. Eilertsen TB, Vanky E, Carlsen SM. Increased prevalence of diabetes and polycystic ovary syndrome in women with a history of preterm birth: a case‐control study. BJOG. 2012;119(3):266‐275. doi: 10.1111/j.1471-0528.2011.03206.x [DOI] [PubMed] [Google Scholar]
- 8. Patel R, Shah G. Effect of metformin on clinical, metabolic and endocrine outcomes in women with polycystic ovary syndrome: a meta‐analysis of randomized controlled trials. Curr Med Res Opin. 2017;33(9):1545‐1557. doi: 10.1080/03007995.2017.1279597 [DOI] [PubMed] [Google Scholar]
- 9. Yu HF, Chen HS, Rao DP, Gong J. Association between polycystic ovary syndrome and the risk of pregnancy complications: a PRISMA‐compliant systematic review and meta‐analysis. Medicine (Baltimore). 2016;95(51):e4863 doi: 10.1097/MD.0000000000004863 [DOI] [PMC free article] [PubMed] [Google Scholar]
- 10. Vanky E, Salvesen KA, Heimstad R, Fougner KJ, Romundstad P, Carlsen SM. Metformin reduces pregnancy complications without affecting androgen levels in pregnant polycystic ovary women: results of a randomized study. Hum Reprod. 2004;19(8):1734‐1740. doi: 10.1093/humrep/deh347 [DOI] [PubMed] [Google Scholar]
- 11. Vanky E, Stridsklev S, Heimstad R, et al. Metformin versus placebo from first trimester to delivery in polycystic ovary syndrome: a randomized, controlled multicenter study. J Clin Endocrinol Metab. 2010;95(12):E448‐E455. doi: 10.1210/jc.2010-0853 [DOI] [PubMed] [Google Scholar]
- 12. Fougner KJ, Vanky E, Carlsen SM. Metformin has no major effects on glucose homeostasis in pregnant women with PCOS: results of a randomized double‐blind study. Scand J Clin Lab Invest. 2008;68(8):771‐776. doi: 10.1080/00365510802254620 [DOI] [PubMed] [Google Scholar]
- 13. Løvvik TS, Carlsen SM, Salvesen Ø, et al. Use of metformin to treat pregnant women with polycystic ovary syndrome (PregMet2): a randomised, double‐blind, placebo‐controlled trial. Lancet Diabetes Endocrinol. 2019;7(4):256‐266. doi: 10.1016/S2213-8587(19)30002-6 [DOI] [PubMed] [Google Scholar]
- 14. de Oliveira Baraldi C, Lanchote VL, de Jesus Antunes N, et al. Metformin pharmacokinetics in nondiabetic pregnant women with polycystic ovary syndrome. Eur J Clin Pharmacol. 2011;67(10):1027‐1033. doi: 10.1007/s00228-011-1053-0 [DOI] [PubMed] [Google Scholar]
- 15. de Oliveira Baraldi C, Moisés EC, de Jesus Antunes N, Lanchote VL, Duarte G, Cavalli RC. Effect of type 2 diabetes mellitus on the pharmacokinetics of metformin in obese pregnant women. Clin Pharmacokinet. 2012;51(11):743‐749. doi: 10.1007/s40262-012-0008-7 [DOI] [PubMed] [Google Scholar]
- 16. Hughes RCE, Gardiner SJ, Begg EJ, Zhang M. Effect of pregnancy on the pharmacokinetics of metformin. Diabet Med. 2006;23(3):323‐326. doi: 10.1111/j.1464-5491.2005.01769.x [DOI] [PubMed] [Google Scholar]
- 17. Eyal S, Easterling TR, Carr D, et al. Pharmacokinetics of metformin during pregnancy. Drug Metab Dispos. 2010;38(5):833‐840. doi: 10.1124/dmd.109.031245 [DOI] [PMC free article] [PubMed] [Google Scholar]
- 18. https://onlinelibrary.wiley.com/doi/10.1111/bcpt.13492
- 19. Kuhlmann I, Nøddebo Nyrup A, Bjerregaard Stage T, et al. Oral and intravenous pharmacokinetics of metformin with and without oral codeine intake in healthy subjects: a cross‐over study. Clin Transl Sci. 2021;14(6):2408‐2419. doi: 10.1111/cts.13107 [DOI] [PMC free article] [PubMed] [Google Scholar]
- 20. Kurlovics J, Zake DM, Zaharenko L, Berzins K, Klovins J, Stalidzans E. Metformin transport rates between plasma and red blood cells in humans [published online ahead of print, 2021 Jul 26]. Clin Pharmacokinet. 2021; doi: 10.1007/s40262-021-01058-2 [DOI] [PMC free article] [PubMed] [Google Scholar]
- 21. Stata multilevel mixed‐effects reference manual release 17. StataCorp. 2021. Stata:Release 17. Statistical Software. College Station, TX: StataCorp LL.
- 22. Westin AA, Brekke M, Molden E, Skogvoll E, Aadal M, Spigset O. Changes in drug disposition of lithium during pregnancy: a retrospective observational study of patient data from two routine therapeutic drug monitoring services in Norway. BMJ Open. 2017;7(3):e015738. Published 2017 Mar 1 doi: 10.1136/bmjopen-2016-015738 [DOI] [PMC free article] [PubMed] [Google Scholar]
- 23. Graham GG, Punt J, Arora M, et al. Clinical pharmacokinetics of metformin. Clin Pharm. 2011;50(2):81‐98. doi: 10.2165/11534750-000000000-00000 [DOI] [PubMed] [Google Scholar]
- 24. Tucker GT, Casey C, Phillips PJ, Connor H, Ward JD, Woods HF. Metformin kinetics in healthy subjects and in patients with diabetes mellitus. Br J Clin Pharmacol. 1981;12(2):235‐246. doi: 10.1111/j.1365-2125.1981.tb01206.x [DOI] [PMC free article] [PubMed] [Google Scholar]
- 25. Tasnif Y, Morado J, Hebert MF. Pregnancy‐related pharmacokinetic changes. Clin Pharmacol Ther. 2016;100(1):53‐62. doi: 10.1002/cpt.382 [DOI] [PubMed] [Google Scholar]
- 26. Lopes van Balen VA, van Gansewinkel TAG, de Haas S, et al. Maternal kidney function during pregnancy: systematic review and meta‐analysis. Ultrasound Obstet Gynecol. 2019;54(3):297‐307. doi: 10.1002/uog.20137 [DOI] [PMC free article] [PubMed] [Google Scholar]
- 27. de Wilde MA, Lamain‐de Ruiter M, Veltman‐Verhulst SM, et al. Increased rates of complications in singleton pregnancies of women previously diagnosed with polycystic ovary syndrome predominantly in the hyperandrogenic phenotype. Fertil Steril. 2017;108(2):333‐340. doi: 10.1016/j.fertnstert.2017.06.015 [DOI] [PubMed] [Google Scholar]
- 28. Naver KV, Grinsted J, Larsen SO, et al. Increased risk of preterm delivery and pre‐eclampsia in women with polycystic ovary syndrome and hyperandrogenaemia. BJOG. 2014;121(5):575‐581. doi: 10.1111/1471-0528.12558 [DOI] [PubMed] [Google Scholar]
- 29. Mumm H, Jensen DM, Sørensen JA, et al. Hyperandrogenism and phenotypes of polycystic ovary syndrome are not associated with differences in obstetric outcomes. Acta Obstet Gynecol Scand. 2015;94(2):204‐211. doi: 10.1111/aogs.12545 [DOI] [PubMed] [Google Scholar]
- 30. Liao MZ, Nichols SKF, Ahmed M, et al. Effects of pregnancy on the pharmacokinetics of metformin. Drug Metab Dispos. 2020;48(4):264‐271. doi: 10.1124/dmd.119.088435 [DOI] [PMC free article] [PubMed] [Google Scholar]
- 31. Chappell JC, Turner PK, Pak YA, et al. Abemaciclib inhibits renal tubular secretion without changing glomerular filtration rate. Clin Pharmacol Ther. 2019;105(5):1187‐1195. doi: 10.1002/cpt.1296 [DOI] [PMC free article] [PubMed] [Google Scholar]
- 32. Grün B, Kiessling MK, Burhenne J, et al. Trimethoprim‐metformin interaction and its genetic modulation by OCT2 and MATE1 transporters. Br J Clin Pharmacol. 2013;76(5):787‐796. doi: 10.1111/bcp.12079 [DOI] [PMC free article] [PubMed] [Google Scholar]
- 33. Kristensen K, Lindstrom V, Schmidt C, et al. Temporal changes of the plasma levels of cystatin C, beta‐trace protein, beta‐2‐microglobulin, urate and creatinine during pregnancy indicate continuous alterations in the renal filtration process. Scand J Clin Lab Invest. 2007;67(6):612‐618. doi: 10.1080/00365510701203488 [DOI] [PubMed] [Google Scholar]
- 34. Akram M, Akhtar MS, Waqar N. Glomerular filtration rate and levels of serum and urinary proteins in nonpregnant, pregnant and post‐puerperal Pakistani women. J Pak Med Assoc. 1982;32(11):257‐262. [PubMed] [Google Scholar]
Associated Data
This section collects any data citations, data availability statements, or supplementary materials included in this article.
Data Availability Statement
The data that support the findings of this study are available from the corresponding author upon reasonable request.