

Significance Statement
The first chromosome‐scale assemblies for North American members of the Acer genus, sugar maple (Acer saccharum) and boxelder (Acer negundo), as well as transcriptomic evaluation of the abiotic stress response in A. saccharum are reported. This integrated study describes in‐depth aspects contributing to each species' approach to tolerance and applies current knowledge in many areas of plant genome biology with Acer physiology to help convey the genomic complexities underlying tolerance in broadleaf tree species.
Keywords: Acer saccharum, Acer negundo, genome, differential expression, nutrient stress, calcium, aluminum, plasticity, abiotic stress, tolerance
SUMMARY
Maples (the genus Acer) represent important and beloved forest, urban, and ornamental trees distributed throughout the Northern hemisphere. They exist in a diverse array of native ranges and distributions, across spectrums of tolerance or decline, and have varying levels of susceptibility to biotic and abiotic stress. Among Acer species, several stand out in their importance to economic interest. Here we report the first two chromosome‐scale genomes for North American species, Acer negundo and Acer saccharum. Both assembled genomes contain scaffolds corresponding to 13 chromosomes, with A. negundo at a length of 442 Mb, an N50 of 32 Mb, and 30 491 genes, and A. saccharum at a length of 626 Mb, an N50 of 46 Mb, and 40 074 genes. No recent whole genome duplications were detected, though A. saccharum has local gene duplication and more recent bursts of transposable elements, as well as a large‐scale translocation between two chromosomes. Genomic comparison revealed that A. negundo has a smaller genome with recent gene family evolution that is predominantly contracted and expansions that are potentially related to invasive tendencies and tolerance to abiotic stress. Examination of RNA sequencing data obtained from A. saccharum given long‐term aluminum and calcium soil treatments at the Hubbard Brook Experimental Forest provided insights into genes involved in the aluminum stress response at the systemic level, as well as signs of compromised processes upon calcium deficiency, a condition contributing to maple decline.
INTRODUCTION
Acer saccharum (sugar maple) is a long‐lived and dominant species in New England forests with a native range covering Eastern Canada and the Northcentral and Northeastern United States. Widely known for its vibrant autumn hues, for its high‐quality timber, and as the preferred species for the production of maple syrup, A. saccharum also plays a key role in its native ecosystems, altering soil mineral content (Lucash et al., 2012), moisture levels (Emerman & Dawson, 1996), and mycorrhizae communities (Cong et al., 2015). Acer saccharum provides food and shelter to many mammals (Godman et al., 1990), resident and migratory birds (Darveau et al., 1992), and over 300 species of caterpillar. Although seeds from this predominantly monoecious species are wind‐dispersed, the early flowers are an important pollen source for bees in late winter (Blitzer et al., 2016).
One of the most phylogenetically (approximately 50 MY) and morphologically distinctive Acer species from A. saccharum is Acer negundo (boxelder). Acer negundo is a short‐lived tree that has the largest range of all North American Acer. It is native to predominantly lower‐elevation regions of Canada, the United States, and Mexico (Figure 1; Enquist et al., 2016; Maitner et al., 2018). This adaptable pioneer species is often seen in disturbed sites and urban settings. Acer negundo has soft wood and less concentrated sugars for syrup, grows rapidly, and can tolerate low nutrient soils, moderate salinity, and drought conditions. Its invasive status in large portions of Europe, South America, and Asia are indicative of greater phenotypic plasticity (Lamarque et al., 2013). Acer negundo has a number of distinctive attributes including dioecy (Renner et al., 2007) and pinnately compound leaves, mostly seen only in close relatives. Within such a significant genus, these two species reflect a breadth of social and ecological diversity and importance that recommends better understanding of their genetic distinctions.
Figure 1.
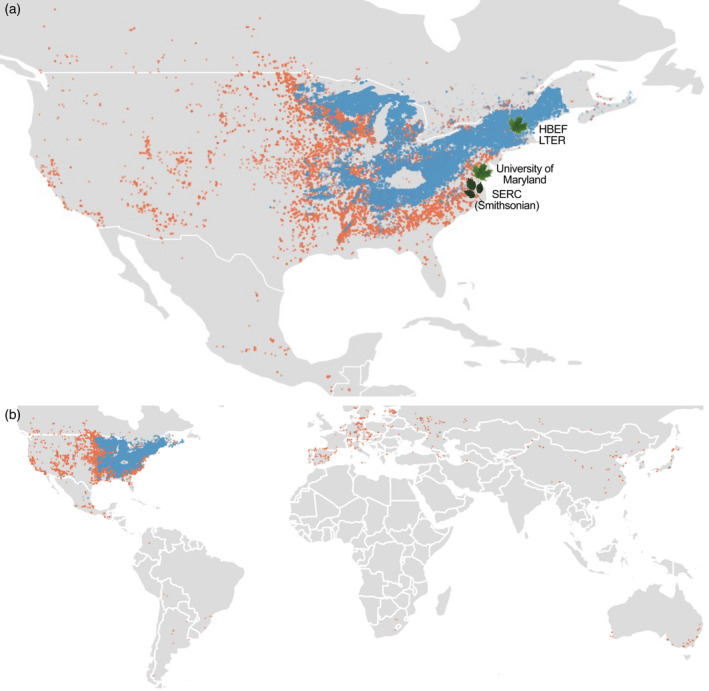
(a) Native distributions of Acer saccharum (blue) and Acer negundo (orange) in North America. Leaves indicate locations of individuals selected for the reference genomes: A. saccharum from the University of Maryland campus and A. negundo from the Smithsonian Environmental Research Center. Hubbard Brook Experimental Forest (HBEF) is the location of the nine individuals used for RNA‐Seq. (b) All records of occurrence, native, introduced, and unknown, per BIEN 4.2. Non‐native occurrences are predominantly A. negundo. [Colour figure can be viewed at wileyonlinelibrary.com]
Forest ecosystems of the Northeastern U.S. are facing significant changes in composition driven by climate change (Rogers et al., 2017). ‘Maple decline’ is a term referring to the loss of maple populations, originally referring to A. saccharum, but now applicable to Acer platanoides and Acer rubrum in the Northeast, and most recently, Acer macrophyllum in the Northwest. Loss of A. saccharum has been documented over the last century, leading to the first comprehensive, multidisciplinary study of this condition in the late 1950s (Giese et al., 1964; Horsley et al., 2002). Maple decline is characterized by crown dieback, a reduction in overall health and vigor, and a decrease in regeneration (Bishop et al., 2015). Episodic decline has increased in recent decades (Oswald et al., 2018). Decline and crown dieback of dominant A. saccharum provides a release for sympatric species, such as Fagus grandifolia (American beech), which displays a higher level of tolerance to soil conditions and foliar aluminum ratios leading to shifting forest composition (Halman et al., 2015). Studies examining potential factors of maple decline have largely agreed that modified soil conditions, largely due to acid deposition, are the leading cause, compounded by additional climatic, pathogenic, and anthropogenic stressors (Bal et al., 2015). Acidic soils rapidly leach the essential cations calcium, magnesium, and potassium, while mobilizing aluminum within the soil and contributing to more phytotoxic forms (Likens et al., 1998; Likens & Lambert, 1998). Competition between aluminum and calcium at the roots further decreases levels of available calcium within tissues, while increasing aluminum damages plasma membranes, cell walls, and DNA and increases the burden of oxidative stress. Such nutrient interactions and their broader consequences on physiology and ecology are studied at the Hubbard Brook Experimental Forest (HBEF), a long‐term ecological research (LTER) site. It was here that acid deposition was first discovered in North America (Likens & Bormann, 1974) and continues to be studied through the Nutrient Perturbation (NuPert) program (Berger et al., 2001). It provides a replicated high‐elevation natural ecosystem to examine current, future, and past soil conditions, and has been the site of several key studies on native species, including A. saccharum, Abies balsamea, F. grandifolia, and Picea rubens. At HBEF, no studies of A. saccharum to date have focused at the genomic level, where variation in gene expression or signs of adaptation among gene families may be more immediately informative in these slow‐growing organisms. For such analysis, a high‐quality, chromosomal‐length genome is necessary to more accurately detect these forms of variation.
Genomic resources necessary to guide Acer conservation are very limited. Only three genomes exist to date: Acer truncatum (purpleblow maple), widely distributed across East Asia (Ma et al., 2020), and the endangered Acer yangbiense and Acer catalpifolium, native to the Yuhan Province (Yang et al., 2019) and West China (Yu et al., 2021), respectively. Here, were present the first two North American Acer genomes, A. saccharum and A. negundo. With these chromosome‐scale references, we describe differences in genomic characteristics that may reflect their alternative tolerance strategies. We conducted a differential expression study with stem tissue from A. saccharum individuals from HBEF in order to identify genes that may be involved in the aluminum response and calcium deficiency. Identification of key processes in the expression study helped to provide focus to the following analysis of comparative gene family dynamics. Together, these approaches highlighted families associated with various abiotic stress responses, including those that also have significant dynamics or novel isoforms in A. saccharum or A. negundo relative to other broadleaf tree species. This study allowed investigation of the effects of calcium availability at the molecular level, a significant factor associated with maple decline.
RESULTS
Genome size estimation and quality control
Acer saccharum DNA sequencing resulted in 63 Gb of PacBio data with an N50 of 21 kb (max read length 94 kb) and Illumina PE data totaling 225 Gb. Acer negundo was similar with 61 Gb of PacBio data, an N50 of 17 kb (max read length 95 kb), and 223 Gb of Illumina PE data. Genome size estimation using short reads resulted in smaller than expected estimates (Contreras & Shearer, 2018; Leitch et al., 2019) at 636 and 319 Mb for A. saccharum and A. negundo, respectively (Figure S1). DNA sequence read coverage was high, with long reads at 111× and 141× and short reads at 180× and 208× for A. saccharum and A. negundo, respectively (Table S1). RNA sequencing (RNA‐Seq) of the reference individuals resulted in 61 M reads for A. saccharum (92% mapped) and 62 M for A. negundo (93% mapped). RNA‐Seq of samples for the differential expression study resulted in 207 M reads with mapping rates that ranged from 82% to 92%.
Genome assembly
Testing of multiple assembly approaches found the FALCON/Purge Haplotigs assembly to be the most contiguous and closest to A. saccharum's estimated size (Figure 2). Statistics for the set of primary contigs from FALCON did not change much between the assembly, unzip, and polishing stages (Data S1). The final total length for A. saccharum settled at 970 Mb, with an N50 of 691 kb and 2549 contigs. These last two statistics indicated better contiguity compared to the other assemblers tested. The associated haplotype contigs rose from 109 Mb after assembly to 320 Mb after unzipping, and dropped to 264 Mb after polishing. Removal of under‐collapsed haplotypes reduced the genome size to 668 Mb across 1210 contigs with an N50 of 951 kb. BUSCO (embryophyte) reported 94.8% complete, but with a somewhat high percentage of duplication (11.7%).
Figure 2.
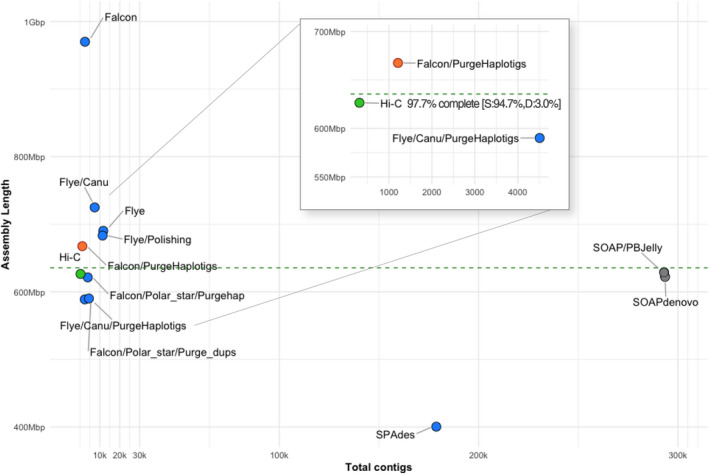
Results of assembly testing with Acer saccharum, comparing fragmentation in terms of total contigs versus assembly length. The dashed line represents the estimated genome size. Gray dots are short‐read assemblers, shown as highly fragmented. Blue dots are long‐read tests of assembly workflows. Canu refers to the use of reads error‐corrected by the Canu pipeline. The red dot is the selected draft assembly, and the green dot shows scaffolding results following Hi‐C. Detailed assembly statistics are available in Data S1. [Colour figure can be viewed at wileyonlinelibrary.com]
The FALCON primary assembly for A. negundo was also consistent in size across pipeline stages, with a total length matching estimates at 481 Mb across 1481 contigs with an N50 of 625 kb. Removal of haplotype duplication from the primary assembly decreased the overall length to 442 Mb and number of contigs to 1063, and increased the N50 to 700 kb. The BUSCO score was 94.1% with only 5.8% duplication.
Hi‐C scaffolding
The FALCON assembly was selected over Flye due to the substantially more contiguous assembly it produced for A. saccharum, though it should be noted that the statistics for both assemblers were comparable for those for A. negundo. Hi‐C reads provided 65× coverage of the A. saccharum genome. The final assembly was 626.33 Mb in 388 scaffolds with an N50 of 45.72 Mb and a GC content of 35.7%. The 13 pseudo‐chromosomes represented 97% of the genome length, and BUSCO (embryophyte) scores were 97.7% complete with 3.0% duplicate, 0.7% fragmented, and 1.6% missing.
Acer negundo Hi‐C reads provided 100× coverage and the FALCON assembly was used for scaffolding due to potential mis‐assembly in the Flye version (Figure S2). The final assembly was 442.39 Mb in 108 scaffolds with an N50 of 32.30 Mb and a GC content of 34.1%. The 13 pseudo‐chromosomes represented 99.74% of the total length. BUSCO embryophyta scores were 97.4% complete with 5.6% duplicate, 0.9% fragmented, and 1.7% missing (Data S1). Earlier work based on low‐coverage sequencing postulated higher GC content for both A. saccharum (Staton et al., 2015) and A. negundo in particular (Contreras & Shearer, 2018), but whole genome sequencing supports their place at the lower range among angiosperm plants (Trávníček et al., 2019).
Genome annotation
Annotations for A. saccharum resulted in 40 074 gene models of which 8765 were monoexonics verified by the presence of a protein domain and start and stop codons. Transcriptome comparison based on 15 234 transcript loci supported 13 997 gene models. Functional annotation was applied via similarity search or gene family assignment for 35 304 models. Acer negundo had 30 491 genes, 5558 of which were monoexonic, and 16 168 transcript loci supported 14 682 of the de novo models. Functional annotations were determined for 27 077 of the models (Data S2). The A. saccharum repeat content was 64.4%, while that for A. negundo was 58.6%.
Whole genome duplication and Acer synteny
Categorization of putative paralogs revealed a higher percentage of each type in A. saccharum relative to A. negundo (Figure 3a,b). Distribution of synonymous substitutions per site (Ks) for whole genome duplication (WGD) genes in collinear regions show a single clear peak in each Acer at a Ks range consistent with the core eudicot WGT reported in other species using the same pipeline. Acer saccharum had an additional small, recent peak, but further investigation identified short blocks of collinearity, a minimum of five genes, in palindromic or tandem arrangements. These blocks are predominantly located on a few scaffolds and are not reflective of the general distribution typical of WGD (Data S3). Macrosynteny analysis found that A. negundo and A. yangbiense are generally syntenic, while comparisons between each of these and A. saccharum revealed a large‐scale translocation where two chromosomes from A. negundo are split with sections exchanged to form two different chromosomes in A. saccharum (Figure 3c; Figure S4).
Figure 3.
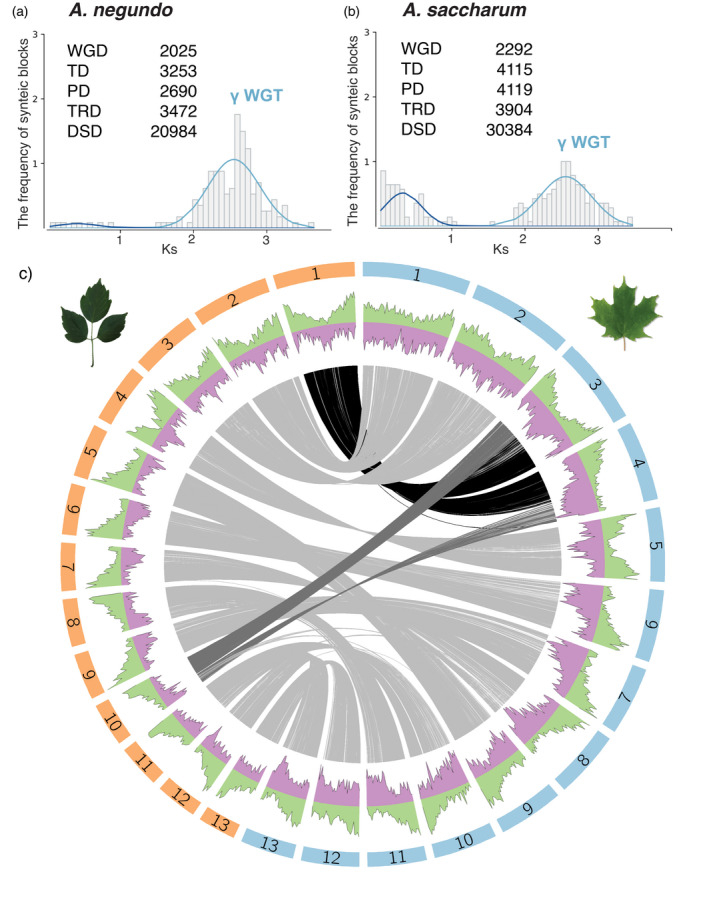
Ks distribution for WGD synteny blocks with a summary of duplication types in (a) Acer negundo and (b) Acer saccharum. Abbreviations for categories of duplication: WGD, whole genome duplication; TD, tandem duplication; PD, proximal duplication; TRD, transposed duplication; DSD, dispersed duplication. (c) Circos plot of the 13 chromosomes ordered largest to smallest for A. negundo (orange bars) and A. saccharum (blue bars) with distributions of gene density (green) and transposable element frequency (purple). Syntenic regions are linked in gray with darker shades to visually highlight larger recombinations. [Colour figure can be viewed at wileyonlinelibrary.com]
Expression analysis of A. saccharum aluminum and calcium treatments
The final annotated genome for A. saccharum served as a reference for the expression study. In total, there were 245 unique differentially expressed genes (DEGs) with 181 having sequence similarity descriptors. Of those with no similarity match, four were completely novel with no identifiable protein domain. Initial analysis produced six up‐ and nine downregulated genes comparing the aluminum to calcium treatments, and the other pairwise comparisons had similarly small totals. Clustering of the expression results showed season had a strong effect (Figure S3), so the analysis was repeated for each season individually to remove this variable from treatment comparisons. For brevity, abbreviations are used according to the following definitions: All, across seasons; Fa, fall; Sp, spring; Al, aluminum; Ca, calcium; and Un, unamended. FaAl to FaCa had 26 up‐ and 17 downregulated, FaAl to FaUn had seven up‐ and 12 downregulated, and FaUn to FaCa had 28 up‐ and 27 downregulated genes. SpAl to SpCa had 39 up‐ and 19 downregulated, SpAl to SpUn had the greatest numbers with 33 up‐ and 41 downregulated, and SpUn to SpCa had 28 up‐ and 11 downregulated genes (Figure 4; Data S4).
Figure 4.
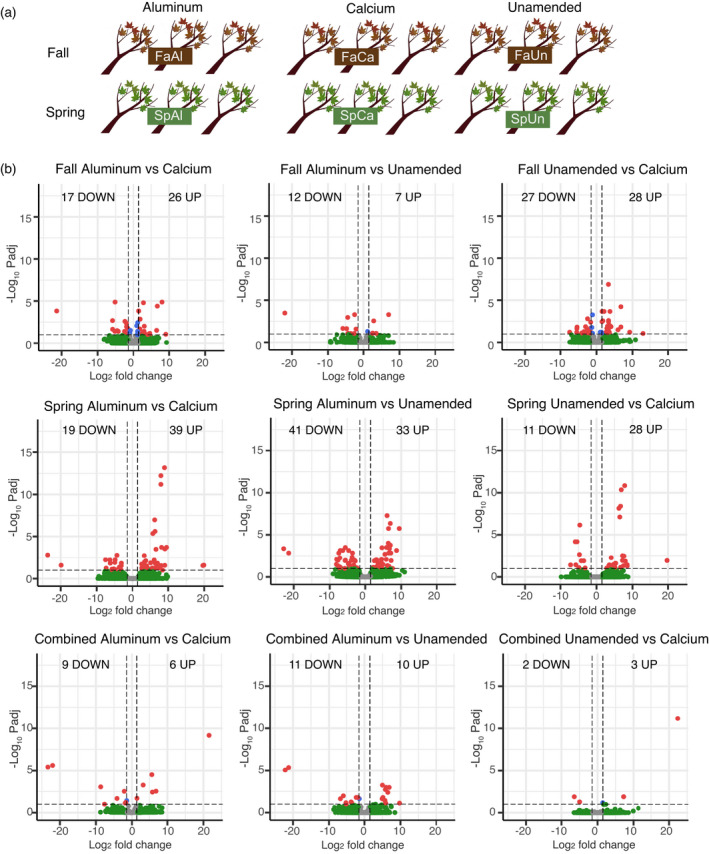
(a) Differential expression study design showing the number of samples collected in fall and spring from treatment plots at the Hubbard Brook Experimental Forest, Nutrient Perturbation study. (b) Differentially expressed genes (up‐ and downregulated) for each treatment and season comparison. Charts display both significance and relative expression denoted as log‐fold change. Dotted lines indicate thresholds of significance (0.1 P‐adjusted, 1.5 log2 fold change). [Colour figure can be viewed at wileyonlinelibrary.com]
There were only two instances where the same gene was found in both separate seasonal analyses. Transcription factor‐like E2FE was upregulated in both unamended and aluminum treatments in fall, spring, and all. It had the most isoforms expressed, and was also the most highly upregulated for fall (8‐fold). E2FE represses endoreduplication, reducing this type of growth in response to stress (Hendrix et al., 2018). The second instance was disease resistance protein At4g27190‐like, expressed primarily in SpAl, but also FaUn and FaCa. Another At4g27190 isoform was upregulated in SpCa and SpAl, but downregulated in SpUn.
Gene ontology (GO) enrichment results for fall showed sugar and carbohydrate transmembrane transporter activity upregulated in FaUn compared to FaCa (Table S3). Several sugar transporters, SWEETs and ERD6‐like, were seen in both seasons, though more often in fall. There were two SWEET15 (tandem duplicates), one upregulated in FaUn to FaCa, and SWEET15‐like was upregulated in SpUn relative to both SpCa and SpAl (7.6‐fold). SWEET2a was upregulated in FaAl to FaCa. Three different ERD6 were upregulated in FaUn with a fourth in SpAl. Triterpenoid biosynthetic process was also enriched in FaUn to FaCa, supported by two downregulated beta‐amyrin synthase genes, one of which was significantly downregulated even further in FaAl to FaUn (5.4‐fold). Other strongly differentiated genes included accelerated cell death 6‐like (ACD6) upregulated in FaCa (5‐fold) relative to FaAl. It is associated with flavin‐containing monooxygenase 1 (FMO1), the most highly upregulated DEG in FaUn (22‐fold) and FaCa, both relative to FaAl.
In spring, DEGs upregulated in SpUn compared to SpAl were enriched in processes related to biotic and abiotic stress, including GO terms for defense response and acid, oxygen‐containing, and antimicrobial response. There were six disease resistance genes, all largely upregulated in SpUn and SpCa compared to two in fall. Also present in large numbers were serine/threonine kinases, including leucine‐rich repeat (LRR) receptor‐like, with seven out of 12 of these in FaUn. Heat shock proteins were also common, though more equally split between the two seasons and shifted toward unamended or aluminum. There were two copies of ITN1, involved in salicylic acid signaling, one of which was the most upregulated DEG in SpCa to SpAl (23.6‐fold). In addition to direct stress response, there was an interesting increase of expression in three Holliday junction resolvases and a lamin‐like gene, which was the second highest DEG in these comparisons (19.7‐fold). It can play a role in nuclear membrane integrity, chromatin organization, and gene expression (Hu et al., 2019).
Metal tolerance via ligation, sequestration, and transport
In SpAl, upregulation of both metallothionein‐like 3 (6.6‐fold) and aluminum‐activated malate transporter (ALMT) 10 (4.5‐fold) was observed. EH domain‐containing gene (4.6‐fold), involved in endocytosis, vesicle transport, and signal transduction (Naslavsky & Caplan, 2005), and several cytoskeletal‐related genes were seen, such as kinesin in fall (6.8‐fold) and myosin‐6 in spring (8‐fold).
In addition to the sugar transporters, ABC transporters were present as multiple isoforms in FaUn, and one was the most upregulated DEG in FaUn compared to FaCa (13‐fold). Two were downregulated in FaAl compared to FaCa, but still elevated in FaUn, and were from family C, which contains pumps for glutathione S‐conjugates, which have been shown to remove cadmium in Arabidopsis (Tommasini et al., 1998). Additional transport genes included upregulation of ATPases across seasons, cyclic and mechanosensitive ion channels in spring and fall, respectively, and a K+/H+ antiporter upregulated in FaAl.
Calcium‐dependent proteins
Three calcium‐transporting ATPases were upregulated in either FaCa or FaUn along with an unspecified plasma membrane ATPase. Ca‐based external signal relay mechanisms upregulated in SpCa included a cyclic nucleotide‐gated ion channel, G‐type lectin S‐receptor‐like serine/threonine‐protein kinases, and a glutamate receptor (5.5‐fold) (Sun et al., 2013; Toyota et al., 2018). A calcium‐dependent protein kinase (4.5‐fold) was upregulated in FaUn. Calmodulin‐binding proteins (60 days at 5‐fold) were upregulated in both SpAl and SpCa, and are associated with salicylic acid synthesis and immunity in Arabidopsis (Li, Ying, et al., 2021a).
Reactive oxygen species response
Antioxidant and redox genes included glutathione S‐transferase, upregulated in both FaCa and SpAl. Highly expressed epoxide hydrolase (9‐fold) and a carotenoid cleavage dioxygenase (4.6‐fold) were upregulated in FaAl, and glutathione peroxidase was upregulated in FaUn. Six thioredoxin genes, a peroxidase, aldehyde dehydrogenase (6.7‐fold), germin, and cytochrome P450 71D11 (a monooxygenase) were upregulated in SpAl. Ascorbate‐dependent oxidoreductase SRG1 was upregulated in SpUn.
Cell wall and membrane integrity
MDIS1‐interacting receptor kinase, upregulated in FaUn relative to FaAl, and expansin, in FaUn to FaCa, are associated with the cell wall. Two genes encoding ADP‐ribosylation factor GTPase‐activating proteins, one of which is the most highly upregulated gene in spring (19.9‐fold change in SpAl to SpCa), assist with cell signaling by recruiting cargo‐sorting coat proteins at the membrane and regulating lipid composition in support of development and defense (Donaldson & Jackson, 2011).
Hormone crosstalk
Auxin was indicated by three WAT genes (seen in each season, greatest at 7‐fold in SpAl to SpCa) and indole‐3‐acetic acid (IAA) (highest of AllAl to AllUn at 9.7‐fold). Two ethylene synthesis genes were present: 1‐aminocyclopropane‐1‐carboxylate oxidase, upregulated in FaAl to FaCa, and methylthioribose kinase, in SpAl to SpCa. ent‐Kaurenoic acid oxidase is related to brassinosteroid homeostasis and gibberellin biosynthesis (Helliwell et al., 2001) and was upregulated in SpAl to SpUn (7‐fold), and obtusifoliol 14α‐demethylase, which mediates brassinosteroid synthesis, was upregulated in SpUn to SpCa (Xia et al., 2015). Jasmonic acid activity was upregulated in FaCa, negative regulation of cytokinin was up in AllAl to AllUn, and ABA‐induced HVA22, which inhibits gibberellin and is possibly involved in vesicular traffic, was up in SpAl to SpCa (8‐fold) as well as AllAl to AllCa.
Gene family evolution with expression study integration
By leveraging 22 high‐quality plant genomes, gene family dynamics between A. negundo and A. saccharum revealed distinct characteristics. Comparisons among the plant proteomes resulted in 20 234 orthogroups with a mean size of 26.4 genes. Of these, 4262 were shared by all species, and 79 were single‐copy. Of 603 640 genes, 88.5% were contained in orthogroups, and 0.7% were species‐specific. All species had at least 80% of their genes contained in orthogroups with the exception of Ginkgo biloba, Nymphaea colorata, and Oryza sativa (Table S4).
All three Acer shared 11 156 orthogroups. Acer negundo and A. saccharum had the largest overlap, A. saccharum and A. yangbiense had the second largest overlap, and A. saccharum had the most unshared groups (Figure 5b). Comparing Acer against the other woody angiosperms (Betula pendula, Carica papaya, Citrus clementina, Citrus sinensis, Eucalyptus grandis, Juglans hindsii, Juglans regia, Pistacia vera, Populus trichocarpa, Prunus persica, Quercus lobata, Quercus robur, Tectona grandis), 728 Acer orthogroups were expanded, 14 were contracted, 1992 were novel, and Acer was estimated to be missing from 202 orthogroups. To clarify, these may not be fully absent, but did not have representation in orthogroups including those that were more lineage‐specific. Comparing the Sapindales to the other trees resulted in 340 expanded, four contracted, 2788 novel, and 160 missing orthogroups. Dynamics in common between the two Acer included 270 expanded groups, one contracted, zero novel, and 247 missing (Data S5).
Figure 5.
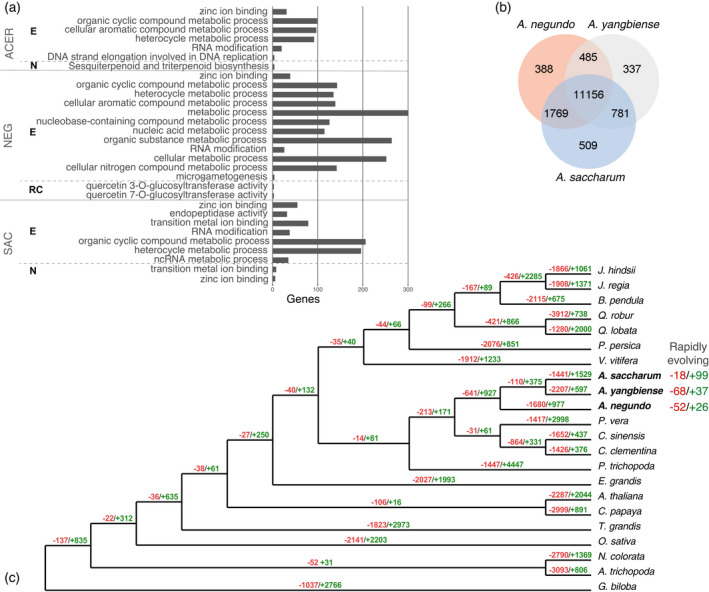
(a) Gene ontology enrichments for Acer (all three species combined), Acer negundo, and Acer saccharum. Abbreviations for gene family dynamics: E, expanded; N, novel; RC, rapidly contracting. (b) Total gene families, shared and unique, among the Acer. (c) Reconstructed gene tree showing contracted gene families in red and expanded in green. [Colour figure can be viewed at wileyonlinelibrary.com]
Acer families expanded among the woody angiosperms were enriched for RNA modification, DNA replication strand elongation, and processes of organic cyclic compound, cellular aromatic compound, and heterocycle metabolisms. Novel genes were highly enriched for cell periphery localization and marginally for sesquiterpenoid and triterpenoid biosynthesis (Figure 5a; Table S5). When focusing on absent gene families, none were found to be missing exclusively in Sapindales, which includes the two Citrus species and P. vera. Families for phosphatidylcholine transfer protein‐like and cellulose synthase interactive 3 were absent in all Acer but were present in all other species.
Several interesting gene families more novel to Acer overlap with the HBEF DEGs. There are 20 orthogroups associated with disease resistance At4g27190, two seen as DEGs, and the specific families containing these DEGs are larger for A. saccharum with one novel to the Acer. Two additional non‐DEG families are rapidly expanding in A. saccharum, with one of these also expanding in A. negundo, but both contracting in A. yangbiense. In fall, another more novel DEG, ACD6‐like, belongs to a family with limited species membership (Sapindales and Vitis vinifera). Compared to Arabidopsis ACD6, which has two 3‐repeating ankyrin domains, the A. saccharum ACD6‐like had varying ankyrin positions, as do other members of this family. A third example, seen only in spring, acetyl‐coenzyme A synthetase (ACS), is a member of a novel Acer family consisting of one A. negundo, six A. saccharum, and 18 A. yangbiense. Comparison with A. negundo and ACS isoforms reveals the A. saccharum gene contains a longer ACL domain, with only approximately 67% query coverage and approximately 43% identity to A. negundo, which is much more similar to other ACSs (87–90% length; approximately 88% identity).
Within the broader set of species, A. saccharum gene families were characterized by more expansion, with 1827 expanded, 18 contracted, 127 novel, and 511 absent, and more rapidly expanding, with 99 compared to 18 rapidly contracting. Acer negundo had 1068 expanded, 23 contracted, 89 novel, and 558 absent orthogroups. Rapidly contracting families were greater in this species with 52 compared to 26 rapidly expanding (Figure 5c; Data S5 and S6).
Acer saccharum gene families
Functional enrichment of A. saccharum in the full species comparison revealed that expansions were processes of non‐coding RNA metabolism, RNA modification, organic cyclic compound metabolism, heterocycle metabolism, and intracellular membrane‐bound organelle localization (Table S5). Almost half of the A. saccharum families had limited annotation information, due to either missing descriptors or uncharacterized protein matches. Relative to Acer, A. saccharum’s expanded families are enriched in a larger list of stress response‐associated functions that are fairly specific, including water deprivation, hypoxia, salinity, heat, cold, xenobiotic, nematode, karrikin, acid chemical, and hormone (Data S13). Other significant processes include regulation of indolebutyric acid stimulus (auxin family), RNA splicing, chloroplast RNA processing, phospholipid translocation, brassinosteroid homeostasis, lignin synthesis, microsporogenesis, phenylpropanoid biosynthesis, cadmium ion transmembrane transport, cyclin‐dependent serine/threonine kinase, and calcium‐transporting ATPase. Rapidly expanding families are associated with various biotic and abiotic responses, such as fungal, salt stress, and xenobiotic responses (Data S6). Interesting genes include patatin‐like 2, involved in membrane repair via removal of lipids modified by oxidation (Yang et al., 2012) and ALP1 negative regulation of polychrome group chromatin silencing (Liang et al., 2015). Those that overlap with HBEF DEGs include disease resistance At4g27190 and DSC1, FMO1, rapidly expanding SRG1, and rapidly contracting disease resistance At1g50180.
Compared to other Acer, contracted families are enriched for pollen wall assembly, extracellular matrix assembly and organization, chlorophyll binding, NADH dehydrogenase (ubiquinone) activity, DNA‐directed 5′–3′ RNA polymerase activity, programmed cell death, and myb‐like transcription factors (Data S11 and S12). Genes absent in A. saccharum but present in all other species total 28 (Data S14), including red chlorophyll catabolite reductase (ACD2) and S‐adenosyl‐l‐homocysteine hydrolase (HOG1), which is necessary to hydrolyze the by‐product of the activity of S‐adenosyl‐l‐methionine‐dependent methyltransferase, and one of these was also absent. The apparent absence of HOG1 requires further investigation as mutants display a number of problematic phenotypes and variants display association with fiber length in Populus tomentosa (Du et al., 2014).
Acer negundo gene families
In the broad comparison of species, A. negundo expanded families were enriched in RNA modification, microgametogenesis, and metabolic processes of nucleobase‐containing compound, organic cyclic compound, heterocycle, and cellular aromatic compound (Table S5). The small number of rapidly expanding families were by far mostly uncharacterized proteins or missing sequence similarity descriptions with only four out of 26 genes having a description, including glutathione S‐transferase, two disease resistance proteins, At4g27190‐like and At5g66900, a receptor‐like 12, and additional functional descriptors, such as E3 ubiquitin‐protein ligase and LRR receptor‐like serine/threonine kinase (Data S6). Relative to other Acer, A. negundo’s expanded families are enriched in a short list of specific stress responses including UV, UV‐B, radiation, bacterium, cadmium, metal ion, drug, chemical, and osmotic stress (Data S9 and S10). Other processes include proanthocyanidin biosynthesis, lignin synthesis via cinnamyl‐alcohol and sinapyl‐alcohol dehydrogenase, starch metabolism and glucan catabolism, error‐prone translesion synthesis, and other DNA damage response and repair. Processes related to reproduction were present, especially pollen development. For example, decreased size exclusion limit 1 (DSE1, aka aluminum‐tolerant 2 [ALT2]) is a transcription factor that regulates the size of molecules that can travel through plasmodesmata, as channel aperture is not static, changing in response to stress and decreasing during embryo development (Xu et al., 2012). DSE1 is single‐copy in all species with expansions only in A. negundo, Quercus rober, and T. grandis.
Contractions relative to other Acer include transcription by RNA polymerase III, chloroplast RNA processing, and lignin biosynthetic processes (Data S7 and S8). Rapidly contracted families were enriched in quercetin 3‐O‐ and 7‐O‐glucosyltransferase activity (Table S6). Examples of contracted families include 7‐ethoxycoumarin O‐deethylase, which metabolizes a wide range of xenobiotics (Robineau et al., 1998), and disease resistance‐like protein DSC1, both rapidly expanding families in A. saccharum (Data S6). There are 23 genes absent in A. negundo that are present in all other species (Data S15). Several of these are curious, as they appear to be required components of important processes, such as AUGMIN subunits 2 and 7, which help form a complex that plays a role in spindle microtubule generation (Tian & Kong, 2019), and cell division cycle 45‐like, which is required for meiosis in Arabidopsis (Stevens et al., 2004). The absence of formamidopyrimidine‐DNA glycosylase is also interesting as it is involved in base excision repair of DNA damage, a notable area of specific enrichments described below.
DISCUSSION
Acer saccharum and A. negundo differ in species distribution and tolerance to abiotic stressors, and their genomes reveal support for their contrasting life histories. Acer saccharum has slow growth until release of canopy coverage, does not achieve reproductive maturity until 40 years of age, and is able to live 400 years. It requires high nutrient soils, prefers mesic environments, and is tolerant of cold, but not salinity. Its range crosses a more narrow latitudinal gradient, but a stronger elevational one, where A. negundo tends to be more limited. While both genomes are small in size and diploid, A. saccharum is 42% larger, contains twice as many transposable elements, and 38% more gene duplications, many of which are very recent. Its gene families tend to be larger, more diverged, and undergoing rapid expansion compared to A. yangbiense or A. negundo.
In contrast, A. negundo grows quickly, is able to reproduce after only 5 years, and has a relatively short lifespan of 60 years. It is tolerant of a range of conditions and is widespread throughout North America. Acer negundo is considered an aggressive invasive in Europe, South Africa, parts of Asia, and North America, and it rapidly dominates disturbed habitats (CABI, 2021). It is sexually dimorphic and both native and invasive conspecifics are highly plastic in growth, leaf phenology, and physiological traits, such as maximum assimilation rate, nitrogen content, and photosynthetic efficiency (Dawson & Ehleringer, 1993; Lamarque et al., 2015). Relative to native heterospecifics, invasive populations of A. negundo maximized growth in high light and nutrient conditions, with dramatically reduced growth and survivorship in deficient environments (Porté et al., 2011).
The A. negundo reference genome is a small diploid with high heterozygosity from the native species range. Macrosynteny between A. yangbiense and A. negundo is largely collinear and free of the rearrangement found in the two A. saccharum chromosomes (Figure S4). Invasive plant species are often associated with smaller genomes and A. negundo is characterized by contracting gene families. Traits such as fast growth rate, germination time, stomatal responsiveness, and dispersal ability are cell size‐ or division rate‐dependent (Pyšek et al., 2018). The greater surface area to volume ratio of small cells, derived from small genomes, reduces the metabolic and signaling requirements, but does not preclude additional growth or activation, thus extending the range of expression, or plasticity, for a wider set of traits (Roddy et al., 2019; Suda et al., 2015). The adaptive potential conferred by polyploidism can also be leveraged for success of invasives, but polyploidism has not been documented in the native or introduced range.
If larger genome size presupposes increased metabolic, transport, and nutrient demands (Pellicer et al., 2018), perhaps A. saccharum’s susceptibility to nutrient deficiencies may be in part due to the extra burden of a larger genome and its particular enrichments. The decrease in soil nutrient availability in its native range over the past decades is at odds with resources necessary to tolerate stressors brought on by a changing environment, and previous adaptations are now maladaptive. From the foundational differences between A. negundo and A. saccharum in morphological, physiological, and genomic characteristics, we turn to the integration of gene family dynamics and expression data from a study on nutrient stress to further elucidate the contrasting strategies of tolerance seen in these species.
Integration of A. saccharum expression studies
Integration of gene expression sampling with gene family dynamics highlighted the genetic factors that may influence maple decline and adaptation. HBEF NuPert A. saccharum saplings grown in native ecological and environmental conditions within replicated long‐term soil treatments provided an opportunity to examine differences in gene expression related to soil acidity, calcium deficiency, and increased aluminum availability (Table S7). Calcium amendment of NuPert plots was designed to represent levels from 50 years ago, before extensive acid deposition in the HBEF range led to the deficient conditions seen in unamended control plots (Berger et al., 2001). Aluminum‐amended plots further decrease calcium availability via competition for uptake between the two cations. They represent more extreme calcium depletion and an increase in aluminum availability that is observed with soil acidity. Examination of trees on the landscape in these conditions allowed us to study the effects of long‐term nutrient stress in conjunction with other life history processes. Seasonal differences between the DEGs were striking, revealing the effect of calcium levels on processes occurring at the time of sampling.
Signaling and metabolic processes are sensitive to lower calcium levels
Calcium is the common limiting element underlying maple decline, and trees improve long‐term with the addition of calcium (Moore & Ouimet, 2021). Calcium transport and binding is well studied for its ability to activate and regulate primary components of stress response systems, including internalization of external signals, modulation of cytosolic levels for transient signaling, and initiation and perpetuation of reactive oxygen species (ROS) responses, hormone modulation, and pathways of secondary metabolism (Estravis‐Barcala et al., 2020). In physiological studies conducted at HBEF, calcium amendments resulted in a 50% increase of calcium in foliar tissues of A. saccharum, while non‐significantly decreasing aluminum concentrations. Trees in calcium plots devoted more carbon to growth than storage, were better able to flush after a late spring frost, produced more flowers, and increased seed germination (Halman et al., 2013).
Calcium amendment facilitated upregulated gene expression relative to unamended and aluminum treatments in areas related to calcium signaling and senescence activities. In fall, a gene involved in leaf senescence was highly expressed in calcium treatments, and the relative paucity of other differential expression in this season made it all the more interesting. ACD6 is important to both natural and stress response senescence, shown to regulate rosette biomass, chlorophyll degradation, and leaf nitrogen and carbon levels in Arabidopsis thaliana (Jasinski et al., 2021). It is also a factor in nitrogen translocation from leaves to seeds before cell death. ACD6 stimulates calcium signaling in A. thaliana and could potentially be an ion channel itself (Zhu et al., 2021), and several calcium‐dependent signaling and calmodulin‐binding genes were upregulated in the fall calcium and unamended plots, including the critical calcium‐dependent protein kinase 1. The ACD6 isoform expressed here is limited to Sapindales and quite diverged from the A. thaliana form. Interestingly, a second senescence gene that is expressed in A. rubrum (Chen, Lu, et al., 2019b) is absent from the A. saccharum genome. Red chlorophyll catabolite reductase (RCCR, aka ACD2) is a non‐green chlorophyll degradation protein, and while the exact role of RCCR is unclear (Jockusch & Kräutler, 2020), it appears possible that like many senescence‐related genes, it provides additional fitness advantages (Mach et al., 2001). Timing, duration, and intensity of gene expression are all important during senescence activities leading up to cell death, including adjustment of signaling, growth, metabolism, and nutrient remobilization. The susceptibility of ACD6 to calcium deficiency could potentially create complications in fall that could affect spring growth, reproduction, and the ability to respond to stress.
Throughout A. saccharum’s native range, when calcium is deficient, additional nutrient imbalances, such as magnesium, phosphorus, potassium, and nitrogen deficiency, as well as high aluminum and manganese concentrations, climatic effects, and biotic stressors, such as defoliation, create compounding stress (Bal et al., 2015; Long et al., 2019). Samples from unamended plots show an increase in stress response perhaps reflective of calcium deficiency combined with external stressors. Signs include enrichments of sugar and other transporters in fall samples (Julius et al., 2017; Miao et al., 2017). Spring samples reported upregulation of several putative disease resistance genes, heat shock proteins, LRR proteins and kinases, and signs of oxidative stress.
Oxidative stress response is high in aluminum amendment conditions
ROS are generated as a result of both stress and normal cellular processes, and reactive oxygen can take different forms, with varying toxicities. ROS are reduced by a variety of potential ‘scavengers’ to prevent accumulation to levels that are damaging to lipids, proteins, DNA, and RNA, leading to cell death. ROS production and redox activity vary according to the primary processes of each cellular compartment (i.e., metabolism in mitochondria), and also in response to different stressors or stress combinations (i.e., drought and heat), so it is thought that cells develop complex ROS signatures or hotspots that influence signal transduction and metabolic regulation in nuanced ways (Castro et al., 2021; Choudhury et al., 2017). Aluminum increases peroxidation of lipids in membranes and produces H2O2, which can participate in retrograde signaling, regulating expression of additional genes (Castro et al., 2021). Aluminum‐derived oxidative stress causes inhibition of cell growth and is an early signal of aluminum toxicity (Yamamoto et al., 2003).
Antioxidants and redox genes are commonly observed as a response to ROS stress and combinations of these were observed in different seasons and treatments, though more were found in spring as fits with the trend of increased overall activity in that season. Antioxidants, including thioredoxins, peroxidases, and a gene encoding a germin‐like protein, were all upregulated in the aluminum treatment, implying significant stress response activation. Glutathione system members, which can also act as chelators, are more broadly seen in both unamended and aluminum treatment conditions. A number of antioxidant DEGs were also from expanded families, in particular the significantly expanded thioredoxins H3 and YLS8 and SRG1 (Figure 6; Data S16). The antioxidant DEGs from this study can be compared with a number of other transcriptomic studies on metal stress in trees where glutathione S‐transferase, peroxidases, and thioredoxins were in common. For example, cadmium accumulators Salix integra and Populus × canadensis ‘Neva’ both expressed superoxide dismutase with glutathione pathway genes and peroxidases, respectively (Li, Mao, et al., 2021b; Shi et al., 2016). Nickel stress in resistant versus susceptible genotypes of Betula papyrifera found glutathione S‐transferase and thioredoxins upregulated in resistant trees (Theriault et al., 2016). Acer rubrum, a nickel avoider, had root‐level expression of superoxide dismutase, but downregulated glutathione S‐transferase (Nkongolo et al., 2018) similar to one of the A. saccharum DEGs. In comparisons of aluminum‐treated Citrus root tissue expression, peroxidases and germin‐like proteins were upregulated. It is interesting that superoxide dismutase was not significantly expressed in A. saccharum given that it is from an expanded gene family and seen in several other species. In physiological studies conducted at HBEF, Halman et al. (2013) found A. saccharum were under increasing oxidative stress in unamended and aluminum plots. Aluminum‐treated trees had elevated levels of glutathione reductase activity as measured by spectrophotometric assays. Ascorbate peroxidase activity was also elevated, but this particular peroxidase was not observed upregulated in our gene expression study.
Figure 6.
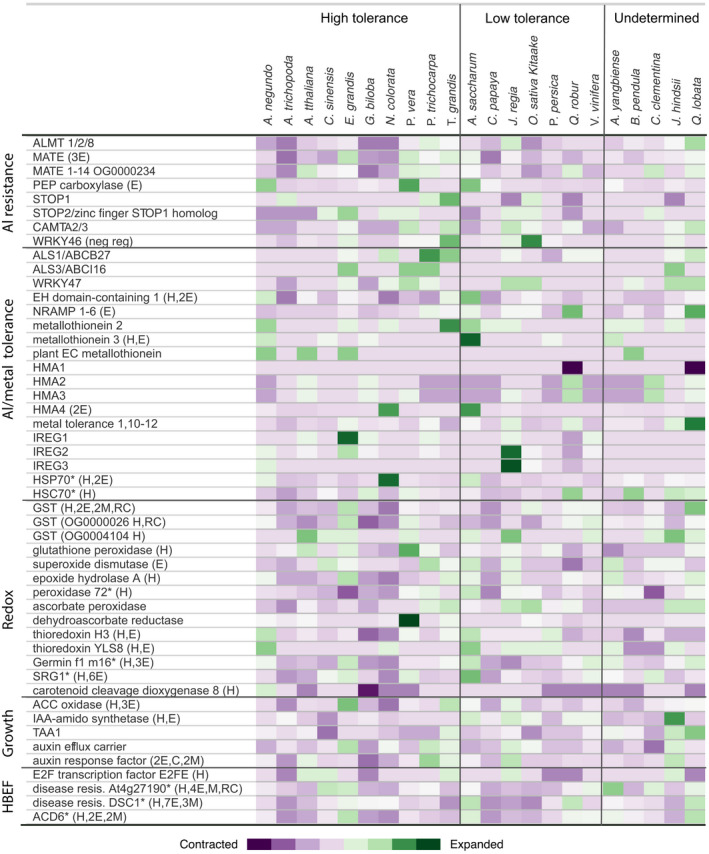
Orthogroup sizes for aluminum tolerance gene families are presented by species. Families were selected for inclusion based on documented aluminum tolerance and/or presence in the HBEF RNA‐Seq differential expression results. Color represents the proportion of gene membership per species, with darker purple equating to more contracted families relative to the median and dark green indicating expansion. H, family contains HBEF differentially expressed gene; E, expanded in Acer saccharum; C, contracting; M, missing; N, novel; *, rapidly expanding. Categorization of tolerance is according to literature describing aluminum stress phenotypes. The undetermined category contains species where tolerance to aluminum or acidic soils has not been reported. 1 Betula pendula is undetermined due to high variability in tolerance by genotype. [Colour figure can be viewed at wileyonlinelibrary.com]
Aluminum and metal response is minimal in aluminum amendment conditions
Deciphering aluminum response mechanisms can be complicated as aluminum affects several targets within cells, and resistance and tolerance mechanisms can vary widely, even within species. Accumulation of aluminum occurs primarily in the root, binding to pectin in the cell wall, increasing its rigidity and decreasing permeability. Throughout the plant, aluminum can disrupt the plasma membrane potential and membrane‐bound solute transporters (Kar et al., 2021). Damage to proteins and DNA reduces enzymatic activity, and oxidative stress and hormone signaling from DNA damage can lead to growth inhibition (Sade et al., 2016).
Studies from locations such as Vermont, the Adirondack Mountains, and the Allegheny Plateau have linked foliar aluminum and calcium levels (Long et al., 2019; Oswald et al., 2018; Sullivan et al., 2013) and stem aluminum levels to branch dieback as seen in maple decline (Mohamed et al., 1997). At HBEF, previous studies examined physiological effects of aluminum with a multitissue study on mature A. saccharum. Using inductively coupled plasma atomic emission spectroscopy, Halman et al. (2015) found foliar levels of aluminum did not vary much by treatment and all were well below thresholds of toxicity. Calcium treatments caused concentrations of aluminum to drop slightly, while aluminum treatments caused calcium to drop more strongly in dominant than in non‐dominant trees. The main effects noted were moderate root damage and foliar antioxidant activity (Halman et al., 2013). Within our stem tissue expression analysis, signs of metal response were not clear, but we can detect levels of general stress response expression between the unamended and aluminum treatments.
Genes currently known to be associated with aluminum resistance or tolerance were not expressed in the stem tissue samples, but upregulated genes related to metal transport and sequestration are potentially involved in aluminum remediation (Hasan et al., 2017; Hasanuzzaman et al., 2017). Metallothionein 3 was highly expressed in the combined season aluminum comparisons, though unevenly distributed throughout the replicates. Similar to other metallothioneins, it works by ROS scavenging and metal ion homeostasis via chelation (Hasan et al., 2017). In salt‐tolerant O. sativa, this gene responds to cadmium, salinity, and oxidative stress (Mekawy et al., 2018).
Most of A. saccharum’s aluminum resistance gene families are modestly sized relative to other species examined, with the exception of PEP carboxylase and a large family of mixed MATEs (Figure 6; Data S16), with members likely similar to homologs studied in P. trichocarpa and Arabidopsis (Li et al., 2017). Overexpression of either of these increases efflux of organic acids at the root (Begum et al., 2009). Acer saccharum had slightly more expansion in resistance families than the other Acer, while A. negundo had the least. Given the limited number of DEGs indicating metal toxicity and the non‐toxic aluminum tissue concentrations observed in physiological studies, it seems likely resistance mechanisms exist at the root in A. saccharum. Comparing aluminum/metal tolerance gene families, A. yangbiense had the fewest expanded and there are no reports on aluminum tolerance for this species. Acer negundo and A. saccharum were not notably different with the exception of the metallothionein 3 family, which was rapidly expanding, much larger in A. saccharum relative to other broadleaf tree species, and observed in the expression results for both seasons. Expanded resistance and tolerance families were seen more frequently in high‐tolerance species, such as P. vera, P. trichocarpa, T. grandis, Q. lobata, and E. grandis, though the mix of families varies (Figure 6; Sork et al., 2016; Tuskan et al., 2006; Zeng et al., 2019; Zhao et al., 2019). Gene family size is only a potential factor in response and it does not necessarily serve as a proxy for expression. The redox families selected for comparison are primarily limited to those containing DEGs, and in this case there is good overlap between gene family size and expressed redox genes. Many were larger in A. saccharum, but A. negundo was also enriched for a different set of redox families.
Indications of growth reduction and DNA damage in response to aluminum
Strong upregulation of transcription factor E2FE was notable as it is one of only two genes seen in both seasons. E2FE represses endoreduplication (Liu et al., 2019), and while endoreduplication can be induced by certain types of stress, such as drought and salinity (Lang & Schnittger, 2020), cadmium toxicity was observed to reduce endoreduplication and cell division in A. thaliana leaves (Hendrix et al., 2018). With cadmium, pathways that delay cell cycle progression due to oxidative DNA damage were upregulated along with E2FE/DEL1. Aluminum is known to cause double‐stranded breaks, which require homology‐dependent recombination repair (Chen, Sjogren, et al., 2019a). In A. saccharum, DNA damage might be indicated by upregulation of several Holliday junction resolvases which help repair double‐stranded breaks using homologous recombination (Bauknecht & Kobbe, 2014). Patterns of expression point toward oxidative DNA damage from aluminum or another source, inducing repression of endoreduplication similar to cadmium.
IAA‐amido synthetase was the most highly upregulated gene in the combined season comparison of aluminum treatment to unamended. The gene family for this DEG is novel to Acer and significantly expanded in A. saccharum. IAA is the most abundant auxin in plants, and IAA‐amido synthetase helps with its homeostasis by leading to IAA‐amino acid conjugates (Ludwig‐Müller, 2011). Increased expression of IAA‐amido synthetase produces highly reduced growth forms, altered architecture, and shortened roots (Ding et al., 2021; Sun et al., 2020). In O. sativa, overexpression of IAA‐amido synthetase resulted in improved drought tolerance (Zhang et al., 2009), fungal pathogen response (Ding et al., 2008; Domingo et al., 2009), and altered growth. Park et al. (2007) observed reduced growth in A. thaliana from overexpression of an IAA‐conjugating gene (GH3) that was highly linked to biotic and abiotic stress responses. They proposed that modulation of auxin is an adaptive strategy that trades reduced growth for enhanced stress resistance.
Stress response in A. saccharum and calcium deficiency versus aluminum toxicity
Replicated samples of A. saccharum reveal complex expression changes indicating multiple forms of stress response in aluminum treatments and to a lesser degree in unamended plots. DEGs, often related to signaling, redox, hormones, and growth reduction, are seen in aluminum or unamended treatments, but not as extensively in calcium, where there is enhancement of other processes, such as senescence and calcium signaling. Ecosystem and environmental conditions at the time of sampling likely had interacting effects and contributed to complexity of expression, but trends by season and treatment were still evident. With these data, we provide preliminary molecular support to the many studies correlating maple decline with calcium‐poor, acidic soils. Given the minimal expression of metal tolerance genes and the lower level of foliar aluminum seen in dominant sugar maple at HBEF, along with the large amount of variability in aluminum response sometimes seen between conspecific genotypes in other species, further transcriptomic studies of root tissue would be beneficial for a better understanding of aluminum resistance in A. saccharum.
Herbivory, DNA damage, and light harvesting enrichment in A. negundo
Gene family expansion in A. negundo was generally limited to UV, bacteria, metal, cadmium, chemical, and osmotic responses rather than the more extensive set seen in A. saccharum. A high proportion of proanthocyanidin synthesis‐related gene families were also expanded, which are precursors to condensed tannins that protect against herbivory, bacteria and fungal pathogens, and encroaching of neighboring plants (He et al., 2008). All four families were relatively novel to A. negundo with absence in all but one or two other species. Proanthocyanidins also have antioxidant and radical‐scavenging functions, and have been compared with lignins in terms of pathogen defense mechanisms (Stafford, 1988).
Both Acer are enriched in gene families with DNA damage recognition and repair functionality, but A. negundo has a greater number, and they are largely categorized as either translesion synthesis or meiosis‐related repair. Translesion synthesis is often activated by UV damage. It is an error‐prone repair mechanism designed to quickly eliminate lesions at the replication fork that might lead to stalling and double‐stranded breaks (Sakamoto, 2019). Acer negundo has three families expanded in this category relative to Acer, two of which are significantly expanded among the full comparison of species. Among A. negundo’s DNA damage‐related enrichment are secondary enrichments that include regulation of leaf, seed, flower development, and post‐embryonic structures, response to abiotic and biotic stress, and growth such as cell division and endoreduplication (Figure 7). Too much DNA damage can inhibit growth and development or initiate programmed cell death (Nisa et al., 2019). Perhaps a more robust response to DNA damage is a factor in A. negundo’s plasticity of growth and tolerance.
Figure 7.
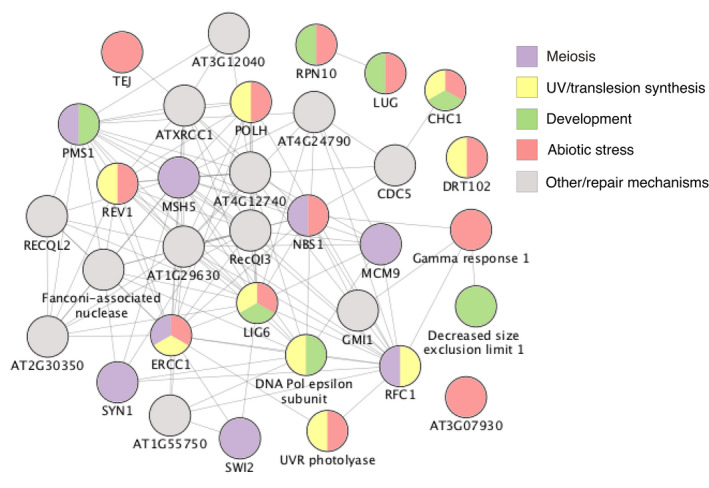
Acer negundo gene families with ontology related to DNA damage and repair, and secondary enrichments categorized by color. Circles with multiple colors indicate multiple ontology assignments. Lines indicate known or predicted interactions or other associations as determined based on text mining, co‐expression, or protein homology. [Colour figure can be viewed at wileyonlinelibrary.com]
In addition to UV‐related DNA repair, there is another potential adaptation related to photo‐oxidative stress. The early light‐induced protein 1 (ELIP) gene family stood out as significantly expanded in A. negundo relative to all other species, with twice as many genes compared to other Acer. Research has focused on ELIP’s protection against high light (Huang et al., 2012), but it also regulates seed germination in response to environmental factors (Rizza et al., 2011), and is also expressed in roots and in response to some abiotic stressors including nitrogen in Populus (Luo et al., 2015), indicating additional protective functions. Capacity for regulation of photosynthesis and DNA repair mechanisms, within a largely streamlined genome, could represent investments with large‐scale effects, altering growth according to resources or stress as described for A. negundo in various nutrient and light conditions.
CONCLUSION
In this study we present new chromosomal‐length genomes for A. saccharum and A. negundo and demonstrate the greater repeat, paralog, GC content, and expanding character of A. saccharum versus A. negundo which was reduced and rapidly contracting. We conducted a stem tissue expression study of A. saccharum subjected to long‐term aluminum and calcium treatments. Larger trends related to the abiotic stress response and calcium deficiency were revealed against a complex background of expression. Gene families related to aluminum stress resistance and tolerance were compared showing moderate expansion of families in A. saccharum. Gene family dynamics combined with physiological and expression results point toward potential aluminum resistance mechanisms in effect at the root. Broader gene family comparisons revealed expansion in traits associated with invasiveness and stress tolerance in A. negundo. Release of these genomes and a complementary expression analysis of trees in the HBEF NuPert study shed further light on mechanisms of tolerance and potential adaptations of increasing importance due to climate change.
METHODS
Sequencing
Leaf material for A. saccharum was collected from the University of Maryland College Park Campus (GPS location 38°59′16.0′′N 76°56′32.8′′W). Acer negundo was sourced from the ForestGEO Forest Dynamics plot (tag # 91603) located in Smithsonian Environmental Research Center, Edgewater, MD, USA. Leaves were dark treated for at least 1 day prior to collection and shipped to Amplicon Express, Inc. (Pullman, WA, USA) for DNA extraction. Both species were sequenced with Pacific BioSciences Sequel v2.1 using a total of 14 SMRTcells, with the SMRTbell® Express Template Prep Kit v1.0, an insert size 40 kb, and a library size selection of 66 kb for A. saccharum and 55 kb for A. negundo. The subsequent short‐read sequencing was performed with two lanes of Illumina HiSeq 2500 150PE with insert sizes ranging from 500 to 600 bp (Genomics Resource Center, University of Maryland School of Medicine Institute for Genome Sciences, Baltimore, MD, USA). For Hi‐C, DNA leaf material was collected from the same individuals and extracted with the Phase Genomics Proximo Hi‐C Plant kit (Phase Genomics, Seattle, WA, USA). Sequencing was performed with two lanes of mid output Illumina NextSeq 500 75PE with an average of 150 M reads per species (Center for Genome Innovation [CGI] at the University of Connecticut, Storrs, CT, USA). For the RNA‐Seq used in annotation, leaf samples were collected from one individual per species at 2 years of age grown at the Michigan State University greenhouse. Sequencing was performed with an Illumina HiSeq at 100PE.
Stem tissue from A. saccharum was sampled from nine trees across two seasons from the Nutrient Perturbation study plots at HBEF (North Woodstock, NH, USA). A single sapling (diameter at breast height < 21 cm) was selected from three plots in each of the three treatments (calcium, control, aluminum). A total of 18 libraries (nine in Oct 2017 [Fall]; nine in May 2018 [Spring]) were sampled (Table S2). Tissue was sampled from 5 years of growth measured by spring wood internodes. Sections were frozen in liquid nitrogen in the field and RNA was extracted after grinding tissues in liquid nitrogen. Extractions were run on an Agilent Bioanalyzer Tapestation for quantification and RNA integrity checks. Two samples were unsuccessful (one aluminum and one calcium) from the spring sampling. Libraries were prepared using Illumina TruSeq Stranded mRNA and sequenced with an Illumina NextSeq 500, 150PE (CGI).
Draft genome assembly
In advance of assembly, genome size was estimated with Jellyfish v2.2.6 (21‐mers) and GenomeScope (Vurture et al., 2017) using the trimmed Illumina short‐reads. The A. saccharum reads were test assembled using Illumina short reads, raw and corrected long reads, and a hybrid of both. Draft assemblies were evaluated in relation to expected genome size, contiguity (N50 and number of contigs), conserved seed plant orthologs, and genomic/transcriptomic read alignments.
The best draft assemblies leveraged the deep PacBio sequencing (A. saccharum 111×, A. negundo 141×) and prioritized assembling repetitive regions of the genome and resolving the heterozygosity found in both species. During this phase of the process, two draft assemblies of comparable results were used to investigate the scaffolding potential. One was created with FALCON (pb‐assembly v0.0.6), a de novo, diploid‐aware assembler for PacBio (Chin et al., 2016), and the other was done using Canu (v1.6) error‐corrected PacBio reads as input (Koren et al., 2017) to Flye v2.3.7, an efficient haploid assembler that leverages repeat graphs with read alignment techniques to resolve areas of repetition (Kolmogorov et al., 2015).
Alternate heterozygous contigs (haplotigs) were separated from the primary assemblies using Purge Haplotigs v1.0.4 (Roach et al., 2018). To determine coverage, PacBio reads were aligned to the primary assemblies with Minimap2 v2.15‐r911‐dirty (Li, 2018). RepeatModeler v1.0.8 was used to create the repeat libraries for this analysis.
Hi‐C scaffolding
Long‐range scaffolding of the FALCON/Purge Haplotigs assembly with Hi‐C reads followed processes recommended for the following suite of tools (Genome Assembly Cookbook, 2019). Hi‐C reads were aligned with BWA mem ‐5SP and PCR duplicates removed with samblaster v0.1.24 (Faust & Hall, 2014). Scripts from the Juicer v1.5.6 (Durand, Shamim, et al., 2016b) pipeline were modified to identify the Sau3AI restriction enzyme. The resulting Hi‐C alignment file was provided to 3D‐DNA v180419 (Dudchenko et al., 2017) for scaffolding, leveraging different parameters for each species according to the differing draft assembly characteristics. In particular, − diploid was added to A. saccharum to address remaining under‐collapsed heterozygosity. JuiceBox was used to visualize Hi‐C mapping against each scaffold created by the different parameter tests to visually detect which incorporated the majority of the contigs into the expected 13 pseudo‐chromosomes (Dudchenko et al., 2018; Durand, Robinson, et al., 2016a).
Genome annotation
RepeatModeler v2.01 (Flynn et al., 2020) and RepeatMasker v4.0.6 (Smit et al., 2013) were used to softmask the assembly. Trimmed RNA reads were aligned to the assembly with Hisat2 v2.1.0 (Kim et al., 2015). GenomeThreader v1.7.1 (Gremme et al., 2005) was used to align protein sequences (derived from de novo transcriptome assembly; −gcmincoverage 80, −dpminexonlen 20 ‐startcodon ‐finalstopcodon ‐introncutout). Structural gene prediction was executed with BRAKER2 v2.0.5 (Hoff et al., 2019). The process converted RNA‐Seq alignments to exon support in GeneMark‐ET v4.32 (Lomsadze et al., 2014) and combined this output with protein alignments for two rounds of training with AUGUSTUS v3.2.3 (Camacho et al., 2009; Stanke et al., 2006, 2008) to predict coding regions in the genome. Extensive filtering was performed on the predicted gene space using gFACS v1.1 (Caballero & Wegrzyn, 2019). Evaluations of structural annotations were conducted with BUSCO and the PLAZA CoreGF rosids database v2.5 (Van Bel et al., 2019; Veeckman et al., 2016). Transcriptomic alignments were used to identify where they fully overlapped BRAKER‐based models or provided additional support to those that did not pass previous filtering criteria. Transcriptome assemblies were conducted de novo with Trinity v2.20 (Grabherr et al., 2011). EnTAP v0.8.0 (Hart et al., 2020) was used to frame‐select, functionally annotate, and identify potential contaminants for filtering, including bacteria, archaea, opisthokonta, rhizaria, and fungi. The resulting translated protein sequences were clustered with USEARCH v9.0.2132 (Edgar, 2010) at an alignment identity of 0.90. Transcriptomic alignments created with GMAP v2019‐06‐10 (Wu & Watanabe, 2005) and gFACs were compared against the genome annotation using GffCompare v0.11.5 (Pertea & Pertea, 2018).
Functional annotation was performed using EnTAP v0.9.1, a pipeline that integrates both similarity search and other annotation sources including gene family (eggNOG), protein domains (Pfam), GO, and pathway assignment (KEGG). The following public databases were included: NCBI RefSeq Complete, EMBL‐EBI UniProt, and Arabidopsis (TAIR11).
Comparative genomics
The translated gene space of 22 plant species were used for gene family analysis. Acer included A. saccharum, A. negundo, and A. yangbiense. The remaining species were selected from high‐quality public annotations. Fourteen broadleaf trees (B. pendula, C. papaya, C. clementina, C. sinensis, E. grandis, Juglans hindsii, J. regia, P. vera, P. trichocarpa, P. persica, Q. lobata, Q. robur, and T. grandis), plus one woody angiosperm, V. vinifera, were included, along with one gymnosperm, G. biloba. Oryza sativa Kitaake was the representative monocot, along with Amborella trichopoda and N. colorata, representing other more basal lineages, and A. thaliana, being the primary plant model system. OrthoFinder v2.3.7 (Emms & Kelly, 2018) was used to generate orthogroups. Resulting gene counts per orthogroup for A. negundo, A. saccharum, and the mean of the combined three Acer were each compared to the mean of other broadleaf tree species to identify potentially expanded, contracted, missing, and novel gene families. The initial delineation of expansion and contraction was set at 2‐fold above the standard deviation. Full absence was verified with alignment of the Arabidopsis protein sequence against the assembly. CAFE v5 (Mendes et al., 2020) was used to identify rapidly evolving gene families. Values from the newick species tree produced by OrthoFinder were multiplied by 100 to prevent issues with rounding in CAFE, and the tree was made ultrametric using OrthoFinder. In CAFE, the Poisson root frequency distribution was run three times on gene families filtered by size to ensure convergence of a lambda value representing birth and death rates. The selected lambda value was then used to run the large family set. Functional enrichment of the resulting families was obtained from gProfiler v:e99_eg46_p14_f929183 (Raudvere et al., 2019) using the annotation of the representative (longest) gene when aligned to V. vinifera. This well‐annotated woody angiosperm represents an ideal source having no recent WGD (Tang et al., 2008).
WGD and synteny analysis
Characterization of putative paralogs including WGD was done as previously described (Qiao et al., 2019) using DupGen_finder to separate whole genome, tandem, proximal, transposed, and dispersed duplicates. Categorization can be helpful in speculating on the origin of duplication, such as transposable element activity, localized replication error, larger segmental translocations, or ploidy events. The whole genome duplicate frequency distribution was plotted by Ks value for analysis of peaks. Microsynteny of the small peak of recent supposed WGD seen in A. saccharum was further analyzed with MCScanX‐based collinearity scripts (Nowell et al., 2018), as well as overall macrosynteny between the three Acer.
Differential expression analysis
HBEF NuPert plots were used as a basis for this study as they were designed to reflect acidity and calcium levels over time as described by Berger et al. (2001). They consist of 12 A. saccharum dominant plots near reference watershed 6, with four receiving annual AlCl2 treatments 12 times from 1995 to 2015, and CaCl2 treatments were applied to four other plots for 4 years, followed by applications of slow‐release wollastonite in 1999 and 2015 (Table S7). Three samples were collected from aluminum, calcium, and unamended control plots as described in the Sequencing section. Trimmed reads for each of the 16 successful HBEF‐sourced libraries were aligned to the A. saccharum reference genome with Hisat2 v2.1.0, and read counts were extracted with htseq‐count v0.11.2. The R Bioconductor package, DESeq2 v1.26.0 (Love et al., 2014), was used for the expression analysis with calcium as the control in pairwise comparisons of unamended to calcium and aluminum to unamended, representing increasing levels of aluminum, and then aluminum to calcium, contrasting the extremes. P‐adjusted values greater than 0.1 were filtered. Pairwise comparisons specific to each season (fall and spring) as well as combined resulted in a total of nine sets. GO enrichment was conducted with g:Profiler (database version e99_eg46_p14_f929183) using alignments of differentially expressed protein models to both V. vinifera (Phytozome v12.1) and A. thaliana (TAIR11) as baseline annotations.
Arabidopsis thaliana was used as a representative model for pathway analysis in the Genemania application for Cytoscape v3.8.0 and the online STRING v11 resource (Szklarczyk et al., 2019). Vitis vinifera (NCBI taxon ID: 29760) (Smoot et al., 2011) was used similarly with STRINGDB v.11 in Cytoscape v2.7.1. Differentially expressed proteins for each pairwise comparison were used to visualize the fold change values in context of the supported pathways. Networks were constructed with a confidence score of 0.4 and 20 maximal additional interactions and additional networks for protein models reported to be responsive to calcium deficiency and aluminum biotoxicity were imported and merged.
AUTHOR CONTRIBUTIONS
SLM, NGS, JLW, PGS, and UUS conceived and designed various aspects of the study; JLW and NGS coordinated and managed the study; SLM, UUS, NGS, PGS, and AT‐T performed the sampling and experiments; AT‐T performed transcriptomic analysis; SLM performed the assembly, annotation, and related comparative genomic and expression analysis under the advisement of JLW; SLM and JLW wrote the manuscript; UUS, NGS, and AT‐T contributed sections. All authors read and approved the final manuscript.
CONFLICT OF INTEREST
The authors declare no conflicts of interest.
OPEN RESEARCH BADGES
This article has earned an Open Data and Open Materials badges. Data and materials are available at: Acer saccharum: BioProject: https://www.ncbi.nlm.nih.gov/bioproject/PRJNA748028. TreeGenes database: https://treegenesdb.org/org/Acer‐saccharum. Acer negundo: BioProject: https://www.ncbi.nlm.nih.gov/bioproject/PRJNA750066. TreeGenes database: https://treegenesdb.org/org/Acer‐negundo. Plant Computational Genomics, Acer Genomes Repository: 10.5281/zenodo.5801850.
Supporting information
Data S1. Assembly statistics.
Data S2. Annotation statistics.
Data S3. Collinearity analysis of recent peak in Ks plot of A. saccharum.
Data S4. HBEF differentially expressed genes.
Data S5. Significant gene family dynamics by species and genus.
Data S6. Significant rapidly evolving gene families by species.
Data S7. GO enrichment of contracted or missing gene families in A. negundo compared to Acer using longest overall gene.
Data S8. GO enrichment of contracted or missing gene families in A. negundo compared to Acer using longest Acer gene.
Data S9. GO enrichment of expanded or novel gene families in A. negundo compared to Acer using longest overall gene.
Data S10. GO enrichment of expanded or novel gene families in A. negundo compared to Acer using longest Acer gene.
Data S11. GO enrichment of contracted or missing gene families in A. saccharum compared to Acer using longest Acer gene.
Data S12. GO enrichment of contracted or missing gene families in A. saccharum compared to Acer using longest overall gene.
Data S13. GO enrichment of expanded or novel gene families in A. saccharum compared to Acer using longest Acer gene.
Data S14. A. saccharum verified missing genes.
Data S15. A. negundo verified missing genes.
Data S16. Gene family comparisons for HBEF DEG and Al tolerance genes.
Figure S1. Genome size estimation using k‐mer distribution analysis.
Figure S2. Hi‐C read mapping against scaffolds.
Figure S3. PCA clustering of expression results.
Figure S4. Syntenic comparisons between the three Acer genomes.
Table S1. Illumina, PacBio, and Hi‐C sequencing data summaries.
Table S2. Trees sampled at HBEF.
Table S3. GO enrichment of HBEF DEGs.
Table S4. OrthoFinder orthogroup statistics by species.
Table S5. GO enrichment of significant gene family dynamics.
Table S6. GO enrichment of rapidly evolving genes.
Table S7. HBEF Nutrient Perturbation treatment schedule.
ACKNOWLEDGMENTS
NGS was funded by the National Science Foundation (NSF DEB‐2029997; NSF EF‐1638488). Hi‐C library preparation and sequencing was funded by the Ronald Bamford Fund Endowment for Ecology and Evolutionary Biology to the Department of Ecology and Evolutionary Biology, University of Connecticut. Support for the HBEF RNA‐Seq analysis was provided by the University of Connecticut Center for Biological Risk. The authors would like to thank the Institute for Systems Genomics (ISG) at UConn for sequencing support, the Microbial Analysis Resources and Services (MARS) within the Center for Open Research Resources and Equipment (COR2E) at UConn for RNA extraction support, the Computational Biology Core for HPC services, and the HBEF for access to the NuPert plots. Thanks go to Laura Figueroa Corona for assistance with the range map and to Sumaira Zaman, Dr. Alison Scott, and Dr. Nasim Rahmatpour for sharing computational approaches and scripts. Thanks go to Dr. Yaowu Yuan for advice on both data analysis and the manuscript. The A. negundo individual sequenced is a part of the Smithsonian Environment Research Center Forest Dynamics Plot, which is part of the Smithsonian’s ForestGEO network. We thank ForestGEO and Director Stuart Davies for encouraging tree genome research in the network and for facilitating and funding (NSF DEB‐1046113; NSF DEB‐1545761) as well as previous working group discussions on the topic.
Contributor Information
Jill L. Wegrzyn, Email: jill.wegrzyn@uconn.edu.
Nathan G. Swenson, Email: nswenson@nd.edu.
DATA AVAILABILITY STATEMENT
For A. negundo, the genome, annotations, and RNA‐Seq data are available in BioProject PRJNA750066. Corresponding data for A. saccharum can be found in BioProject PRJNA748028. RNA‐Seq data used in the differential expression study are available in BioProject PRJNA751902. Full details on assembly, annotation, gene family analysis, and differential expression analysis can be found at https://doi.org/10.5281/zenodo.5801851.
REFERENCES
- Bal, T.L. , Storer, A.J. , Jurgensen, M.F. , Doskey, P.V. & Amacher, M.C. (2015) Nutrient stress predisposes and contributes to sugar maple dieback across its northern range: a review. Forestry: An International Journal of Forest Research, 88, 64–83. 10.1093/forestry/cpu051. [DOI] [Google Scholar]
- Bauknecht, M. & Kobbe, D. (2014) AtGEN1 and AtSEND1, two paralogs in Arabidopsis, possess holliday junction resolvase activity. Plant Physiology, 166(1), 202–216. Available from: 10.1104/pp.114.237834 [DOI] [PMC free article] [PubMed] [Google Scholar]
- Begum, H.H. , Osaki, M. , Watanabe, T. & Shinano, T. (2009) Mechanisms of aluminum tolerance in phosphoenolpyruvate carboxylase transgenic rice. Journal of Plant Nutrition, 32(1), 84–96. [Google Scholar]
- Berger, T.W. , Eagar, C. , Likens, G.E. & Stingeder, G. (2001) Effects of calcium and aluminum chloride additions on foliar and throughfall chemistry in sugar maples. Forest Ecology and Management, 149(1), 75–90. Available from: 10.1016/S0378-1127(00)00546-6 [DOI] [Google Scholar]
- Bishop, D.A. , Beier, C.M. , Pederson, N. , Lawrence, G.B. , Stella, J.C. & Sullivan, T.J. (2015) Regional growth decline of sugar maple (Acer saccharum) and its potential causes. Ecosphere, 6(10), art179. Available from: 10.1890/ES15-00260.1 [DOI] [Google Scholar]
- Blitzer, E.J. , Gibbs, J. , Park, M.G. & Danforth, B.N. (2016) Pollination services for apple are dependent on diverse wild bee communities. Agriculture, Ecosystems & Environment, 221, 1–7. Available from: 10.1016/j.agee.2016.01.004 [DOI] [Google Scholar]
- Caballero, M. & Wegrzyn, J. (2019) gFACs: gene filtering, analysis, and conversion to unify genome annotations across alignment and gene prediction frameworks. Genomics, Proteomics & Bioinformatics, 17(3), 305–310. Available from: 10.1016/j.gpb.2019.04.002 [DOI] [PMC free article] [PubMed] [Google Scholar]
- CABI (2021) Acer negundo. Invasive species. Compendium. Available at: https://www.cabi.org/ISC [Accessed 3 July 2021].
- Camacho, C. , Coulouris, G. , Avagyan, V. , Ma, N. , Papadopoulos, J. , Bealer, K. & Madden, T.L. (2009) BLAST+: architecture and applications. BMC Bioinformatics, 10(1), 421. Available from: 10.1186/1471-2105-10-421 [DOI] [PMC free article] [PubMed] [Google Scholar]
- Castro, B. , Citterico, M. , Kimura, S. , Stevens, D.M. , Wrzaczek, M. & Coaker, G. (2021) Stress‐induced reactive oxygen species compartmentalization, perception and signalling. Nature Plants, 7(4), 403–412. Available from: 10.1038/s41477-021-00887-0 [DOI] [PMC free article] [PubMed] [Google Scholar]
- Chen, P. , Sjogren, C.A. , Larsen, P.B. & Schnittger, A. (2019a) A multi‐level response to DNA damage induced by aluminium. The Plant Journal, 98(3), 479–491. Available from: 10.1111/tpj.14231 [DOI] [PMC free article] [PubMed] [Google Scholar]
- Chen, Z. , Lu, X. , Xuan, Y. , Tang, F. , Wang, J. , Shi, D. , Fu, S. & Ren, J. (2019b) Transcriptome analysis based on a combination of sequencing platforms provides insights into leaf pigmentation in Acer rubrum . BMC Plant Biology, 19(1), 240. Available from: 10.1186/s12870-019-1850-7 [DOI] [PMC free article] [PubMed] [Google Scholar]
- Chin, C.‐S. , Peluso, P. , Sedlazeck, F.J. , Nattestad, M. , Concepcion, G.T. , Clum, A. et al. (2016) Phased diploid genome assembly with single‐molecule real‐time sequencing. Nature Methods, 13(12), 1050–1054. Available from: 10.1038/nmeth.4035 [DOI] [PMC free article] [PubMed] [Google Scholar]
- Choudhury, F.K. , Rivero, R.M. , Blumwald, E. & Mittler, R. (2017) Reactive oxygen species, abiotic stress and stress combination. The Plant Journal, 90(5), 856–867. Available from: 10.1111/tpj.13299 [DOI] [PubMed] [Google Scholar]
- Cong, J. , Yang, Y. , Liu, X. , Lu, H. , Liu, X. , Zhou, J. et al. (2015) Analyses of soil microbial community compositions and functional genes reveal potential consequences of natural forest succession. Scientific Reports, 5(1), 1–11. Available from: 10.1038/srep10007 [DOI] [PMC free article] [PubMed] [Google Scholar]
- Contreras, R.N. & Shearer, K. (2018) Genome size, ploidy, and base composition of wild and cultivated Acer . Journal of the American Society for Horticultural Science, 143, 470–485. 10.21273/JASHS04541-18. [DOI] [Google Scholar]
- Darveau, M. , DesGranges, J.L. & Gauthier, G. (1992) Habitat use by three breeding insectivorous birds in declining maple forests. The Condor, 94(1), 72–82. Available from: 10.2307/1368797 [DOI] [Google Scholar]
- Dawson, T.E. & Ehleringer, J.R. (1993) Gender‐specific physiology, carbon isotope discrimination, and habitat distribution in Boxelder, Acer Negundo . Ecology, 74(3), 798–815. Available from: 10.2307/1940807 [DOI] [Google Scholar]
- Ding, C. , Lin, X. , Zuo, Y. , Yu, Z. , Baerson, S.R. , Pan, Z. et al. (2021) Transcription factor OsbZIP49 controls tiller angle and plant architecture through the induction of indole‐3‐acetic acid‐amido synthetases in rice. The Plant Journal, 108(5), 1346–1364. Available from: 10.1111/tpj.15515 [DOI] [PubMed] [Google Scholar]
- Ding, X. , Cao, Y. , Huang, L. , Zhao, J. , Xu, C. , Li, X. et al. (2008) Activation of the indole‐3‐acetic acid–amido synthetase GH3‐8 suppresses expansin expression and promotes salicylate‐ and jasmonate‐independent basal immunity in rice. The Plant Cell, 20(1), 228–240. Available from: 10.1105/tpc.107.055657 [DOI] [PMC free article] [PubMed] [Google Scholar]
- Domingo, C. , Andrés, F. , Tharreau, D. , Iglesias, D.J. & Talón, M. (2009) Constitutive expression of OsGH3.1 reduces auxin content and enhances defense response and resistance to a fungal pathogen in rice. Molecular Plant‐Microbe Interactions, 22(2), 201–210. Available from: 10.1094/MPMI-22-2-0201 [DOI] [PubMed] [Google Scholar]
- Donaldson, J.G. & Jackson, C.L. (2011) ARF family G proteins and their regulators: roles in membrane transport, development and disease. Nature Reviews. Molecular Cell Biology, 12(6), 362–375. Available from: 10.1038/nrm3117 [DOI] [PMC free article] [PubMed] [Google Scholar]
- Du, Q. , Wang, L. , Zhou, D. , Yang, H. , Gong, C. , Pan, W. et al. (2014) Allelic variation within the S‐adenosyl‐l‐homocysteine hydrolase gene family is associated with wood properties in Chinese white poplar (Populus tomentosa). BMC Genetics, 15(1), S4. Available from: 10.1186/1471-2156-15-S1-S4 [DOI] [PMC free article] [PubMed] [Google Scholar]
- Dudchenko, O. , Batra, S.S. , Omer, A.D. , Nyquist, S.K. , Hoeger, M. , Durand, N.C. et al. (2017) De novo assembly of the Aedes aegypti genome using Hi‐C yields chromosome‐length scaffolds. Science, 356(6333), 92–95. Available from: 10.1126/science.aal3327 [DOI] [PMC free article] [PubMed] [Google Scholar]
- Dudchenko, O. , Shamim, M.S. , Batra, S.S. , Durand, N.C. , Musial, N.T. , Mostofa, R. et al. (2018) The Juicebox Assembly Tools module facilitates de novo assembly of mammalian genomes with chromosome‐length scaffolds for under $1000. BioRxiv, 254797. Available from: 10.1101/254797 [DOI] [Google Scholar]
- Durand, N.C. , Robinson, J.T. , Shamim, M.S. , Machol, I. , Mesirov, J.P. , Lander, E.S. et al. (2016a) Juicebox provides a visualization system for Hi‐C contact maps with unlimited zoom. Cell Systems, 3(1), 99–101. Available from: 10.1016/j.cels.2015.07.012 [DOI] [PMC free article] [PubMed] [Google Scholar]
- Durand, N.C. , Shamim, M.S. , Machol, I. , Rao, S.S.P. , Huntley, M.H. , Lander, E.S. et al. (2016b) Juicer provides a one‐click system for analyzing loop‐resolution Hi‐C experiments. Cell Systems, 3(1), 95–98. Available from: 10.1016/j.cels.2016.07.002 [DOI] [PMC free article] [PubMed] [Google Scholar]
- Edgar, R.C. (2010) Search and clustering orders of magnitude faster than BLAST. Bioinformatics, 26(19), 2460–2461. Available from: 10.1093/bioinformatics/btq461 [DOI] [PubMed] [Google Scholar]
- Emerman, S.H. & Dawson, T.E. (1996) Hydraulic lift and its influence on the water content of the rhizosphere: an example from sugar maple, Acer saccharum . Oecologia, 108, 273–278. [DOI] [PubMed] [Google Scholar]
- Emms, D.M. & Kelly, S. (2018) OrthoFinder2: fast and accurate phylogenomic orthology analysis from gene sequences. BioRxiv, 466201. Available from: 10.1101/466201 [DOI] [Google Scholar]
- Enquist, B. , Condit, R. , Peet, R. , Schildhauer, M. & Thiers, B. (2016) Cyberinfrastructure for an integrated botanical information network to investigate the ecological impacts of global climate change on plant biodiversity. PeerJ Preprints 4: E2615v2. International Journal of Climatology, 37, 4302–4315. [Google Scholar]
- Estravis‐Barcala, M. , Mattera, M.G. , Soliani, C. , Bellora, N. , Opgenoorth, L. , Heer, K. et al. (2020) Molecular bases of responses to abiotic stress in trees. Journal of Experimental Botany, 71(13), 3765–3779. Available from: 10.1093/jxb/erz532 [DOI] [PMC free article] [PubMed] [Google Scholar]
- Faust, G.G. & Hall, I.M. (2014) SAMBLASTER: fast duplicate marking and structural variant read extraction. Bioinformatics, 30(17), 2503–2505. Available from: 10.1093/bioinformatics/btu314 [DOI] [PMC free article] [PubMed] [Google Scholar]
- Flynn, J.M. , Hubley, R. , Goubert, C. , Rosen, J. , Clark, A.G. , Feschotte, C. et al. (2020) RepeatModeler2 for automated genomic discovery of transposable element families. Proceedings of the National Academy of Sciences of the United States of America, 117(17), 9451–9457. Available from: 10.1073/pnas.1921046117 [DOI] [PMC free article] [PubMed] [Google Scholar]
- Genome Assembly Cookbook . (2019) DNA zoo. Available at: https://www.dnazoo.org/methods [Accessed 4 July 2021].
- Giese, R.L., , Houston, D.R. , Benjamin, D.M. & Kuntz J.E. (1964) Studies of maple blight. In: Research Bulletin 250. Madison, IA: Wisconsin and Purdue Agricultural Experiment Station, University of Wisconsin, pp. 1–129. [Google Scholar]
- Godman, R.M. , Yawney, H.W. & Tubbs, C.H. (1990) Acer saccharum Marsh, sugar maple. Silvics of North America, 2, 678. [Google Scholar]
- Grabherr, M.G. , Haas, B.J. , Yassour, M. , Levin, J.Z. , Thompson, D.A. , Amit, I. et al. (2011) Full‐length transcriptome assembly from RNA‐Seq data without a reference genome. Nature Biotechnology, 29(7), 644–652. Available from: 10.1038/nbt.1883 [DOI] [PMC free article] [PubMed] [Google Scholar]
- Gremme, G. , Brendel, V. , Sparks, M.E. & Kurtz, S. (2005) Engineering a software tool for gene structure prediction in higher organisms. Information and Software Technology, 47(15), 965–978. Available from: 10.1016/j.infsof.2005.09.005 [DOI] [Google Scholar]
- Halman, J.M. , Schaberg, P.G. , Hawley, G.J. , Hansen, C.F. & Fahey, T.J. (2015) Differential impacts of calcium and aluminum treatments on sugar maple and American beech growth dynamics. Canadian Journal of Forest Research, 45(1), 52–59. Available from: 10.1139/cjfr-2014-0250 [DOI] [Google Scholar]
- Halman, J.M. , Schaberg, P.G. , Hawley, G.J. , Pardo, L.H. & Fahey, T.J. (2013) Calcium and aluminum impacts on sugar maple physiology in a northern hardwood forest. Tree Physiology, 33(11), 1242–1251. Available from: 10.1093/treephys/tpt099 [DOI] [PubMed] [Google Scholar]
- Hart, A.J. , Ginzburg, S. , Xu, M. (Sam), Fisher, C.R. , Rahmatpour, N. , Mitton, J.B. et al. (2020) EnTAP: bringing faster and smarter functional annotation to non‐model eukaryotic transcriptomes. Molecular Ecology Resources, 20(2), 591–604. Available from: 10.1111/1755-0998.13106 [DOI] [PubMed] [Google Scholar]
- Hasan, M.K. , Cheng, Y. , Kanwar, M.K. , Chu, X.‐Y. , Ahammed, G.J. & Qi, Z.‐Y. (2017) Responses of plant proteins to heavy metal stress—a review. Frontiers in Plant Science, 8, 1492. Available from: 10.3389/fpls.2017.01492 [DOI] [PMC free article] [PubMed] [Google Scholar]
- Hasanuzzaman, M. , Nahar, K. , Anee, T.I. , Fujita, M. (2017) Glutathione in plants: biosynthesis and physiological role in environmental stress tolerance. Physiology and Molecular Biology of Plants, 23(2), 249–268. Available from: 10.1007/s12298-017-0422-2 [DOI] [PMC free article] [PubMed] [Google Scholar]
- He, F. , Pan, Q.‐H. , Shi, Y. & Duan, C.‐Q. (2008) Biosynthesis and genetic regulation of proanthocyanidins in plants. Molecules, 13(10), 2674–2703. Available from: 10.3390/molecules13102674 [DOI] [PMC free article] [PubMed] [Google Scholar]
- Helliwell, C.A. , Chandler, P.M. , Poole, A. , Dennis, E.S. & Peacock, W.J. (2001) The CYP88A cytochrome P450, ent‐kaurenoic acid oxidase, catalyzes three steps of the gibberellin biosynthesis pathway. Proceedings of the National Academy of Sciences of the United States of America, 98(4), 2065–2070. Available from: 10.1073/pnas.98.4.2065 [DOI] [PMC free article] [PubMed] [Google Scholar]
- Hendrix, S. , Keunen, E. , Mertens, A.I.G. , Beemster, G.T.S. , Vangronsveld, J. & Cuypers, A. (2018) Cell cycle regulation in different leaves of Arabidopsis thaliana plants grown under control and cadmium‐exposed conditions. Environmental and Experimental Botany, 155, 441–452. Available from: 10.1016/j.envexpbot.2018.06.026 [DOI] [Google Scholar]
- Hoff, K.J. , Lomsadze, A. , Borodovsky, M. & Stanke, M. (2019) Whole‐genome annotation with BRAKER. In: Gene prediction,. New York, NY: Humana, pp. 65–95. Available from: 10.1007/978-1-4939-9173-0_5 [DOI] [PMC free article] [PubMed] [Google Scholar]
- Horsley, S.B. , Long, R.P. , Bailey, S.W. , Hallett, R.A. & Wargo, P.M. (2002) Health of eastern North American sugar maple forests and factors affecting decline. Northern Journal of Applied Forestry, 19(1), 34–44. Available from: 10.1093/njaf/19.1.34 [DOI] [Google Scholar]
- Hu, B. , Wang, N. , Bi, X. , Karaaslan, E. S. , Weber, A.‐L. , Zhu, W. et al. (2019) Plant lamin‐like proteins mediate chromatin tethering at the nuclear periphery. Genome Biology, 20(1), 87. Available from: 10.1186/s13059-019-1694-3 [DOI] [PMC free article] [PubMed] [Google Scholar]
- Huang, S. , Chen, Z. , Huang, G. , Yu, T. , Yang, P. , Li, J. et al. (2012) HaploMerger: reconstructing allelic relationships for polymorphic diploid genome assemblies. Genome Research, 22(8), 1581–1588. Available from: 10.1101/gr.133652.111 [DOI] [PMC free article] [PubMed] [Google Scholar]
- Jasinski, S. , Fabrissin, I. , Masson, A. , Marmagne, A. , Lécureuil, A. , Bill, L. et al. (2021) ACCELERATED CELL DEATH 6 acts on natural leaf senescence and nitrogen fluxes in Arabidopsis. Frontiers in Plant Science, 11, 611170. Available from: 10.3389/fpls.2020.611170 [DOI] [PMC free article] [PubMed] [Google Scholar]
- Jockusch, S. & Kräutler, B. (2020) The red chlorophyll catabolite (RCC) is an inefficient sensitizer of singlet oxygen – photochemical studies of the methyl ester of RCC. Photochemical & Photobiological Sciences, 19(5), 668–673. Available from: 10.1039/D0PP00071J [DOI] [PubMed] [Google Scholar]
- Julius, B.T. , Leach, K.A. , Tran, T.M. , Mertz, R.A. & Braun, D.M. (2017) Sugar transporters in plants: new insights and discoveries. Plant and Cell Physiology, 58(9), 1442–1460. Available from: 10.1093/pcp/pcx090 [DOI] [PubMed] [Google Scholar]
- Kar, D. , Pradhan, A.A. & Datta, S. (2021) The role of solute transporters in aluminum toxicity and tolerance. Physiologia Plantarum, 171(4), 638–652. Available from: 10.1111/ppl.13214 [DOI] [PubMed] [Google Scholar]
- Kim, D. , Langmead, B. & Salzberg, S. L. (2015) HISAT: a fast spliced aligner with low memory requirements. Nature Methods, 12(4), 357–360. Available from: 10.1038/nmeth.3317 [DOI] [PMC free article] [PubMed] [Google Scholar]
- Kolmogorov, M. , Yuan, J. , Lin, Y. & Pevzner, P.A. (2019) Assembly of long, error‐prone reads using repeat graphs. Nature biotechnology, 37(5), 540–546. Available at: 10.1038/s41587-019-0072-8 [DOI] [PubMed] [Google Scholar]
- Koren, S. , Walenz, B.P. , Berlin, K. , Miller, J.R. , Bergman, N.H. & Phillippy, A.M. (2017) Canu: scalable and accurate long‐read assembly via adaptive k‐mer weighting and repeat separation. Genome Research, 27(5), 722–736. Available from: 10.1101/gr.215087.116 [DOI] [PMC free article] [PubMed] [Google Scholar]
- Lamarque, L.J. , Lortie, C.J. , Porté, A.J. & Delzon, S. (2015) Genetic differentiation and phenotypic plasticity in life‐history traits between native and introduced populations of invasive maple trees. Biological Invasions, 17(4), 1109–1122. Available from: 10.1007/s10530-014-0781-3 [DOI] [Google Scholar]
- Lamarque, L.J. , Porté, A.J. , Eymeric, C. , Lasnier, J.‐B. , Lortie, C.J. & Delzon, S. (2013) A test for pre‐adapted phenotypic plasticity in the invasive tree Acer negundo L. PLoS One, 8(9), e74239. Available from: 10.1371/journal.pone.0074239 [DOI] [PMC free article] [PubMed] [Google Scholar]
- Lang, L. & Schnittger, A. (2020) Endoreplication—a means to an end in cell growth and stress response. Current Opinion in Plant Biology, 54, 85–92. Available from: 10.1016/j.pbi.2020.02.006 [DOI] [PubMed] [Google Scholar]
- Leitch, I.J. , Johnston, E. , Pellicer, J. , Hidalgo, O. & Bennett, M. (2019) Angiosperm DNA C‐values database (release 9.0, Apr 2019) . Available at: https://cvalues.science.kew.org/search [Accessed 5 July 2020].
- Li, H. (2018) Minimap2: pairwise alignment for nucleotide sequences. Bioinformatics, 34(18), 3094–3100. Available from: 10.1093/bioinformatics/bty191 [DOI] [PMC free article] [PubMed] [Google Scholar]
- Li, L.‐S. , Ying, J. , Li, E. , Ma, T. , Li, M. , Gong, L.‐M. et al. (2021a) Arabidopsis CBP60b is a central transcriptional activator of immunity. Plant Physiology, 186(3), 1645–1659. Available from: 10.1093/plphys/kiab164 [DOI] [PMC free article] [PubMed] [Google Scholar]
- Li, N. , Meng, H. , Xing, H. , Liang, L. , Zhao, X. & Luo, K. (2017) Genome‐wide analysis of MATE transporters and molecular characterization of aluminum resistance in Populus . Journal of Experimental Botany, 68(20), 5669–5683. Available from: 10.1093/jxb/erx370 [DOI] [PMC free article] [PubMed] [Google Scholar]
- Li, X. , Mao, X. , Xu, Y. , Li, Y. , Zhao, N. , Yao, J. et al. (2021b) Comparative transcriptomic analysis reveals the coordinated mechanisms of Populus × canadensis ‘Neva’ leaves in response to cadmium stress. Ecotoxicology and Environmental Safety, 216, 112179. Available from: 10.1016/j.ecoenv.2021.112179 [DOI] [PubMed] [Google Scholar]
- Liang, S.C. , Hartwig, B. , Perera, P. , Mora‐García, S. , de Leau, E. , Thornton, H. et al. (2015) Kicking against the PRCs – a domesticated transposase antagonises silencing mediated by polycomb group proteins and is an accessory component of polycomb repressive complex 2. PLoS Genetics, 11(12), e1005660. Available from: 10.1371/journal.pgen.1005660 [DOI] [PMC free article] [PubMed] [Google Scholar]
- Likens, G.E. & Bormann, F.H. (1974) Acid rain: a serious regional environmental problem. Science, 184(4142), 1176–1179. Available from: 10.1126/science.184.4142.1176 [DOI] [PubMed] [Google Scholar]
- Likens, G.E. , Driscoll, C.T. , Buso, D.C. , Siccama, T.G. , Johnson, C.E. , Lovett, G.M. , et al. (1998) The biogeochemistry of calcium at Hubbard Brook. Biogeochemistry, 41(2), 89–173. Available from: 10.1023/A:1005984620681 [DOI] [Google Scholar]
- Likens, G.E. & Lambert, K.F. (1998) The importance of long‐term data in addressing regional environmental issues. Northeastern Naturalist, 5(2), 127–136. Available from: 10.2307/3858583 [DOI] [Google Scholar]
- Liu, Z. , Chen, G. , Gao, F. , Xu, R. , Li, N. , Zhang, Y. et al. (2019) Transcriptional repression of the APC/C activator genes cCS52A1/A2 by the mediator complex subunit MED16 controls endoreduplication and cell growth in Arabidopsis. The Plant Cell, 31(8), 1899–1912. Available from: 10.1105/tpc.18.00811 [DOI] [PMC free article] [PubMed] [Google Scholar]
- Lomsadze, A. , Burns, P.D. & Borodovsky, M. (2014) Integration of mapped RNA‐Seq reads into automatic training of eukaryotic gene finding algorithm. Nucleic Acids Research, 42(15), e119. Available from: 10.1093/nar/gku557 [DOI] [PMC free article] [PubMed] [Google Scholar]
- Long, R.P. , Horsley, S.B. , Bailey, S.W. , Hallett, R.A. & Hall, T.J. (2019) Sugar maple decline and lessons learned about Allegheny Plateau soils and landscapes. In: Stout, S.L. (Eds.) SILVAH: 50 years of science‐management cooperation. Proceedings of the sllegheny society of American foresters training session. 2017 September 20–22; Clarion, PA: Gen. Tech. Rep. NRS‐P‐186 Newtown Square: U.S. Department of Agriculture, Forest Service, Northern Research Station, pp. 80–97. 10.2737/NRS-GTR-P-186-Paper8 [DOI] [Google Scholar]
- Love, M. , Anders, S. & Huber, W. (2014) Differential analysis of count data–the DESeq2 package. Genome Biology, 15, 550. [DOI] [PMC free article] [PubMed] [Google Scholar]
- Lucash, M.S. , Yanai, R.D. , Blum, J.D. & Park, B.B. (2012) Foliar nutrient concentrations related to soil sources across a range of sites in the northeastern United States. Soil Science Society of America Journal, 76(2), 674–683. Available from: 10.2136/sssaj2011.0160 [DOI] [Google Scholar]
- Ludwig‐Müller, J. (2011) Auxin conjugates: their role for plant development and in the evolution of land plants. Journal of Experimental Botany, 62(6), 1757–1773. Available from: 10.1093/jxb/erq412 [DOI] [PubMed] [Google Scholar]
- Luo, J. , Zhou, J. , Li, H. , Shi, W. , Polle, A. , Lu, M. et al. (2015) Global poplar root and leaf transcriptomes reveal links between growth and stress responses under nitrogen starvation and excess. Tree Physiology, 35(12), 1283–1302. Available from: 10.1093/treephys/tpv091 [DOI] [PubMed] [Google Scholar]
- Ma, Q. , Sun, T. , Li, S. , Wen, J. , Zhu, L. , Yin, T. et al. (2020) The Acer truncatum genome provides insights into nervonic acid biosynthesis. The Plant Journal, 104(3), 662–678. Available from: 10.1111/tpj.14954 [DOI] [PMC free article] [PubMed] [Google Scholar]
- Mach, J.M. , Castillo, A.R. , Hoogstraten, R. & Greenberg, J.T. (2001) The Arabidopsis‐accelerated cell death gene ACD2 encodes red chlorophyll catabolite reductase and suppresses the spread of disease symptoms. Proceedings of the National Academy of Sciences of the United States of America, 98(2), 771–776. Available from: 10.1073/pnas.98.2.771 [DOI] [PMC free article] [PubMed] [Google Scholar]
- Maitner, B.S. , Boyle, B. , Casler, N. , Condit, R. , Donoghue, J. , Durán, S.M. et al. (2018) The bien r package: a tool to access the Botanical Information and Ecology Network (BIEN) database. Methods in Ecology and Evolution, 9(2), 373–379. Available from: 10.1111/2041-210X.12861 [DOI] [Google Scholar]
- Mekawy, A.M.M. , Assaha, D.V.M. , Munehiro, R. , Kohnishi, E. , Nagaoka, T. , Ueda, A. et al. (2018) Characterization of type 3 metallothionein‐like gene (OsMT‐3a) from rice, revealed its ability to confer tolerance to salinity and heavy metal stresses. Environmental and Experimental Botany, 147, 157–166. Available from: 10.1016/j.envexpbot.2017.12.002 [DOI] [Google Scholar]
- Mendes, F.K. , Vanderpool, D. , Fulton, B. & Hahn, M.W. (2020) CAFE 5 models variation in evolutionary rates among gene families. Bioinformatics, 36(22–23), 5516–5518. Available from: 10.1093/bioinformatics/btaa1022 [DOI] [PubMed] [Google Scholar]
- Miao, H. , Sun, P. , Liu, Q. , Miao, Y. , Liu, J. , Zhang, K. et al. (2017) Genome‐wide analyses of SWEET family proteins reveal involvement in fruit development and abiotic/biotic stress responses in banana. Scientific Reports, 7(1), 3536. Available from: 10.1038/s41598-017-03872-w [DOI] [PMC free article] [PubMed] [Google Scholar]
- Mohamed, H.K. , Pathak, S. , Roy, D.N. , Hutchinson, T.C. , McLaughlin, D.L. & Kinch, J.C. (1997) Relationship between sugar maple decline and corresponding chemical changes in the stem tissue. Water, Air, and Soil Pollution, 96(1), 321–327. Available from: 10.1023/A:1026429122530 [DOI] [Google Scholar]
- Moore, J.‐D. & Ouimet, R. (2021) Liming still positively influences sugar maple nutrition, vigor and growth, 20 years after a single application. Forest Ecology and Management, 490, 119103. Available from: 10.1016/j.foreco.2021.119103 [DOI] [Google Scholar]
- Naslavsky, N. & Caplan, S. (2005) C‐terminal EH‐domain‐containing proteins: consensus for a role in endocytic trafficking, EH? Journal of Cell Science, 118(18), 4093–4101. Available from: 10.1242/jcs.02595 [DOI] [PubMed] [Google Scholar]
- Nisa, M.‐U. , Huang, Y. , Benhamed, M. & Raynaud, C. (2019) The plant DNA damage response: signaling pathways leading to growth inhibition and putative role in response to stress conditions. Frontiers in Plant Science, 10, 653. Available from: 10.3389/fpls.2019.00653 [DOI] [PMC free article] [PubMed] [Google Scholar]
- Nkongolo, K. , Theriault, G. & Michael, P. (2018) Nickel‐induced global gene expressions in red maple (Acer rubrum): effect of nickel concentrations. Plant Gene, 14, 29–36. Available from: 10.1016/j.plgene.2018.04.003 [DOI] [Google Scholar]
- Nowell, R.W. , Almeida, P. , Wilson, C.G. , Smith, T.P. , Fontaneto, D. , Crisp, A. et al. (2018) Comparative genomics of bdelloid rotifers: insights from desiccating and nondesiccating species. PLoS Biology, 16(4), e2004830. Available from: 10.1371/journal.pbio.2004830 [DOI] [PMC free article] [PubMed] [Google Scholar]
- Oswald, E.M. , Pontius, J. , Rayback, S.A. , Schaberg, P.G. , Wilmot, S.H. & Dupigny‐Giroux, L.‐A. (2018) The complex relationship between climate and sugar maple health: climate change implications in Vermont for a key northern hardwood species. Forest Ecology and Management, 422, 303–312. Available from: 10.1016/j.foreco.2018.04.014 [DOI] [Google Scholar]
- Park, J.‐E. , Park, J.‐Y. , Kim, Y.‐S. , Staswick, P.E. , Jeon, J. , Yun, J. et al. (2007) GH3‐mediated auxin homeostasis links growth regulation with stress adaptation response in Arabidopsis. Journal of Biological Chemistry, 282(13), 10036–10046. Available from: 10.1074/jbc.M610524200 [DOI] [PubMed] [Google Scholar]
- Pellicer, J. , Hidalgo, O. , Dodsworth, S. & Leitch, I.J. (2018) Genome size diversity and its impact on the evolution of land plants. Genes, 9(2), 88. Available from: 10.3390/genes9020088 [DOI] [PMC free article] [PubMed] [Google Scholar]
- Pertea, G., & Pertea, M. (2020) GFF utilities: GffRead and GffCompare . F1000Research, 9:304 Available at: https://doi.org/10.12688/F1000RESEARCH.23297.2 [DOI] [PMC free article] [PubMed] [Google Scholar]
- Porté, A.J. , Lamarque, L.J. , Lortie, C.J. , Michalet, R. & Delzon, S. (2011) Invasive Acer negundo outperforms native species in non‐limiting resource environments due to its higher phenotypic plasticity. BMC Ecology, 11(1), 28. Available from: 10.1186/1472-6785-11-28 [DOI] [PMC free article] [PubMed] [Google Scholar]
- Pyšek, P. , Skálová, H. , Čuda, J. , Guo, W.‐Y. , Suda, J. , Doležal, J. et al. (2018) Small genome separates native and invasive populations in an ecologically important cosmopolitan grass. Ecology, 99(1), 79–90. Available from: 10.1002/ecy.2068 [DOI] [PubMed] [Google Scholar]
- Qiao, X. , Li, Q. , Yin, H. , Qi, K. , Li, L. , Wang, R. et al. (2019) Gene duplication and evolution in recurring polyploidization–diploidization cycles in plants. Genome Biology, 20(1), 38. Available from: 10.1186/s13059-019-1650-2 [DOI] [PMC free article] [PubMed] [Google Scholar]
- Raudvere, U. , Kolberg, L. , Kuzmin, I. , Arak, T. , Adler, P. , Peterson, H. et al. (2019) g:Profiler: a web server for functional enrichment analysis and conversions of gene lists (2019 update). Nucleic Acids Research, 47(W1), W191–W198. Available from: 10.1093/nar/gkz369 [DOI] [PMC free article] [PubMed] [Google Scholar]
- Renner, S.S. , Beenken, L. , Grimm, G.W. , Kocyan, A. & Ricklefs, R.E. (2007) The evolution of dioecy, heterodichogamy, and labile sex expression in Acer . Evolution, 61(11), 2701–2719. Available from: 10.1111/j.1558-5646.2007.00221.x [DOI] [PubMed] [Google Scholar]
- Rizza, A. , Boccaccini, A. , Lopez‐Vidriero, I. , Costantino, P. & Vittorioso, P. (2011) Inactivation of the ELIP1 and ELIP2 genes affects Arabidopsis seed germination. New Phytologist, 190(4), 896–905. Available from: 10.1111/j.1469-8137.2010.03637.x [DOI] [PubMed] [Google Scholar]
- Roach, M.J. , Schmidt, S.A. & Borneman, A.R. (2018) Purge haplotigs: allelic contig reassignment for third‐gen diploid genome assemblies. BMC Bioinformatics, 19(1), 460. Available from: 10.1186/s12859-018-2485-7 [DOI] [PMC free article] [PubMed] [Google Scholar]
- Roddy, A.B. , Théroux‐Rancourt, G. , Abbo, T. , Benedetti, J.W. , Brodersen, C.R. , Castro, M. et al. (2019) The scaling of genome size and cell size limits maximum rates of photosynthesis with implications for ecological strategies. International Journal of Plant Sciences, 181(1), 75–87. Available from: 10.1086/706186 [DOI] [Google Scholar]
- Rogers, B.M. , Jantz, P. & Goetz, S.J. (2017) Vulnerability of eastern US tree species to climate change. Global Change Biology, 23(8), 3302–3320. Available from: 10.1111/gcb.13585 [DOI] [PubMed] [Google Scholar]
- Sade, H. , Meriga, B. , Surapu, V. , Gadi, J. , Sunita, M.S.L. , Suravajhala, P. et al. (2016) Toxicity and tolerance of aluminum in plants: tailoring plants to suit to acid soils. Biometals, 29(2), 187–210. Available from: 10.1007/s10534-016-9910-z [DOI] [PubMed] [Google Scholar]
- Sakamoto, A.N. (2019) Translesion synthesis in plants: ultraviolet resistance and beyond. Frontiers in Plant Science, 10, 1208. Available from: 10.3389/fpls.2019.01208 [DOI] [PMC free article] [PubMed] [Google Scholar]
- Shi, X. , Sun, H. , Chen, Y. , Pan, H. & Wang, S. (2016) Transcriptome sequencing and expression analysis of cadmium (Cd) transport and detoxification related genes in Cd‐accumulating Salix integra . Frontiers in Plant Science, 7, 1577. Available from: 10.3389/fpls.2016.01577 [DOI] [PMC free article] [PubMed] [Google Scholar]
- Smit, A. , Hubley, R. & Green, P. (2013) RepeatMasker Open‐4.0 . Available at: http://www.repeatmasker.org [Accessed 23 July 2019].
- Smoot, M.E. , Ono, K. , Ruscheinski, J. , Wang, P.‐L. & Ideker, T. (2011) Cytoscape 2.8: new features for data integration and network visualization. Bioinformatics, 27(3), 431–432. Available from: 10.1093/bioinformatics/btq675 [DOI] [PMC free article] [PubMed] [Google Scholar]
- Sork, V.L. , Fitz‐Gibbon, S.T. , Puiu, D. , Crepeau, M. , Gugger, P.F. , Sherman, R. et al. (2016) First Draft assembly and annotation of the genome of a California endemic oak Quercus lobata Née (Fagaceae). G3: Genes, Genomes, Genetics, 6(11), 3485–3495. Available from: 10.1534/g3.116.030411 [DOI] [PMC free article] [PubMed] [Google Scholar]
- Stafford, H.A. (1988) Proanthocyanidins and the lignin connection. Phytochemistry, 27(1), 1–6. Available from: 10.1016/0031-9422(88)80583-1 [DOI] [Google Scholar]
- Stanke, M. , Diekhans, M. , Baertsch, R. & Haussler, D. (2008) Using native and syntenically mapped cDNA alignments to improve de novo gene finding. Bioinformatics, 24(5), 637–644. Available from: 10.1093/bioinformatics/btn013 [DOI] [PubMed] [Google Scholar]
- Stanke, M. , Schöffmann, O. , Morgenstern, B. & Waack, S. (2006) Gene prediction in eukaryotes with a generalized hidden Markov model that uses hints from external sources. BMC Bioinformatics, 7(1), 62. Available from: 10.1186/1471-2105-7-62 [DOI] [PMC free article] [PubMed] [Google Scholar]
- Staton, M. , Best, T. , Khodwekar, S. , Owusu, S. , Xu, T. , Xu, Y. et al. (2015) Preliminary genomic characterization of ten hardwood tree species from multiplexed low coverage whole genome sequencing. PLoS One, 10(12), e0145031. Available from: 10.1371/journal.pone.0145031 [DOI] [PMC free article] [PubMed] [Google Scholar]
- Stevens, R. , Grelon, M. , Vezon, D. , Oh, J. , Meyer, P. , Perennes, C. et al. (2004) A CDC45 homolog in Arabidopsis is essential for meiosis, as shown by RNA interference‐induced gene silencing. The Plant Cell, 16(1), 99–113. Available from: 10.1105/tpc.016865 [DOI] [PMC free article] [PubMed] [Google Scholar]
- Suda, J. , Meyerson, L. A. , Leitch, I. J. & Pyšek, P. (2015) The hidden side of plant invasions: The role of genome size. New Phytologist, 205(3), 994–1007. Available from: 10.1111/nph.13107 [DOI] [PubMed] [Google Scholar]
- Sullivan, T.J. , Lawrence, G.B. , Bailey, S.W. , McDonnell, T.C. , Beier, C.M. , Weathers, K.C. et al. (2013) Effects of acidic deposition and soil acidification on sugar maple trees in the Adirondack mountains, New York. Environmental Science & Technology, 47(22), 12687–12694. Available from: 10.1021/es401864w [DOI] [PubMed] [Google Scholar]
- Sun, M. , Li, H. , Li, Y. , Xiang, H. , Liu, Y. , He, Y. et al. (2020) Tomato YABBY2b controls plant height through regulating indole‐3‐acetic acid‐amido synthetase (GH3.8) expression. Plant Science, 297, 110530. Available from: 10.1016/j.plantsci.2020.110530 [DOI] [PubMed] [Google Scholar]
- Sun, X.‐L. , Yu, Q.‐Y. , Tang, L.‐L. , Ji, W. , Bai, X. , Cai, H. et al. (2013) GsSRK, a G‐type lectin S‐receptor‐like serine/threonine protein kinase, is a positive regulator of plant tolerance to salt stress. Journal of Plant Physiology, 170(5), 505–515. Available from: 10.1016/j.jplph.2012.11.017 [DOI] [PubMed] [Google Scholar]
- Szklarczyk, D. , Gable, A.L. , Lyon, D. , Junge, A. , Wyder, S. , Huerta‐Cepas, J. et al. (2019) STRING v11: protein‐protein association networks with increased coverage, supporting functional discovery in genome‐wide experimental datasets. Nucleic Acids Research, 47(D1), D607–D613. Available from: 10.1093/nar/gky1131 [DOI] [PMC free article] [PubMed] [Google Scholar]
- Tang, H. , Bowers, J. E. , Wang, X. , Ming, R. , Alam, M. & Paterson, A. H. (2008) Synteny and collinearity in plant genomes. Science, 320(5875), 486–488. Available from: 10.1126/science.1153917 [DOI] [PubMed] [Google Scholar]
- Theriault, G. , Michael, P. & Nkongolo, K. (2016) Comprehensive transcriptome analysis of response to nickel stress in white birch (Betula papyrifera). PLoS One, 11(4), e0153762. Available from: 10.1371/journal.pone.0153762 [DOI] [PMC free article] [PubMed] [Google Scholar]
- Tian, J. & Kong, Z. (2019) The role of the augmin complex in establishing microtubule arrays. Journal of Experimental Botany, 70(12), 3035–3041. Available from: 10.1093/jxb/erz123 [DOI] [PubMed] [Google Scholar]
- Tommasini, R. , Vogt, E. , Fromenteau, M. , Hörtensteiner, S. , Matile, P. , Amrhein, N. et al. (1998) An ABC‐transporter of Arabidopsis thaliana has both glutathione‐conjugate and chlorophyll catabolite transport activity. The Plant Journal, 13(6), 773–780. Available from: 10.1046/j.1365-313X.1998.00076.x [DOI] [PubMed] [Google Scholar]
- Toyota, M. , Spencer, D. , Sawai‐Toyota, S. , Jiaqi, W. , Zhang, T. , Koo, A.J. et al. (2018) Glutamate triggers long‐distance, calcium‐based plant defense signaling. Science, 361(6407), 1112–1115. Available from: 10.1126/science.aat7744 [DOI] [PubMed] [Google Scholar]
- Trávníček, P. , Čertner, M. , Ponert, J. , Chumová, Z. , Jersáková, J. & Suda, J. (2019) Diversity in genome size and GC content shows adaptive potential in orchids and is closely linked to partial endoreplication, plant life‐history traits and climatic conditions. New Phytologist, 224(4), 1642–1656. Available from: 10.1111/nph.15996 [DOI] [PubMed] [Google Scholar]
- Tuskan, G.A. , DiFazio, S. , Jansson, S. , Bohlmann, J. , Grigoriev, I. , Hellsten, U. et al. (2006) The genome of black cottonwood, Populus trichocarpa (Torr. & Gray). Science, 313(5793), 1596–1604. Available from: 10.1126/science.1128691 [DOI] [PubMed] [Google Scholar]
- Van Bel, M. , Bucchini, F. & Vandepoele, K. (2019) Gene space completeness in complex plant genomes. Current Opinion in Plant Biology, 48, 9–17. Available from: 10.1016/j.pbi.2019.01.001 [DOI] [PubMed] [Google Scholar]
- Veeckman, E. , Ruttink, T. & Vandepoele, K. (2016) Are we there yet? Reliably estimating the completeness of plant genome sequences. The Plant Cell, 28(8), 1759–1768. Available from: 10.1105/tpc.16.00349 [DOI] [PMC free article] [PubMed] [Google Scholar]
- Vurture, G.W. , Sedlazeck, F. J. , Nattestad, M. , Underwood, C. J. , Fang, H. , Gurtowski, J. et al. (2017) GenomeScope: fast reference‐free genome profiling from short reads. Bioinformatics, 33(14), 2202–2204. Available from: 10.1093/bioinformatics/btx153 [DOI] [PMC free article] [PubMed] [Google Scholar]
- Wu, T.D. & Watanabe, C.K. (2005) GMAP: a genomic mapping and alignment program for mRNA and EST sequences. Bioinformatics, 21(9), 1859–1875. Available from: 10.1093/bioinformatics/bti310 [DOI] [PubMed] [Google Scholar]
- Xia, K. , Ou, X. , Tang, H. , Wang, R. , Wu, P. , Jia, Y. et al. (2015) Rice microRNA osa‐miR1848 targets the obtusifoliol 14α‐demethylase gene OsCYP51G3 and mediates the biosynthesis of phytosterols and brassinosteroids during development and in response to stress. New Phytologist, 208(3), 790–802. Available from: 10.1111/nph.13513 [DOI] [PubMed] [Google Scholar]
- Xu, M. , Cho, E. , Burch‐Smith, T.M. & Zambryski, P.C. (2012) Plasmodesmata formation and cell‐to‐cell transport are reduced in decreased size exclusion limit 1 during embryogenesis in Arabidopsis. Proceedings of the National Academy of Sciences of the United States of America, 109(13), 5098–5103. Available from: 10.1073/pnas.1202919109 [DOI] [PMC free article] [PubMed] [Google Scholar]
- Yamamoto, Y. , Kobayashi, Y. , Devi, S.R. , Rikiishi, S. & Matsumoto, H. (2003) Oxidative stress triggered by aluminum in plant roots. In Abe J. (Ed.) Roots: the dynamic interface between plants and the earth: the 6th symposium of the international society of root research. Dordrech: Springer, pp. 239–243. 10.1007/978-94-017-2923-9_23 [DOI] [Google Scholar]
- Yang, J. , Wariss, H.M. , Tao, L. , Zhang, R. , Yun, Q. , Hollingsworth, P. et al. (2019) De novo genome assembly of the endangered Acer yangbiense, a plant species with extremely small populations endemic to Yunnan Province, China, GigaScience, 8(7), giz085. Available from: 10.1093/gigascience/giz085 [DOI] [PMC free article] [PubMed] [Google Scholar]
- Yang, W.‐Y. , Zheng, Y. , Bahn, S.C. , Pan, X.‐Q. , Li, M.‐Y. , Vu, H.S. et al. (2012) The patatin‐containing phospholipase A pPLAIIα modulates oxylipin formation and water loss in Arabidopsis thaliana . Molecular Plant, 5(2), 452–460. Available from: 10.1093/mp/ssr118 [DOI] [PMC free article] [PubMed] [Google Scholar]
- Yu, T. , Hu, Y. , Zhang, Y. , Zhao, R. , Yan, X. , Dayananda, B. et al. (2021) Whole‐genome sequencing of Acer catalpifolium reveals evolutionary history of endangered species. Genome Biology and Evolution, 13, evab271. Available from: 10.1093/gbe/evab271 [DOI] [PMC free article] [PubMed] [Google Scholar]
- Zeng, L. , Tu, X.‐L. , Dai, H. , Han, F.‐M. , Lu, B.‐S. , Wang, M.‐S. et al. (2019) Whole genomes and transcriptomes reveal adaptation and domestication of pistachio. Genome Biology, 20(1), 79. Available from: 10.1186/s13059-019-1686-3 [DOI] [PMC free article] [PubMed] [Google Scholar]
- Zhang, S.‐W. , Li, C.‐H. , Cao, J. , Zhang, Y.‐C. , Zhang, S.‐Q. , Xia, Y.‐F. et al. (2009) Altered architecture and enhanced drought tolerance in rice via the down‐regulation of indole‐3‐acetic acid by TLD1/OsGH3.13 activation. Plant Physiology, 151(4), 1889–1901. Available from: 10.1104/pp.109.146803 [DOI] [PMC free article] [PubMed] [Google Scholar]
- Zhao, D. , Hamilton, J.P. , Bhat, W.W. , Johnson, S.R. , Godden, G.T. , Kinser, T.J. et al. (2019) A chromosomal‐scale genome assembly of Tectona grandis reveals the importance of tandem gene duplication and enables discovery of genes in natural product biosynthetic pathways. GigaScience, 8(3), giz005. Available from: 10.1093/gigascience/giz005 [DOI] [PMC free article] [PubMed] [Google Scholar]
- Zhu, W. , Li, L. , Neuhäuser, B. , Thelen, M. , Wang, M. , Chen, J. et al. (2021) Small peptides modulate the immune function of the ion channel‐like protein ACD6 in Arabidopsis thaliana . BioRxiv, 428077. Available from: 10.1101/2021.01.25.428077 [DOI] [Google Scholar]
Associated Data
This section collects any data citations, data availability statements, or supplementary materials included in this article.
Supplementary Materials
Data S1. Assembly statistics.
Data S2. Annotation statistics.
Data S3. Collinearity analysis of recent peak in Ks plot of A. saccharum.
Data S4. HBEF differentially expressed genes.
Data S5. Significant gene family dynamics by species and genus.
Data S6. Significant rapidly evolving gene families by species.
Data S7. GO enrichment of contracted or missing gene families in A. negundo compared to Acer using longest overall gene.
Data S8. GO enrichment of contracted or missing gene families in A. negundo compared to Acer using longest Acer gene.
Data S9. GO enrichment of expanded or novel gene families in A. negundo compared to Acer using longest overall gene.
Data S10. GO enrichment of expanded or novel gene families in A. negundo compared to Acer using longest Acer gene.
Data S11. GO enrichment of contracted or missing gene families in A. saccharum compared to Acer using longest Acer gene.
Data S12. GO enrichment of contracted or missing gene families in A. saccharum compared to Acer using longest overall gene.
Data S13. GO enrichment of expanded or novel gene families in A. saccharum compared to Acer using longest Acer gene.
Data S14. A. saccharum verified missing genes.
Data S15. A. negundo verified missing genes.
Data S16. Gene family comparisons for HBEF DEG and Al tolerance genes.
Figure S1. Genome size estimation using k‐mer distribution analysis.
Figure S2. Hi‐C read mapping against scaffolds.
Figure S3. PCA clustering of expression results.
Figure S4. Syntenic comparisons between the three Acer genomes.
Table S1. Illumina, PacBio, and Hi‐C sequencing data summaries.
Table S2. Trees sampled at HBEF.
Table S3. GO enrichment of HBEF DEGs.
Table S4. OrthoFinder orthogroup statistics by species.
Table S5. GO enrichment of significant gene family dynamics.
Table S6. GO enrichment of rapidly evolving genes.
Table S7. HBEF Nutrient Perturbation treatment schedule.
Data Availability Statement
For A. negundo, the genome, annotations, and RNA‐Seq data are available in BioProject PRJNA750066. Corresponding data for A. saccharum can be found in BioProject PRJNA748028. RNA‐Seq data used in the differential expression study are available in BioProject PRJNA751902. Full details on assembly, annotation, gene family analysis, and differential expression analysis can be found at https://doi.org/10.5281/zenodo.5801851.