

Abstract
In this study, headspace solid-phase micro-extraction (HS-SPME) coupled with GC-MS was used to analyze the trend of volatile compounds in fresh and oxidative infant nutrition package. Among the volatile compounds, aldehydes and ketones, alcohols, lipids, cycloalkenes, alkanes, alkenes, aromatic hydrocarbons, oxygenated compound were identified. A total of 65 volatile compounds were detected in the fresh nutrition package, whereas 9 new volatile compounds were detected during the accelerated oxidation process, which was oxidized at 45 °C for 4 weeks. The main components of the rancid flavor formed and the relative content of volatile substances gradually changed during the accelerated oxidation process. The volatile substances hexanal, nonanal, and 2-pentylfuran substantially increased. Linalool, α-terpineol, d-limonene, and 1-methoxy-nonane presented an evidently downward trend. The relative content of the newly formed compound 3-hydroxy-2-methylpyran-4-one during the oxidation process was always large, its relative content initially increased, then decreased, and finally increased again. The formation of rancid flavor of the nutrient package was speculated to have been formed by the interaction of hexanal, nonanal, 2-pentylfuran, and 3-hydroxy-2-methylpyran-4-one.
Keywords: Infant nutrition package, Volatile compounds, Variation trend, Rancid odor, Headspace solid-phase micro-extraction, Gas chromatography/Mass Spectrometry
Introduction
Infancy is characterized by rapid growth, development and maturation of organs and systems (Langley 2015). Medical and scientific studies have proved that nutrition during infancy determines the nutritional status, growth and development, and potential expression and cognition of infants (Eveleth 1996; Mary et al. 2015; Wu and Chen 2009). It is also related to the health status of adulthood and the probability of occurrence of chronic diseases (Gluckman et al. 2008). Numerous studies have shown that breastfeeding is the best choice for feeding infants (Zou et al. 2017). Exclusive breastfeeding provides optimal nutrition and health protection for the first 6 months of life (Martin et al. 2016). Supplemental food is provided to promote infant growth and development and achieve a sufficient nutritional balance from 6 months until at least 12 months (Lessen et al. 2015).
“The report on nutrition and family rearing of children aged 0–6 years in poor areas of China” reported that the nutritional and family-rearing status of rural children in poverty-stricken areas of China is still characterized by low body weight, high prevalence of anemia, and micronutrient deficiencies. In this areas, breastfeeding rates are low and show a downward trend. In 2013, the National Health and Family Planning Commission cooperated with the All-China Women’s Federation to conduct a nutrition improvement project for children in poverty-stricken areas and the poorest areas in the country. This project aims to improve district infant nutrition and health status through the distribution of infant nutrition package and the dissemination of evidence-based feeding knowledge.
An infant nutrition package is made up of not less than 70% of type I instant soybean powder and many kinds of micronutrients. Sometimes, it is added with whole fat milk powder. Therefore, it is rich in nutrition and has a high lipid content. Free radical reactions easily occur in food with high-fat content and produce rancid odor during the storage process (Estaca et al. 2014). The so-called rancid odor is the mixture of odors during fat decomposition and oxidation. The main oxidation products of unsaturated fatty acids are hydroperoxides. Hydroperoxides can continue to generate secondary oxidation products by decomposition and aggregation (Xu et al. 2016), including producing complex mixtures of non-volatile and volatile compounds, such as hydrocarbons, alcohols, acids, aldehydes and ketones (Barriuso et al. 2013; Llatas et al. 2007). It can not only affect the overall quality of the product but also cause great harm to health. Therefore, the main components of the rancid flavor that formed during the oxidation process of nutrition package must be identified and the oxidation of nutrition package should be controlled.
In this study, the infant nutrition package was selected as the research object. Our aim was to analyze the variations in the oxidized volatile components of infant nutrition package via SPME coupled with GC–MS. Changes in the volatile compounds were comprehensively evaluated via accelerated oxidation experiments. This study provides scientific data and technical means for controlling and testing the quality of infant nutrient package.
Materials and methods
Materials and reagents
Samples of infant nutrition packages were obtained from Ganzhou Biotechnology Co., Ltd., Jiangxi Province, China. The mixed chromatographic-grade n-alkane standard (C7-C30) was purchased from Supelco, USA. All chemical reagents were of analytical grade.
Instrument and equipment
An Agilent Technologies 7890A gas chromatography connected a 7000B triple tandem quadrupole mass spectrometer purchased from Agilent, USA were used to perform GC–MS analysis. An Agilent 19091S-433UI HP-5MS capillary column (30 m × 0.25 mm, 0.25 µm film thickness) purchased from Agilent, USA was used to separate the targets. A 50/30 µm divinylbenzene/ carboxy/ polydimethylsiloxane coating fiber purchased from Supelco, USA was exposed to the headspace to absorb the volatiles. AL104 electronic balance was purchased from Mettler Toledo, Switzerland. HH-2 digital thermostat water bath was purchased from Guohua Electric Co., Ltd, (Changzhou City, Jiangsu Province, China).
Accelerated oxidation test and flavor evaluation of samples
The samples of infant nutrition packages were divided into five groups, and three different batch samples from each group were taken as parallel samples. The condition of accelerated oxidation tests was set at 45 °C for 4 weeks. Volatile components were detected every 7 days. The samples’ flavor was tested by sensory professionals from Quanbiao Biotechnology Co., Ltd, (Ganzhou City, Jiangxi Province, China).
HS-SPME/GC–MS analysis
HS-SPME conditions
First, 1.00 g of the sample was placed in a 20 mL headspace bottle (Agilent, USA) and sealed with a silicone/Teflon septum cap (Agilent, USA). Subsequently, the headspace vial was equilibrated in an electric-heated thermostatic water bath at 50 °C for 35 min, and the headspace vial was shaken every 10 min. For the extraction of the analytes, an SPME fiber was placed in the headspace of the sample vial for the predetermined period time of 30 min at 70 °C. After 30 min of exposure, the SPME fiber was then injected into the GC for 5 min to desorb the trapped analytes. Three replicates for each sample were prepared and analyzed.
Chromatographic and Mass Spectrometry conditions
The adsorbed volatiles were separated on an HP-5MS capillary column. The oven temperature program was as follows: 35 °C (hold 3 min), to 65 °C at 4 °C/min (hold 2 min), to 90 °C at 2 °C/min (hold 3 min), then to 220 °C at 5 °C/min (hold 2 min). The total analysis time was 56 min. The flow rate of carrier gas (purity ≥ 99.999%, helium) was constant at 0.8 mL/min. The injector temperature was set at 260 °C, and the headspace samples were split-injected (split ratio 5:1).
The triple quadruple mass spectrometer was operated in full-scan mode. The ion source, quadruple, and transfer line temperature were set at 230 °C, 150 °C, and 280 °C, respectively. The ionization voltage was 70 eV, and the solvent delay was 3 min. Data acquisition was set within an m/z range of 50–550.
Determination of volatile component retention index (RI)
The n-alkane standard was injected as a liquid sample on the basis of the increase in temperature of the samples. The sample injection volume was 1µL, and the split ratio was 20:1. Then the retention time of each n-alkane standard peak was recorded. The retention index of each component is calculated by the Kovats retention index formula.
where Tx is the retention time of compound x. Tn and Tn+1 were the retention times of straight-chain alkanes, with carbon number n and n + 1, respectively. Where Tn < Tx < Tn+1.
Statistical analysis
The repeated test data under the same conditions were calculated by Excel 2003, and the results were expressed as mean ± standard deviation. Volatile compounds were tentatively identified by comparing their RI and confirming the data with those reported in the literature. In addition, the National Institute of Standard and Technology database stored in our system was used to identify the metabolites. The volatile components of the samples were screened and identified, and the relative percentage content of each volatile component was determined via peak area normalization.
Results
Flavor evaluation of samples
The first group (control group) was accelerated for 0 days. According to the sensory test, it was a fresh nutrient package with mild bean powder fragrance. The second group’s accelerated oxidation time was 7 days. This group did not have a strong unique fragrance, and it produced a slight smell of vegetable oil and exuded a slight rancid flavor. The third group’s accelerated oxidation time was 14 days. It had a peculiar smell and a moderate rancid flavor. The fourth group’s accelerated oxidation time was 21 days. It exuded a heavy rancid flavor. The fifth group’s accelerated oxidation time was 28 days. It had a severe rancid odor mixed with other peculiar smell.
Qualitative analysis of volatile components
The volatile components were determined through the above method. The total ion chromatograms of the volatile components in the infant nutrition package during the fresh and oxidative processes are shown in Fig. 1 and Fig. 2, respectively. As shown in Fig. 1, the volatile components with a relatively high content in the fresh nutrient package were hexanal, 2,2,4,6,6-pentamethylheptane, d-limonene, nonanal, dodecane, 2,4-bis(1,1-dimethylethyl)-phenol, dipropyl hexanedioate and octan-4-yl 4-(trifluoromethyl)benzoate. As shown in Fig. 2, the whole peak pattern and the peak position of the volatile substances in the infant nutrition package were similar before and after oxidation. The volatile components of the infant nutrition package were mainly concentrated in 14–22 min and 34–45 min.
Fig. 1.
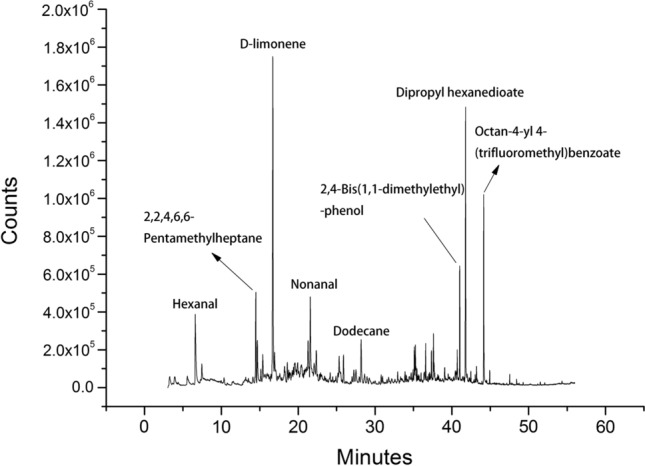
The total ion chromatograms of the volatile components in the fresh infant nutrition package
Fig. 2.
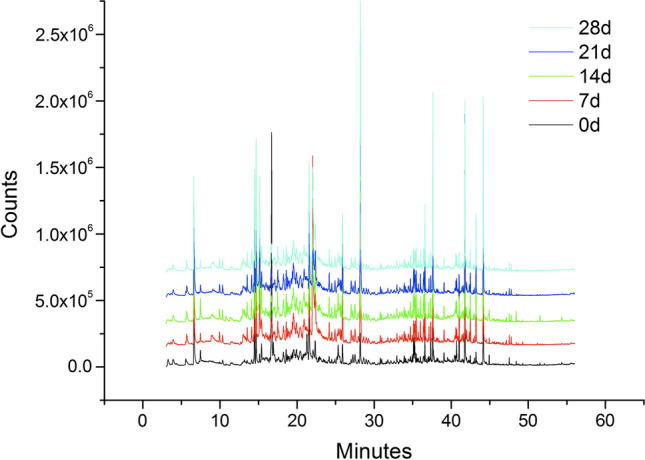
The total ion chromatograms of the volatile components in the infant nutrition package during the accelerated oxidative process
The volatile components during accelerated oxidation of the infant nutrient package are enumerated in Table 1. A total of 65 different volatile compounds were extracted from the fresh nutrition package via SPME and analyzed via GC–MS. It mainly includes 10 alcohols, 4 aldehydes and ketones, 42 hydrocarbons, 5 lipids and 4 other substances. The volatile compounds with a high relative content were d-limonene (21.3% ± 3.14%), dipropyl hexanedioate (13.36% ± 2.43%), octan-4-yl 4-(trifluoromethyl)benzoate (6.83% ± 1.28%), 2,2,4,6,6-pentamethylheptane (5.55% ± 1.71%), nonanal (4.38% ± 0.99%), hexanal (4.18% ± 1.33%), phenol, 2,4-bis(1,1-dimethylethyl)- (3.84% ± 0.74%), dodecane (3.58% ± 0.78%), 2-pentylfuran (2.76% ± 0.14%), linalool (1.58% ± 0.15%), and 1-octen-3-ol (1.33% ± 0.88%). Nine new volatiles formed during the accelerated oxidation process. They were 2-heptanone, (E)-2-heptenal, benzaldehyde, 2,2,4,4-tetramethyloctane, pentanol, octadecane, 4-methylundecane, o-tert-butyl-hydroxylamine, and 3-hydroxy-2-methylpyran-4-one. We speculated that the rancid odor produced in the nutrition package during the accelerated oxidation process was related to these newly formed substances.
Table 1.
Identification of volatile components in accelerated oxidation of infant nutrition package
| Compound | RT (min)a | CAS | KIb | Identificationc | Relative content (%)d | ||||
|---|---|---|---|---|---|---|---|---|---|
| 0 days | 7 days | 14 days | 21 days | 28 days | |||||
| Aldehydes and Ketones | |||||||||
| Hexanal | 6.605 | 66–25-1 | 802 | MS, RI | 4.18 ± 1.33 | 4.85 ± 1.20 | 5.52 ± 1.12 | 7.62 ± 1.41 | 10.27 ± 2.64 |
| 2-Heptanone | 9.942 | 110–43-0 | 892 | MS | nd | 0.46 ± 0.13 | 0.36 ± 0.17 | 0.32 ± 0.15 | 0.48 ± 0.26 |
| Heptanal | 10.345 | 111–71-7 | 903 | MS, RI | 0.58 ± 0.25 | 0.26 ± 0.10 | 0.38 ± 0.21 | 0.33 ± 0.12 | 0.37 ± 0.11 |
| (E)-2-Heptenal | 12.803 | 18,829–55-5 | 953 | MS, RI | nd | 0.02 ± 0.01 | 0.08 ± 0.05 | 0.10 ± 0.07 | 0.19 ± 0.09 |
| Benzaldehyde | 12.971 | 100–52-7 | 956 | MS, RI | nd | 0.27 ± 0.09 | 0.17 ± 0.12 | 0.18 ± 0.11 | 0.20 ± 0.08 |
| 3,5-Octadien-2-one | 19.532 | 38,284–27-4 | 1072 | MS, RI | 0.48 ± 0.20 | 0.26 ± 0.09 | 0.30 ± 0.12 | 0.36 ± 0.12 | 0.43 ± 0.21 |
| Nonanal | 21.580 | 124–19-6 | 1104 | MS, RI | 4.38 ± 0.99 | 4.25 ± 2.18 | 5.02 ± 1.24 | 5.83 ± 1.45 | 6.75 ± 1.77 |
| Alcohols | |||||||||
| 4-Methyl cyclohexanol | 3.932 | 589–91-3 | 704 | MS | 0.73 ± 0.28 | 0.27 ± 0.11 | 0.50 ± 0.04 | 0.33 ± 0.07 | 0.48 ± 0.14 |
| 1-Pentanol | 5.691 | 71–41-0 | 769 | MS, RI | nd | 0.49 ± 0.02 | 0.34 ± 0.01 | 0.31 ± 0.11 | 0.50 ± 0.22 |
| 1-Octene-3-ol | 14.106 | 3391–86-4 | 979 | MS, RI | 1.33 ± 0.88 | 0.64 ± 0.21 | 0.90 ± 0.15 | 0.95 ± 0.19 | 0.71 ± 0.36 |
| 2-Ethylhexan-1-ol | 16.946 | 104–76-7 | 1029 | MS, RI | 0.16 ± 0.01 | 0.12 ± 0.02 | 0.17 ± 0.08 | 0.13 ± 0.04 | 0.15 ± 0.03 |
| 3,5-Octadien-2-ol | 17.504 | 69,668–82-2 | 1039 | MS, RI | 0.42 ± 0.53 | 0.49 ± 0.04 | 0.79 ± 0.32 | 0.63 ± 0.01 | 0.64 ± 0.12 |
| Linalool | 21.285 | 78–70-6 | 1100 | MS, RI | 1.58 ± 0.15 | nd | nd | nd | nd |
| α-Terpineol | 27.275 | 98–55-5 | 1187 | MS, RI | 0.72 ± 0.10 | 0.30 ± 0.15 | 0.27 ± 0.10 | 0.31 ± 0.01 | 0.17 ± 0.06 |
| N-Pentadecanol | 30.814 | 629–76-5 | 1246 | MS, RI | 0.52 ± 0.04 | 0.37 ± 0.04 | 0.38 ± 0.01 | 0.33 ± 0.07 | 0.33 ± 0.21 |
| 2-Methyl-1-decanol | 31.781 | 18,675–24-6 | 1263 | MS | 0.24 ± 0.01 | 0.11 ± 0.04 | 0.11 ± 0.02 | 0.19 ± 0.06 | 0.20 ± 0.04 |
| 2-(Dodeoxy) ethanol | 35.474 | 4536–30-5 | 1343 | MS | 0.46 ± 0.15 | 0.70 ± 0.36 | 0.72 ± 0.01 | 0.67 ± 0.19 | 0.64 ± 0.32 |
| 2-Hexyl-1-octanol | 37.005 | 19,780–79-1 | 1384 | MS | 0.21 ± 0.03 | 0.04 ± 0.01 | 0.05 ± 0.01 | 0.06 ± 0.02 | 0.07 ± 0.04 |
| Lipids | |||||||||
| Delta-dodecanolactone | 14.381 | 713–95-1 | 985 | MS, RI | 0.10 ± 0.02 | 0.13 ± 0.02 | 0.19 ± 0.10 | 0.17 ± 0.08 | 0.21 ± 0.01 |
| 3,7,11,15-Tetramethylhexadecyl acetate | 34.715 | — | 1323 | MS | 0.31 ± 0.03 | 0.37 ± 0.12 | 0.39 ± 0.01 | 0.42 ± 0.01 | 0.41 ± 0.11 |
| Methyl 2-amino-2-butylhexanoate | 35.125 | 6141–45-3 | 1334 | MS | 1.50 ± 0.32 | 0.72 ± 0.21 | 0.71 ± 0.27 | 0.87 ± 0.17 | 0.77 ± 0.36 |
| Dipropyl hexanedioate | 41.786 | 106–19-4 | 1545 | MS | 13.36 ± 2.43 | 8.73 ± 0.13 | 8.29 ± 0.33 | 9.46 ± 2.25 | 7.93 ± 0.59 |
| Octan-4-yl 4-(trifluoromethyl)benzoate | 44.157 | — | 1639 | MS | 6.83 ± 1.28 | 7.63 ± 0.72 | 7.09 ± 1.02 | 7.35 ± 0.33 | 7.99 ± 1.23 |
| Hydrocarbons | |||||||||
| Cycloalkenes | |||||||||
| D-limonene | 16.718 | 5989–27-5 | 1026 | MS, RI | 21.3 ± 3.14 | 0.33 ± 0.04 | 0.25 ± 0.09 | 0.21 ± 0.07 | 0.36 ± 0.06 |
| Alkanes | |||||||||
| 3-Methylnonane | 13.535 | 5911–04-6 | 967 | MS, RI | 0.19 ± 0.03 | 0.46 ± 0.13 | 0.53 ± 0.01 | 0.59 ± 0.21 | 0.58 ± 0.31 |
| 2,2,4,6,6-Pentamethylheptane | 14.502 | 13,475–82-6 | 987 | MS, RI | 5.55 ± 1.71 | 2.92 ± 0.19 | 3.48 ± 0.14 | 4.65 ± 0.15 | 3.89 ± 0.31 |
| Decane | 15.160 | 124–18-5 | 1000 | MS, RI | 0.69 ± 0.08 | 2.85 ± 0.52 | 3.48 ± 0.19 | 3.76 ± 0.25 | 3.87 ± 1.43 |
| 2,2,4,4-Tetramethyloctane | 16.624 | 62,183–79-3 | 1024 | MS | nd | 0.24 ± 0.04 | 0.32 ± 0.17 | 0.48 ± 0.05 | 0.38 ± 0.11 |
| 4,5-Dimethylnonane | 18.236 | 17,302–23-7 | 1050 | MS | 0.33 ± 0.09 | 0.16 ± 0.06 | 0.19 ± 0.09 | 0.20 ± 0.04 | 0.17 ± 0.06 |
| 5-Methyldecane | 18.592 | 13,151–35-4 | 1056 | MS, RI | 1.56 ± 0.43 | 0.77 ± 0.21 | 1.12 ± 0.43 | 0.95 ± 0.31 | 0.94 ± 0.35 |
| 4-Methyldecane | 18.773 | 2847–72-5 | 1059 | MS, RI | 0.59 ± 0.08 | 0.28 ± 0.02 | 0.41 ± 0.14 | 0.39 ± 0.12 | 0.31 ± 0.07 |
| 3-Methyldecane | 19.397 | 13,151–34-3 | 1069 | MS, RI | 0.46 ± 0.23 | 0.27 ± 0.04 | 0.23 ± 0.05 | 0.32 ± 0.03 | 0.38 ± 0.16 |
| 2-Methyldecane | 19.948 | 6975–98-0 | 1078 | MS, RI | 0.34 ± 0.02 | 0.14 ± 0.02 | 0.15 ± 0.07 | 0.11 ± 0.01 | 0.10 ± 0.04 |
| 1-Methoxy-nonane | 22.097 | 7289–51-2 | 1112 | MS | 1.14 ± 0.24 | nd | nd | nd | nd |
| 5-Propylnonane | 22.379 | 998–35-6 | 1116 | MS | 1.71 ± 0.56 | 1.24 ± 0.20 | 1.63 ± 0.32 | 1.52 ± 0.15 | 1.31 ± 0.37 |
| 2,6-Dimethyltridecane | 22.802 | 13,151–81-7 | 1122 | MS | 0.33 ± 0.03 | 0.18 ± 0.04 | 0.18 ± 0.05 | 0.16 ± 0.07 | 0.16 ± 0.04 |
| 3,7-Dimethyldecane | 22.930 | 17,312–54-8 | 1124 | MS, RI | 0.24 ± 0.05 | 0.14 ± 0.05 | 0.21 ± 0.04 | 0.17 ± 0.06 | 0.12 ± 0.05 |
| 5-Ethyldecane | 24.179 | 17,302–36-2 | 1142 | MS, RI | 0.27 ± 0.09 | 0.61 ± 0.25 | 0.63 ± 0.31 | 0.55 ± 0.17 | 0.56 ± 0.35 |
| 4-Ethyldecane | 24.501 | 1636–44-8 | 1147 | MS | 0.20 ± 0.02 | 0.38 ± 0.16 | 0.43 ± 0.01 | 0.39 ± 0.12 | 0.33 ± 0.06 |
| 5-Methylundecane | 24.924 | 1632–70-8 | 1153 | MS, RI | 0.16 ± 0.05 | 0.43 ± 0.16 | 0.45 ± 0.14 | 0.41 ± 0.20 | 0.36 ± 0.13 |
| 4-Methylundecane | 25.562 | 2980–69-0 | 1162 | MS, RI | nd | 0.23 ± 0.08 | 0.31 ± 0.07 | 0.26 ± 0.13 | 0.24 ± 0.07 |
| 3-Methylundecane | 25.911 | 1002–43-3 | 1167 | MS, RI | 1.68 ± 0.77 | 2.43 ± 0.33 | 3.23 ± 0.25 | 3.06 ± 0.38 | 2.68 ± 0.44 |
| Dodecane | 28.228 | 112–40-3 | 1200 | MS, RI | 3.58 ± 0.78 | 15.09 ± 1.05 | 16.64 ± 2.07 | 16.36 ± 1.71 | 14.81 ± 0.79 |
| 5-Ethyl-5-methyldecane | 28.987 | 17,312–74-2 | 1214 | MS | 0.19 ± 0.05 | 0.14 ± 0.05 | 0.14 ± 0.11 | 0.14 ± 0.08 | 0.12 ± 0.09 |
| 4-Ethylundecane | 31.002 | 17,312–59-3 | 1249 | MS | 0.34 ± 0.04 | 0.19 ± 0.04 | 0.17 ± 0.05 | 0.17 ± 0.07 | 0.18 ± 0.04 |
| 2-Methyldodecane | 32.962 | 1560–97-0 | 1284 | MS, RI | 0.32 ± 0.05 | 0.20 ± 0.07 | 0.19 ± 0.09 | 0.19 ± 0.08 | 0.21 ± 0.01 |
| 10-Methylicosane | 35.340 | 54,833–23-7 | 1339 | MS | 0.19 ± 0.02 | 0.38 ± 0.16 | 0.33 ± 0.14 | 0.31 ± 0.01 | 0.34 ± 0.24 |
| 2,3-Dimethyldodecane | 35.756 | 6117–98-2 | 1350 | MS | 0.13 ± 0.01 | 0.20 ± 0.11 | 0.22 ± 0.03 | 0.2 ± 0.05 | 0.18 ± 0.07 |
| 5-Methyltridecane | 36.005 | 25,117–31-1 | 1357 | MS | 0.41 ± 0.16 | 0.62 ± 0.25 | 0.64 ± 0.08 | 0.59 ± 0.01 | 0.58 ± 0.21 |
| 3-Methyltridecane | 36.602 | 6418–41-3 | 1373 | MS, RI | 1.36 ± 0.24 | 2.16 ± 0.01 | 2.16 ± 0.04 | 2.07 ± 0.84 | 1.92 ± 0.55 |
| Tetradecane | 37.616 | 629–59-4 | 1400 | MS, RI | 1.51 ± 0.49 | 7.39 ± 0.62 | 7.92 ± 1.71 | 7.80 ± 1.13 | 7.06 ± 2.25 |
| Pentadecane | 40.611 | 629–62-9 | 1500 | MS, RI | 0.18 ± 0.04 | 0.28 ± 0.13 | 0.27 ± 0.13 | 0.27 ± 0.12 | 0.33 ± 0.21 |
| 4-Ethyltetradecane | 41.605 | 55,045–14-2 | 1538 | MS | 0.12 ± 0.01 | 0.20 ± 0.03 | 0.2 ± 0.07 | 0.19 ± 0.10 | 0.16 ± 0.04 |
| 2,6,10-Trimethyltetradecane | 42.015 | 14,905–56-7 | 1554 | MS, RI | 0.13 ± 0.02 | 0.23 ± 0.08 | 0.24 ± 0.11 | 0.22 ± 0.09 | 0.20 ± 0.13 |
| 3-Methylpentadecane | 42.485 | 2882–96-4 | 1572 | MS, RI | 0.35 ± 0.08 | 0.62 ± 0.23 | 0.59 ± 0.23 | 0.55 ± 0.25 | 0.55 ± 0.11 |
| Hexadecane | 43.224 | 544–76-3 | 1600 | MS, RI | 0.42 ± 0.17 | 1.74 ± 0.23 | 1.51 ± 0.45 | 1.41 ± 0.52 | 1.47 ± 0.44 |
| Octadecane | 47.783 | 593–45-3 | 1800 | MS, RI | nd | 0.20 ± 0.07 | 0.02 ± 0.01 | 0.17 ± 0.05 | 0.17 ± 0.13 |
| Alkenes | |||||||||
| (E)-7-Methyl-3-undecene | 25.730 | 74,630–53-8 | 1164 | MS, RI | 0.11 ± 0.01 | 0.36 ± 0.07 | 0.45 ± 0.04 | 0.44 ± 0.31 | 0.47 ± 0.14 |
| (Z)-3-Methyl-2-undecene | 27.033 | 57,024–90-5 | 1183 | MS | 0.31 ± 0.04 | 0.64 ± 0.19 | 0.61 ± 0.24 | 0.67 ± 0.21 | 0.58 ± 0.13 |
| 1-Dodecene | 27.530 | 112–41-4 | 1190 | MS, RI | 0.86 ± 0.19 | 0.74 ± 0.11 | 0.75 ± 0.33 | 0.79 ± 0.24 | 0.56 ± 0.22 |
| (Z)-3-Dodecene | 27.966 | 7239–23-8 | 1196 | MS | 0.35 ± 0.07 | 0.32 ± 0.04 | 0.35 ± 0.08 | 0.16 ± 0.09 | 0.30 ± 0.24 |
| 2-Butyl-1-decene | 36.448 | 51,655–65-3 | 1369 | MS | 0.41 ± 0.10 | 0.84 ± 0.24 | 0.88 ± 0.27 | 0.84 ± 0.32 | 0.82 ± 0.32 |
| (E)-3-Tetradecene | 37.126 | 41,446–68-8 | 1387 | MS | 0.25 ± 0.01 | 0.40 ± 0.14 | 0.38 ± 0.01 | 0.37 ± 0.21 | 0.35 ± 0.14 |
| 1-Tetradecene | 37.348 | 1120–36-1 | 1393 | MS, RI | 1.19 ± 0.08 | 0.60 ± 0.23 | 0.57 ± 0.21 | 0.55 ± 0.21 | 0.51 ± 0.31 |
| (Z)-8-Hexadecene | 43.042 | 35,507–10-9 | 1593 | MS | 0.30 ± 0.07 | 0.15 ± 0.07 | 0.17 ± 0.08 | 0.13 ± 0.04 | 0.11 ± 0.07 |
| 1-Octadecene | 47.535 | 112–88-9 | 1788 | MS, RI | 0.30 ± 0.11 | 0.26 ± 0.11 | 0.20 ± 0.09 | 0.19 ± 0.11 | 0.23 ± 0.01 |
| Aromatic hydrocarbons | |||||||||
| Benzene | 3.267 | 71–43-2 | 660 | MS, RI | 0.79 ± 0.31 | nd | nd | nd | nd |
| Toluene | 5.571 | 108–88-3 | 764 | MS, RI | 0.33 ± 0.12 | 0.08 ± 0.01 | 0.09 ± 0.03 | 0.15 ± 0.11 | 0.11 ± 0.12 |
| Oxygenated compounds | |||||||||
| O-tert-butylhydroxylamine | 3.616 | 37,477–16-0 | 685 | MS, RI | nd | 0.09 ± 0.01 | 0.11 ± 0.01 | 0.15 ± 0.05 | 0.18 ± 0.07 |
| 2-Pentylfuran | 14.697 | 3777–69-3 | 991 | MS, RI | 2.76 ± 0.14 | 3.21 ± 0.17 | 3.88 ± 0.23 | 5.19 ± 0.5 | 5.74 ± 1.07 |
| 3-Hydroxy-2-methylpyran-4-one | 22.037 | 118–71-8 | 1111 | MS, RI | nd | 12.40 ± 2.07 | 7.17 ± 0.52 | 3.57 ± 0.81 | 6.27 ± 0.15 |
| (4E,6E)-1-Methoxy-4,6-decadiene | 28.658 | 14,852–31-4 | 1208 | MS | 0.98 ± 0.34 | 0.33 ± 0.00 | 0.30 ± 0.12 | 0.22 ± 0.09 | 0.27 ± 0.11 |
| 1-Methoxytridecane | 39.080 | 7289–55-6 | 1449 | MS | 0.51 ± 0.11 | 0.34 ± 0.00 | 0.31 ± 0.15 | 0.36 ± 0.16 | 0.31 ± 0.05 |
| 2,4-Bis(1,1-dimethylethyl)-phenol | 41.028 | 96–76-4 | 1516 | MS, RI | 3.84 ± 0.74 | 3.32 ± 1.17 | 2.04 ± 0.81 | 0.57 ± 0.23 | 0.22 ± 0.06 |
a Retention time;
b Kovats indices for a HP-5 MS column;
c Methods of identification: MS, mass spectrum comparison using National Institute of Standards and Technology Database (NIST), RI, retention index in agreement with literature value;
d The relative content of volatile compounds is expressed by mean ± standard deviation;
nd, not detected
Analysis of variation trend of volatile components and rancid odors
The relative content of volatile compounds detected in the oxidized samples after accelerated oxidation at 45 °C for 4 weeks are given in Fig. 3. As shown in Fig. 3, the total area of the volatile components of fresh nutrition package was low, and the total area increased gradually during the oxidation process. After 7 days of accelerated oxidation, the nutrient package exuded a slight rancid odor. The total area of the volatile compounds increased by 71.3%, indicating that they evidently changed or new volatile compounds might have been produced during the oxidation process. After 14 days of accelerated oxidation, the nutrition package exuded a moderate rancid flavor. The total volatile area reached the maximum value of 7.9 × 10⁷. The total area then gradually decreased and tended to remain stable. The proportion of aldehydes and ketones, lipids, and alkanes during the oxidation process was large. Among them, the relative content of the volatile components of alkanes was the largest in the nutrition package, and their relative content gradually showed an upward trend. The relative content of alkanes increased by 75.8% after 7 days and then slightly decreased thereafter. The relative content of aldehydes and ketones increased gradually and reached the maximum value on the 28th day. In general, aldehydes and ketones have low flavor thresholds and have a strong influence on odors. Thus, the scent of the infant nutrition packages was likely related to the increase in the relative content of aldehydes and ketones. The variations in the relative content of lipids, alcohols, and cycloalkenes were similar. Their relative content was the highest in the fresh nutrition package and decreased gradually along with the oxidation process. After 7 days of oxidation, the relative content of cycloalkenes decreased by 98.5%. The relative contents of alcohols and lipids dropped by 44.6% and 20.5%, respectively. The relative contents of alcohols, lipids, and cycloalkenes were similar during 7–28 days of oxidation, and the changes were not obvious.
Fig. 3.

The relative content and total peak area of the aldehydes and ketones, alcohols, lipids, hydrocarbons, oxygenated compounds in the fresh and accelerated oxidative infant nutrition package
Discussion
Variation trend of aldehydes and ketones
Four kinds of aldehydes and ketones were detected in the samples of fresh infant nutrition package. Their relative content comprised 9.6% of the total volatile components, including hexanal, heptanal, nonanal, and 3,5-octadien-2-one. Aldehydes are mainly derived from the oxidative degradation of fat (Estaca et al. 2014), which is closely related to changes in food flavor. The flavor threshold of aldehydes is lower than that of hydrocarbons, furans, and alcohol (Sonia et al. 2009). Thus, aldehydes might be one of the important factors that affected the changes in volatile components during the storage of the nutrition packages. Their production leads to the generation of rancid odor, resulting in the deterioration of food quality and nutrition and the reduction of shelf life (Lozanoet al. 2007).
As shown in Table 1, hexanal and nonanal were the main aldehydes in the oxidation process. Hexanal and nonanal are the primary oxidation products of linoleic acid and oleic acid (Kalua et al. 2007). They are directly related to the rancid flavor of food and usually used as indicators of lipid oxidation (Brunton et al. 2000). They can be measured at the top of the sample, and they are more stable than unsaturated aldehydes owing to their lack of double bonds (Pignoli et al. 2009). The relative content of the two compounds varies considerably varied during oxidation (Fig. 4a).
Fig. 4.

The trend of relative content of volatile compounds during the accelerated oxidation process (a the hexanal and nonanal, b the 1-pentanol, 1-octene-3-ol, 3,5-octadien-2-ol, linalool, α-terpineol, c the methyl 2-amino-2-butylhexanoate, dipropyl hexanedioate, octan-4-yl 4-(trifluoromethyl)benzoate, d the 2-pentylfuran, 3-hydroxy-2-methylpyran-4-one, 2,4-bis(1,1-dimethylethyl)-phenol)
As shown in Fig. 4a, the relative content of hexanal and nonanal increased continuously during the 4 weeks of accelerated oxidation at 45 °C. The growth rate initially slowly increased on days 0–14 but rapidly increased on days 14–28. The growth rate was slower on days 0–14 than on days 14–28, probably because of the slow-degradation rate of hydroperoxides in the early stage of oxidation. A high nonanal content was obtained on days 14–28 likely because of the fast degradation rate in the late oxidation stage. When the nutrition package was stored at 45 °C for 28 days, hexanal content was 1.45-fold higher than that in fresh nutrition package. The trend of changes in the relative content of nonanal was similar to that of hexanal. The relative growth rate of nonanal was slower than that of hexanal during the oxidation process. The growth rate of nonanal was relatively uniform. After 28 days of oxidation, the content of nonanal increased by 54.1% compared with that in fresh nutrition package. Thus, the formation of rancid odor might be related to the presence of hexanal and nonanal, and the contribution of hexanal to the rancid odor was greater than that of nonanal.
During the oxidation process, new aldehydes were produced, including (E)-2-heptenal and benzaldehyde. Their relative contents were not high. Benzaldehyde only minimally changed, and thus should not be the main component of putrefaction. (E)-2-heptenal showed an overall upward trend during the oxidation process. We supposed that the relative content of (E)-2-heptenal would continue to increase if the oxidation continued.
Ketones are the products of the cracking of unsaturated fatty acids with a certain contribution to odor (Siek et al. 1971). 3,5-Octadien-2-one was detected in the fresh nutrition package, and its content decreased slightly after 7 days of oxidation. Its relative content on days 7–28 continued to increase and showed an upward trend. 2-Heptanone was newly produced during the oxidation process, and it was the oxidation product of linoleic acid. As shown in Table 1, the content of 2-heptanone during the oxidation process did not substantially change.
Variation trend of hydrocarbons
Hydrocarbons were the most abundant compounds detected in the infant nutrition package. A total of 30 alkanes, 1 cycloalkene, 9 alkenes, and 2 aromatic hydrocarbons were identified.
Among the hydrocarbons, the cycloalkene d-limonene was the most noteworthy one. The relative content of d-limonene accounted for 21.3% of the total volatile components in the fresh nutrient package. After 7 days of oxidation, its relative content plummeted to 0.3%. It had the greatest change in relative content in the nutrition package before and after accelerated oxidation.
The alkanes detected in the fresh nutrient package accounted for 24.6% of the total volatile compounds, and the alkanes detected in the accelerated oxidation process accounted for 43.4%-48.6% of the total volatile compounds. Among them, the relative contents of 2,2,4,6,6-pentamethylheptane, n-decane, 3-methylundecane, dodecane, tetradecane, and 3-methyltridecane were high, accounting for 14.3% of the total volatile components in the fresh nutrition package and 32.8%-37.7% of the total volatile components in the oxidized nutrient package. During the oxidation process, the relative content of n-decane, 3-methylundecane, dodecane, 3-methyltridecane, and tetradecane substantially increased on days 0–7 oxidation stage and then tended to remain stable thereafter. 1-Methoxy-nonane was only detected in the fresh nutrition package, accounting for 1.14% of the total volatile content in the fresh nutrition package. The newly produced alkane compounds in the oxidation process were 2,2,4,4-tetramethyloctane, 4-methylundecane, and n-octadecane, but their relative contents were low. Moreover, changes in their relative content were not obvious on days 7–28. Moreover, the content of alkanes considerably increased on days 0–7 but did not obviously change on days 7–28(Fig. 3). Alkane compounds usually have a high flavor threshold and a small contribution to the threshold of nutrition packages (Shahidi et al. 1986). Thus, the increase in the relative content of alkane compounds content did not have a considerable contribution to the formation of rancid odor in the nutritional packages.
The relative content of alkenes was generally not high. The relative content of 2-butyl-1-decene, (E)-7-methyl-3-undecene, (Z)-3-methyl-2-undecene, (E)-3-tetradecene slightly increased in the first stage of the accelerated oxidation period, but remained relatively stable in the subsequent stages of the oxidation process.
The relative content of aromatic hydrocarbons, including benzene and toluene were very low. Especially benzene was only detected in the fresh nutrition package but not during the oxidation process. Therefore, hydrocarbons had minimal effect on the formation of rancid odor during the oxidation of the nutrition packages.
Variation trend of alcohols
Alcohols are usually produced by the decomposition of saccharides promoted by free-radicals due to lipid oxidation, and alcohols are a representative of fragrant substances (Wang et al. 2018). Ten kinds of alcohol were detected in the fresh nutrition packages. The relative contents of 4-methyl cyclohexanol, 1-octene-3-ol, 3,5-octadien-2-ol, linalool, α-terpineol, pentadecanol, 2-(dodeoxy) ethanol were relatively high. After a period of oxidation at 45 °C, changes in the relative content of 1-octene-3-ol, linalool, terpineol, 3,5-octadien-2-ol, and n-pentanol became obvious. 1-Octene-3-ol usually largely contributes to aroma with an odor similar to that of mushroom because of its low odor threshold value. It is considered as the product of the oxidation of linoleic acid or other polyunsaturated fatty acids (Pham et al. 2008). As shown in Fig. 4b, the relative content of 1-octene-3-ol initially decreased, then increaseding and finally decrease thereafter. Its relative content in the fresh nutrition package was at most 1.3%. Linalool was the most abundant alcohol compound, accounting for 1.6% of the total volatile components, but it was almost undetectable after 7 days of oxidation. The relative content of terpineol gradually decreased during the oxidation process and always presented a downward trend. 3,5-Octadien-2-ol tended to initially increase and then decrease during the oxidation process, and its maximum value was 0.8% after 14 days of oxidation. The new volatile component n-pentanol slowly decreased on days 7–21 and increased slowly on days 22–28. As shown in Fig. 4b, the overall relative content of the alcohol compounds, except for n-pentanol, exhibited a downward trend after oxidation. This result was inconsistent with the formation of rancid odors in the later periods of oxidation in the nutrition packages. Thus, alcohols were not the main cause of the rancid odor.
Variation trend of lipids
Five kinds of lipids were detected in the fresh nutrition package. They were delta-dodecanolactone, methyl 2-amino-2-butylhexanoate, dipropyl hexanedioate, octan-4-yl 4-(trifluoromethyl)benzoate, 3,7,11,15-tetramethylhexadecyl acetate, which accounted for 16.6%-22.1% of the total volatile components during the accelerated oxidation process. Methyl 2-amino-2-butylhexanoate, dipropyl hexanedioate, and octan-4-yl 4-(trifluoromethyl)benzoate, the three substances with the highest contents, accounted for over 96% of the total lipids detected from the beginning to the end of the oxidation process. As shown in Fig. 4c, the most variable compound was dipropyl hexanedioate, the relative content of which rapidly decreased on days 0–7. Nevertheless, its content increased slightly on day 21. The overall trend showed a downward trend. As shown in Fig. 3, lipids rapidly decreased on days 0–7, slightly changed on days 7–28, and then tended to flatten thereafter. Lipids are important flavor substances that can endow food with a sweet fruity aroma. However, as the oxidation time of the nutrition packages extended, the rancid odor was increased in intensity. Therefore, lipids should be the main flavor substance of fresh nutrition package rather than the main components of the rancid flavor formed during the oxidation process.
Variation trend of oxygenated compounds
The relative contents of 2-pentylfuran and 2,4-bis(1,1-dimethylethyl)-phenol were relatively higher than those of the other oxygenated compounds in the fresh nutrient package. They accounted for 2.8% and 3.8% of the total volatile components of fresh nutrition package, respectively. 2-Pentylfuran is commonly reported as the oxidation product of linoleic acid (An et al. 2011). At low concentrations, it has the taste of butter and green bean (Lampi et al. 2015). The threshold value of 2-pentylfuran was low and it had a substantial contribution to the smell. As shown in Fig. 4d, the relative content of 2-pentylfuran continuously increased during the oxidation process, and sharply increased on days 0–14. The growth rate became faster on days 14–21 because of the rapid degradation rate of hydrogen peroxide in the late stage of the oxidation process. As oxidation tends to be stabilized, the growth rate tends to stabilize again on days 21–28. The tendency of 2-pentylfuran was positively correlated with the time at which the nutrient package produced a rancid odor. Thus, 2-pentylfuran was one of the main components involved in the formation of rancid odor in the nutrition package during the oxidation process. The relative content of 2,4-bis(1,1-dimethylethyl)-phenol continuously decreased during the oxidation process. The rate of decrease was small on days 0–7, it decreased rapidly on days 7–14, and tended to flatten on day 21.
3-Hydroxy-2-methylpyran-4-one was a newly formed substance that was produced during the oxidation process with a caramel odor. Its relative content was relatively high. On the 7th day of oxidation, its relative content reached the maximum value of 12.4%. Afterward, it gradually decreased on days 7–21, and then increased on days 21–28. As shown in Fig. 4, its relative content was higher than that of 2-pentylfuran on day 28. Therefore, the changes in their relative content were related to the formation of rancid odor in the nutritional packages.
Conclusion
In this study, SPME and GC–MS were used to analyze the trend of volatile compounds in infant nutrition packages that were oxidized at 45 °C for 4 weeks. The main components of the rancid odor that formed during the accelerated oxidation process were evaluated. A total of 65 volatile compounds were detected in fresh nutrition packages. Nine volatile compounds, including 2-heptanone, (E)-2-heptenal, benzaldehyde, pentanol, 2,2,4,4-tetramethyloctane, 4-methylundecane, octadecane, o-tert-butyl-hydroxylamine and 3-hydroxy-2-methylpyran-4-one, were detected during the accelerated oxidation process. The relative content of aldehydes and ketones, and alkanes during the oxidation process evidently changed with an upward trend. Changes in the relative content of lipids, alcohols, and cycloalkenes were similar. Their relative content in the fresh nutrition package was the highest. However, their relative content gradually decreased after oxidation, and the change was small on days 7–28. The increase in the relative content of alkanes and alcohols did not substantially contribute to the formation of the rancid odor. Thus, they were not the main cause of the scent of the nutrients. During the accelerated oxidation process, the relative content of volatile substances, including hexanal, nonanal and 2-pentylfuran, gradually increased and presented an upward trend. The relative content of the newly formed compound 3-hydroxy-2-methylpyran-4-one during the oxidation process was always large. Therefore, the rancid flavor that formed during the oxidation process was probably a result of the interaction of hexanal, nonanal, 2-pentylfuran, and 3-hydroxy-2-methylpyran-4-one. This study offers guidance into the basic production of nutrition packages and provides a scientific basis for the evaluation of the special flavor quality of nutrition packages. In the future, gas chromatography olfactometry (GC-O) may be adopted to analyze and identify compounds that make a substantial contribution to the unique flavor of nutrition packages.
Acknowledgements
We thank Ganzhou Quanbiao Biotechnology Co., Ltd. for providing the samples and sensory testing. This research is supported by the National Natural Science Foundation of China (No. 32160562, 31960090, 31960493) and the State Key Laboratory of Food Science and Technology, Nanchang University Support Program (SKLF-ZZB-202129, SKLF-ZZB-201926).
Instrumental techniques
- HS-SPME
Headspace solid-phase micro-extraction
- GC-O
Gas chromatography olfactometry
- MS
Mass spectrum
- RI
Retention index
- NIST
National institute of standards and technology database
Authors' contribution
LQG and YQW designed the experiment, analyzed the data and drafted the article The first two authors contributed equally to this work and should be regarded as co-first authors; YXW designed the experiment and conducted the content of the article; XJM revised article for the content and supervised of the version to be published; WHTZ, JLD, HBZ, CYZ helped perform the analysis with constructive discussions.
Funding
This research is supported by the National Natural Science Foundation of China (No. 32160562, 31960090, 31960493) and the State Key Laboratory of Food Science and Technology, Nanchang University Support Program (SKLF-ZZB-202129, SKLF-ZZB-201926). The National Natural Science Foundation of China, No. 32160562, Yuanxing Wang, No. 31960090, Yuanxing Wang, No. 31960493,Yuanxing Wang, the State Key Laboratory of Food Science and Technology, Nanchang University Support Program, SKLF-ZZB-202129, Yuanxing Wang, SKLF-ZZB-201926, Yuanxing Wang.
Data availability
The datasets used and analysed during the current study are available from the corresponding author on reasonable request.
Declarations
Conflicts of interest
The authors declare that they have no competing interests.
Footnotes
Publisher's Note
Springer Nature remains neutral with regard to jurisdictional claims in published maps and institutional affiliations.
Liqin Ge, Yuqin Wu authors have contributed equally to this work and should be regarded as co-first authors.
References
- An A, Capucine B, Fien VL, Bruno DM, Norbert DK. Amino acid catalysis of 2-alkylfuran formation from lipid oxidation-derived α, β-unsaturated aldehydes. J Agr Food Chem. 2011;59:11058–11062. doi: 10.1021/jf202448v. [DOI] [PubMed] [Google Scholar]
- Barriuso B, Astiasarán I, Ansorena D. A review of analytical methods measuring lipid oxidation status in foods: a challenging task. Eur Food Res Tech. 2013;236:1–15. doi: 10.1007/s00217-012-1866-9. [DOI] [Google Scholar]
- Brunton NP, Cronin DA, Monahan FJ, Durcan R. A comparison of solid-phase microextraction (SPME) fibres for measurement of hexanal and pentanal in cooked turkey. Food Chem. 2000;68:339–345. doi: 10.1016/S0308-8146(99)00203-4. [DOI] [Google Scholar]
- Estaca JG, Dicastillo CL, Muñoz PH, Catalá R, Gavara R. Advances in antioxidant active food packaging. Trends Food Sci Tech. 2014;35:42–51. doi: 10.1016/j.tifs.2013.10.008. [DOI] [Google Scholar]
- Eveleth PB. Physical status: the use and interpretation of anthropometry. report of a WHO Expert Committee. Am J Hum Biol. 1996;8:786–878. doi: 10.1002/(SICI)1520-6300(1996)8:6<786::AID-AJHB11>3.0.CO;2-I. [DOI] [Google Scholar]
- Gluckman PD, Hanson MA, Cooper C, Thornburg KL. Effect of in utero and early-life conditions on adult health and disease. New Engl J Med. 2008;359:61–73. doi: 10.1056/NEJMra0708473. [DOI] [PMC free article] [PubMed] [Google Scholar]
- Kalua CM, Allen MS, BedgoodJr DR, Bishop AG, Prenzler PD, Robards K. Olive oil volatile compounds, flavour development and quality: a critical review. Food Chem. 2007;100:273–286. doi: 10.1016/j.foodchem.2005.09.059. [DOI] [Google Scholar]
- Lampi AM, Damerau A, Li J, Moisio T, Partanen R, Forssell P, Piironen V. Changes in lipids and volatile compounds of oat flours and extrudates during processing and storage. J Cereal Sci. 2015;62:102–109. doi: 10.1016/j.jcs.2014.12.011. [DOI] [Google Scholar]
- Langley SC. Nutrition in early life and the programming of adult disease: a review. J Hum Nutr Diet. 2015;28:1–14. doi: 10.1111/jhn.12212. [DOI] [PubMed] [Google Scholar]
- Lessen R, Kavanagh K. Position of the academy of nutrition and dietetics: promoting and supporting breastfeeding. J Acad Nutr Diet. 2015;115:444–449. doi: 10.1016/j.jand.2014.12.014. [DOI] [PubMed] [Google Scholar]
- Llatas GG, Lagarda MJ, Romero F, Abellan P, Farre R. A headspace solid-phase microextraction method of use in monitoring hexanal and pentane during storage: Application to liquid infant foods and powdered infant formulas. Food Chem. 2007;101:1078–1086. doi: 10.1016/j.foodchem.2006.03.007. [DOI] [Google Scholar]
- Lozano PR, Miracle ER, Krause AJ, Drake M, Cadwallader KR. Effect of cold storage and packaging material on the major aroma components of sweet cream butter. J Agr Food Chem. 2007;55:7840–7846. doi: 10.1021/jf071075q. [DOI] [PubMed] [Google Scholar]
- Martin CR, Ling PR, Blackburn GL. Review of infant feeding: key features of breast milk and infant formula. Nutrients. 2016;8:279. doi: 10.3390/nu8050279. [DOI] [PMC free article] [PubMed] [Google Scholar]
- Mary CO, Maria DG, Julia L. A critical review: early life nutrition and prenatal programming for adult disease. J Clin Nurs. 2015;24:23–24. doi: 10.1111/jocn.12951. [DOI] [PubMed] [Google Scholar]
- Pham AJ, Schilling MW, Mikel WB, Williams JB, Martin JM, Coggins PC. Relationships between sensory descriptors, consumer acceptability and volatile flavor compounds of American dry-cured ham. Meat Sci. 2008;80:728–737. doi: 10.1016/j.meatsci.2008.03.015. [DOI] [PubMed] [Google Scholar]
- Pignoli G, Bou R, Estrada MTR, Decker EA. Suitability of saturated aldehydes as lipid oxidation markers in washed turkey meat. Meat ScI. 2009;83:412–416. doi: 10.1016/j.meatsci.2009.06.019. [DOI] [PubMed] [Google Scholar]
- Shahidi F, Rubin LJ, D'Souza LA, Teranishi R, Buttery RG. Meat flavor volatiles: a review of the composition, techniques of analysis, and sensory evaluation. Crit Rew Food Sci. 1986;24:141–243. doi: 10.1080/10408398609527435. [DOI] [PubMed] [Google Scholar]
- Siek TJ, Albin IA, Sather LA, Lindsay RC. Comparison of flavor thresholds of aliphatic lactones with those of fatty acids, esters, aldehydes, alcohols, and ketones1, 2. J Dairy Sci. 1971;54:1–4. doi: 10.3168/jds.S0022-0302(71)85770-3. [DOI] [Google Scholar]
- Sonia E, Francesco MG, Roberto S, Ibanez R, Agnese T, Stefania U, Maurizio S. Monitoring of virgin olive oil volatile compounds evolution during olive malaxation by an array of metal oxide sensors. Food Chem. 2009;113:345–350. doi: 10.1016/j.foodchem.2008.06.074. [DOI] [Google Scholar]
- Wang XD, Zhu LT, Han YX, Xu LP, Jin JH, Cai YM, Wang HM. Analysis of volatile compounds between raw and cooked beef by HS-SPME-GC-MS. J Food Process Pres. 2018;42:2. doi: 10.1111/jfpp.13693. [DOI] [Google Scholar]
- Wu TZ, Chen PH. Health consequences of nutrition in childhood and early infancy. Pediatr Neonatol. 2009;50:135–142. doi: 10.1016/S1875-9572(09)60051-6. [DOI] [PubMed] [Google Scholar]
- Xu LR, Yu XZ, Liu L, Zhang R. A novel method for qualitative analysis of edible oil oxidation using an electronic nose. Food Chem. 2016;202:229–235. doi: 10.1016/j.foodchem.2016.01.144. [DOI] [PubMed] [Google Scholar]
- Zou XQ, Ali AH, Abed SM, Guo Z. Current knowledge of lipids in human milk and recent innovations in infant formulas. Curr Opin Food Sci. 2017;16:28–39. doi: 10.1016/j.cofs.2017.06.010. [DOI] [Google Scholar]
Associated Data
This section collects any data citations, data availability statements, or supplementary materials included in this article.
Data Availability Statement
Data availability
The datasets used and analysed during the current study are available from the corresponding author on reasonable request.
The datasets used and analysed during the current study are available from the corresponding author on reasonable request.