

Abstract
Electronic tongue is a new approach for simple and fast detection, classification, and quantification of the solved compounds. Crocin is the main source of color of saffron (Crocus sativus L.). An electronic tongue system was used to predict the concentration of saffron crocin in the present study. The measurement system included an electrochemical sensor array based on voltammetry electrodes, a three-electrode cell, a potentiostat, a personal computer. Aqueous analyte were provided by blending pure crocin and different saffron samples from Iran and Spain with distilled water. Output signals of the electronic tongue system were analyzed by principal component analysis and artificial neural networks. Based on principal component analysis, the total variance among pure crocin was 99% and that of saffron samples was 100%. The accuracy of artificial neural network model was 98.80%. The results indicated that the developed electronic tongue system and artificial neural network model can successfully predict crocin concentration in saffron.
Keywords: Saffron, Crocin concentration, Electronic tongue, Voltammetry, Sensor
Introduction
Saffron is derived from spice of Crocus Sativus L. The useable part of the flowers is the end of the three-branched stigma that is known as saffron and has a flavor aroma with slightly bitter taste. The color of saffron is related to the presence of a substance known as crocin (Heidarbeigi et al. 2015). Crocin has a molecular weight of 976.97 g per mole with chemical formula of C44H64O24 (Gohari et al. 2013). The properties of this substance can be easily explained by an electron transport mechanism with high sensitivity, high stability, and the excellent electrocatalytic response in a low voltage. Crocin is one of the few naturally carotenoids that can easily be solved in water (Nam et al. 2010). Saffron and mainly crocin possess desirable flavor (Singh et al. 2010; Campo et al. 2009) and beneficial medicinal properties mainly on human nervous system (Nassiri-Asl et al. 2014; Khalatbari-mohseni et al, 2019).
Determination of saffron quality and its coloring strength depends on quantification of crocin by various methods such as colorimetric, NIR (Zalacain et al. 2005), UV–Vis methods (Sanchez et al. 2008), and chromatographic techniques such as GC–Ms (Carmona et al. 2006; Haghighi et al. 2007), TLC (Iborra et al. 1992), and HPLC (Abdullave and Ortega 2007; Kosar et al. 2017; Carmona et al. 2007).
In post-harvest processing of agriculture and food products, quality assessments of the products have high importance to reach high reliability. Nondestructive techniques for examining and evaluating agricultural products have been expanded using various methods. Applying nondestructive methods cause to decrease wastes in agriculture and food industry sector and increase the accuracy of identifying contaminants and so food quality at different stages of packaging and storage. Because quality assurance is one of the most important goals of industry, it requires a reasonable, low-cost, and non-destructive method to measure the quality of food and agricultural products (Bhattacharyya 2010; Cho and Kang 2016).
Electronic tongue (ET) system is an analytical tool that includes a nonspecific set of low-selective electrochemical sensors with high stability and mutual sensitivity to different types of solutions. Also it needs an appropriate method for calibration or multivariate processing of data (Vlasov et al. 2005). The electronic tongues use a series of sensors that respond to salts, acids, sugars, and bitter compositions for sending signals to a processor for analysis the signals and obtaining the usable results (Baldwin et al. 2011). High speed and low cost of analysis as well as the simplicity of the electronic tongue made the system to be a promising tool for various research fields and also they have vast applications in agriculture and food industries (Podrazka et al. 2018). Therefore, many researches applied electronic tongue for analysis of apple varieties (Rudnitskaya et al. 2006), adulteration in cherry juice (Hong and Wang 2014), olive oil (Souayah et al. 2017; Harzalli et al. 2018), wine (Para et al. 2006; Pigani et al. 2008), honey (Dias et al. 2008), tea (Chen et al. 2008), milk (Paixao et al. 2009), and other food (Baldeon et al. 2015; Medina-Plaza et al. 2014). Up to now, only two researches have been reported showing electronic tongue applications related to saffron analysis (Heidarbeigi et al. 2016; Tahri et al. 2015). Thus, the aim of this study includes using and evaluating an intelligent technique based on e-tongue system coupled with artificial neural network for prediction of crocin concentration in different saffron samples according to their electrochemical behavior.
Materials and methods
The concept diagram for the data acquiring setup is shown in Fig. 1. As shown in the figure, different steps were followed as (1) Sample preparation (saffron aqueous solution and different crocin concentration solution with and without buffer), (2) Setup electronic tongue and acquiring voltammograms from electrochemical analysis of electrodes in analytes, (3) Data processing by Principal component analysis (PCA) and Artificial neural networks (ANN) methods for detecting crocin concentration in saffron solution.
Fig. 1.

Conceptual diagram for the data acquiring setup
Samples and chemicals reagent
The six saffron samples from different regions of Iran and Spain were considered to be studied in the present research. Two Iranian saffron samples were purchased from Novin Saffron Co. (Mashhad, Iran) and a third saffron sample was from saffron farming area in the Qaen County (South Khorasan, Iran). These saffron samples were belonged to grade I according to ISO 3632 (2011) (Heidarbeigi et al. 2016).
The Spanish saffron samples belonged to the protected designation of origin ‘Azafrán de La Mancha’, being from three different harvest periods (2011, 2012, and 2013) and selected from the commercial category I, II, and III (ISO 3632, 2011).
The pure crocin sample with 99% purity was purchased from Sigma Aldrich Co. (Madrid, Spain). The saffron samples and pure crocin were stored in refrigerator at 4 °C and kept far from light before conducting the experiments (Carmona et al. 2007). Sodium Hydroxide (NaOH), Hydrochloric acid (HCL), Sodium Hydrogen Phosphate (Na2HPO4), Sodium Dinitrogen Phosphate 2H2O (NaH2PO4.2H2O), ethanol (C2H5OH), Potassium Chloride (KCl), Silver Nitrate, Sodium Bore, and Sodium Nitrate were purchased from the Sigma Co.
Saffron aqueous solution (analyte) was prepared with 0.5 molar concentrations in distilled water. For this purpose, 25 mg of saffron was weighed with accuracy of 0.1 mg. Then, 40 ml of distilled water was added to the sample. Then solution was stirred in the absence of light at ambient temperature using a magnetic stirrer at 1000 rpm for 1 h. After taking out the magnet, the volume of the solution was increased to be 50 ml by adding distilled water. The obtained solution was passed through a filter and diluted by a 1:10 ratio with distilled water (Campo et al. 2009).
Preparation of standard crocin solution
To prepare 0.01 M crocin solution, 0.0976 g of crocin was solved in 10 ml water and used as a standard solution . To investigate the behavior of the sensors in reaction with crocin, two types of crocin aqueous solutions were used: crocin with and without buffer.
Crocin without buffer
To prepare crocin in the solution with 0.99 µM concentration without buffer, the amount of 0.00848 g of crocin was deposited in a 50 ml laboratory flask and then distilled water was added to reach the volume and the CV was measured. For other concentrations, the amount of 0.0048 g of crocin (Eq. 1) was poured into the flask and was reached to the volume by adding distilled water then its Cyclic voltammograms (CV) was measured. This task was continued to provide different concentration to 9.09 µM.
| 1 |
Crocin in the presence of buffer
To prepare various crocin concentrations from 0.99 to 9.09 with different pHs, each time the amount of 350 μl of crocin standard solution was added to the buffer solution and its CV was measured. This was repeated for different concentrations. The cell and electrodes were washed by distilled water in each pH measuring test.
Electronic tongue system
The electronic tongue system had two main components: hardware and software. The hardware part included a personal computers, a potentiostat, a sensor array, and the system layout. Potentiostat was connected to a three-electrode cell (Fig. 2).
Fig. 2.
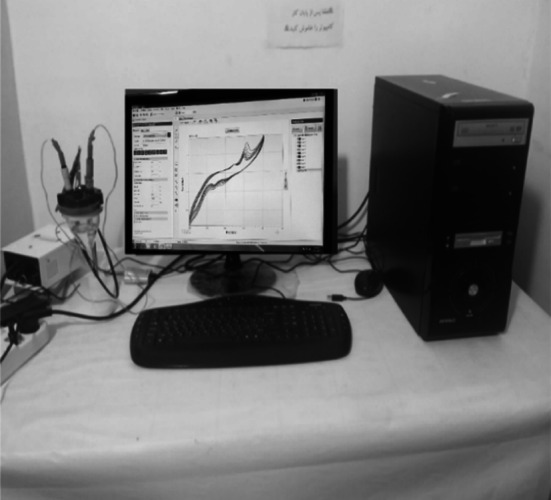
The electronic tongue system setup
A chamber (cell) with 50 ml volume was used for conducting the experiments by electronic tongue and putting electrodes in the analyte. To prevent the effects of light on the experiments, the cell and other testing equipment were covered with an aluminum foil. The cell was washed with distilled water before each test.
All electrochemical measurements were carried out using a microautolab device (Metrohm Co., Swiss) connected to a personal computer and PSTrace4.6 Software. The computer was used to analyze the data and plot the diagrams. Cyclic voltammetry experiments were carried out in phosphate buffer solution with different pH values at the absence of light and with different crocin and saffron concentrations.
The three-electrode cell included an Ag/AgCl electrode as a reference electrode, platinum (Pt) wire as auxiliary electrode, and four working electrodes. Sensor array (working electrodes) included bare glassy carbon (GC), modified glassy carbon, gold (Au), and platinum (Pt) electrodes. The cyclic voltammograms were registered in the potential range from − 1 to + 1 (vs. Ag/AgCl) with scan rate of 50 mV.s−1 at room temperature. Each working electrode was immersed in solutions and the repeatability of the voltammograms was evaluated with 10 replication for each sample. The calibration curves of crocin solutions were plotted with concentrations ranging from 0.99 to 9.09 μM.
Modifying the glassy carbon electrode by silver nanoparticles
For preparation of silver nanoparticles, 1 ml of silver nitrate (100 mM/L), 1 ml of NaBH4 (25 mM/L), and 24 ml of trisodium citrate (100 mM/l) were slowly added to 400 ml cooled boiled water. After two hours of stirring, a solution with transparent yellow color without any sediment was obtained (Roushani and Shahdost-fard, 2015). Before modification, the glassy carbon electrode was polished by emery paper and alumina powder. Then it was placed in deionized water and nitric acid with 1:1 ratio and then was put in an ultrasonic bath for 10 m and finally washed twice by distilled water to be completely clean. To modify the glossy carbon electrode, 5 µl of silver nanoparticles was used to inject on the electrode surface using a 10 μl sampler. After covering the electrode surface, it was dried at ambient temperature for 1 h.
Data processing
The obtained sensor signals were recorded in the personal computer and were preprocessed to be normalized and then used by the analytical methods. The e-tongue measures were organized by considering 4 electrodes and a rectangular matrix (4 × 10). For each crocin concentration and saffron sample, ten different voltammograms were obtained with regard to the presence of 4 electrodes in the electronic tongue system.
After preprocessing, the features were used as input of PCA and ANN for determining the concentration of crocin in saffron samples. The MATLAB and Unscrambler (CAMO ASA, Norway) softwares were used to apply the methods. Also the radar diagrams were plotted in Excel Software.
Results and discussion
In the present study, the electrochemical behaviors of the used sensors including glassy carbon, modified glassy carbon by silver nanoparticles, gold, and platinum electrodes were investigated in 0.1 M sodium hydrogen phosphate solution (Na2HPO4), sodium dinitrogen phosphate 2H2O (NaH2PO4.2H2O) as analyte with different pHs, different crocin concentrations, and different saffron samples.
Electrochemical response in electrolytes
In order to determine the optimal pH, cyclic voltammograms of four working electrodes were registered in a 0.1 ML−1 solution of phosphate buffer in the presence of 700 μl of crocin at different pHs from 2 to 12 with 50 mV/s scan rate. The optimal PH is the value that has the highest current and obvious peak.
In the present research, the pH range of 2–12 was considered and the crocin solubilization was done with constant concentration of 700 μl for each pH. Modified/unmodified glassy carbon electrodes had no peak at pHs higher than 5. So, the results gave the best response to current increase and potential peak change at pH = 2. Therefore, with modified and unmodified glassy carbon electrodes, acidic pH was selected as the optimal pH. The maximum sensitivity of the gold and platinum electrodes was recorded at pH = 12. Therefore, the optimal pH for gold and platinum sensors was obtained as pH12.
Electrocatalytic effect of sensors towards pure crocin
The electrodes were used to analyze crocin typically found in saffron. The crocin solution did not produce noticeable electrochemical responses when analyzed with working electrodes without buffer. Therefore, electrocatalytic effect of electrodes was analyzed for different crocin concentrations in obtained optimal pHs of 0.1 ML−1 phosphate buffer with scan rate of 50 mV/s. The effect of the concentration in the sensor response was studied by immersing the electrode in crocin solutions with concentrations ranging from 0.99 to 9.09 µML−1. The crocin solution for gold electrode showed better response than other sensors.
It is interesting to notice that the responses of modified and unmodified glassy carbon electrodes, the anode current (Ipa), and cathode current (Ipc) had not specific changes proportional to the increase of the crocin concentration. Also for platinum electrode, the Ipc/Ipa ratio was much higher because Ipc increased whereas Ipa had not changes. But, the gold sensor showed increase of both Ipa and Ipc with increase of crocin concentration.
The electrocatalytic current increased with increasing crocin concentration range and the calibration curves were obtained by drawing the current versus concentration and the following equations were extracted that can relate the current to crocin concentration for sensor array (Table 1). The intensities of electrode responses to crocin concentration were measured using the cathodic wave.
Table 1.
Slope and regression coefficients obtained from the voltammograms registered by working electrodes
| Electrode | Relationship with crocin concentrations (μML−1) | R2 |
|---|---|---|
| GC* | 0.9978 | |
| Modified GC | 0.9962 | |
| Pt | 0.9933 | |
| Au | 0.9965 |
Electrocatalytic behavior of sensors in saffron
After determining the optimal pH, the certain concentration of different saffron samples from Iran and Spain (Mancha, N, I, G) was added to the buffer solution and the corresponding voltammograms were ploted. The gold sensor showed better peak for different saffron samples and the glassy carbon electrode had better results for the tested Iranian samples (Fig. 3).
Fig. 3.

The cyclic voltammograms of A glassy carbon, B modified glassy carbon, C platinum and D gold sensors at saffron concentration of 2 mML−1 in a 0.1 M solution of phosphate buffer at optimal pH. F Iran, G, I, Manch, N, and N Iran present the saffron samples (Yousefi-Nejad et al., 2021)
Radar diagram
Radar diagram of the sensor responses to detect the concentration of crocin was presented in Fig. 4A. The crocin had the greatest effect on the platinum sensor and lowest effect on gold and modified/unmodified glassy carbon electrodes. Radar diagram of the sensors responses for crocin concentration in different saffron samples (Fig. 4B) showed the highest ability of platinum electrode and the other three sensors had least effect and their responses were close to each other.
Fig. 4.

The radar diagram of sensors responses to A pure crocin concentration and B crocin in different saffron samples. (The unit of the value 0, 20, 40… is µA)
Principal component analysis
The principal component analysis method was applied on the raw data to determine the correlation in sensor array signals with the concentration of crocin in crocin solution and also different saffron samples. The obtained data was applied as the input of the prediction method. The first-two principal components were plotted (Fig. 5).
Fig. 5.

The two- dimensional PCA, score plot (Left) and loading plot (Right), of sensor responses to crocin concentration in A crocin solution and B different saffron samples
The PCA shows the variance of the data and has no information about the samples classification. This method calculates Euclidean distance among center of gravity of data group and classifies samples for each chemical based on this distance. The greater the distances, the higher the differences between the samples.
Crocin concentration in pure crocin solution
The score plot of crocin concentration in pure crocin solution was shown in Fig. 5A. Based on PCA analysis, the PC1 and PC2 covered 99% of total variance as PC1 = 98% and PC2 = % 1. PCA was performed for different concentrations of crocin, but only certain concentrations including 0.99, 1.96, 2.91, and 9.09 μM of crocin were generally detected and the remaining concentrations had similar responses.
According to the loading diagram, the gold and platinum sensors were located on the second principal component close to -1 and so indicated the high ability of them to determine the crocin concentration in crocin solution. Signals from modified/unmodified glassy carbon electrodes were close together and near to the first principal component. Also, due to the position of the electrodes on the loading diagram and their distance from center, the gold and platinum electrodes were more suitable than other sensors and have a greater role in determining the crocin concentration.
Crocin concentration in saffron samples
Figure 5B show the two-dimensional score plot corresponding to the crocin in different saffron samples. All saffron samples are observable in the diagram but the crocin in the Mancha (Spain) and Novin (Iran) samples was completely recognizable which means that the concentration of crocin in these samples can be determined (Heidarbeigi et al., 2016). The rest of the studied saffron samples were close to each other which show the similar result related to crocin concentration in other saffron samples. As shown in the loading diagram (Fig. 4B), the platinum and the glassy carbon electrodes placed on the second principal component and close to − 1 and 1, respectively. The gold sensor had the low distance to the diagram center and close to the modified glassy carbon and showed the similar results.
Artificial neural networks
In the present research, different models based on artificial neural networks method with structures of three-layer multi-layer perceptron included input layer, hidden layer, and output layer were evaluated to predict the concentration of crocin in different saffron samples. The number of inputs was the number of sensors (4) with normalized data from the measured signals and the number of outputs (1) was the crocin concentration. In the ANN, non-linear tansig was used as transfer functions in the hidden and output layer and Levenberg–Marquardt algorithm was selected for network training. Three obtained data sets of samples from 80 tests were established for building the model as training, cross validation, and testing the network performance. Half of the data was considered for network training and the remained data was divided to two same groups for validation and testing. The Mean square error (MSE) was used to examine the modeling capability of the ANN and obtain the optimized network with different nodes (neurons) from 2 to 15 in hidden layer. The network was trained to minimize MSE between the network outputs and the target values. After creating different networks, the best network was selected that had the lowest Mean squared error (MSE), the highest correlation coefficient (r), and the highest Prediction accuracy (PA).
Table 2 shows the results obtained by the artificial neural networks model for predicting crocin concentration in saffron samples. The results of the error estimation parameters for artificial neural network models to predict crocin concentration in saffron selected the optimal model as 4–3–1 topology, i.e. three neurons in the hidden layer. The results of the correlation coefficient of different data for the optimal model were presented in Fig. 6.
Table 2.
The specifications of the different model structures of artificial neural networks to predict crocin concentration in saffron
| Model No | Structure | MSE* | Rmse | Mae | Mape | R | PA (%) |
|---|---|---|---|---|---|---|---|
| 1 | 4–2–1 | 0.10 | 2.21 | 1.91 | 0.73 | 0.91 | 97.15 |
| 2 | 4–3–1 | 0.03 | 4.60 | 4.47 | 1.39 | 0.98 | 98.80 |
| 3 | 4–4–1 | 0.20 | 2.42 | 2.13 | 0.77 | 0.97 | 96.40 |
| 4 | 4–5–1 | 1.08 | 3.38 | 3.26 | 0.99 | 0.98 | 98.03 |
| 5 | 4–6–1 | 0.31 | 1.90 | 1.45 | 0.43 | 0.97 | 96.84 |
| 6 | 4–7–1 | 0.49 | 2.43 | 1.15 | 0.75 | 0.91 | 97.21 |
| 7 | 4–8–1 | 0.34 | 2.15 | 1.96 | 0.63 | 0.98 | 96.70 |
| 8 | 4–9–1 | 0.22 | 2.66 | 2.30 | 0.90 | 0.89 | 96.48 |
| 9 | 4–10–1 | 0.42 | 4.11 | 3.95 | 1.10 | 0.99 | 96.56 |
| 10 | 4–11–1 | 0.48 | 3.36 | 3.00 | 0.87 | 0.88 | 88.41 |
| 11 | 4–12–1 | 0.14 | 3.52 | 3.07 | 1.12 | 0.99 | 95.62 |
| 12 | 4–13–1 | 0.06 | 3.50 | 3.11 | 0.86 | 0.96 | 97.52 |
| 13 | 4–14–1 | 0.47 | 3.02 | 2.56 | 0.83 | 1.00 | 95.08 |
| 14 | 4–15–1 | 1.96 | 5.29 | 5.02 | 1.25 | 0.75 | 89.62 |
*MSE, Rmse, Mae, Mape, r,and PA are mean square error, root mean square error, mean absolute error, mean error percentage, correlation factor of test data and prediction accuracy, respectively
Fig. 6.

The coefficient determination between the predicted and experimental data
In order to evaluate the optimal model, the new unused data for creating the model, was used to predict the crocin concentration in saffron and a linear regression was used to fit a model between the predicted and experimental data (Fig. 6). The results of this evaluation showed that there was a good linear relationship between the predicted and experimental data of crocin concentration (R2 = 0.99).
In order to compare the present work performance and other studies, it should be noted that the previous works have been focused on the saffron analysis based on common analytical methods and a few studies have been done based on ET systems were used for detection of saffron compound concentrations (Yousefi-Nejad et al, 2021; Heidarbeigi et al, 2016; Tahri et al, 2015). As observed in the Fig. 6, a very good correlation between the e-tongue system results and the crocin concentration contained in the saffron samples were obtained.
Conclusion
In the present research, multi-sensory electronic tongue was applied as a fast and low-cost system to determine the crocin concentration in saffron. For this purpose, electrodes were prepared with low detection limits, between 0.99 and 9.09 μmolL−1. According to the obtained cyclic voltammograms and the results of the principal component analysis and artificial neural networks methods, it was demonstrated that the evaluated electronic tongue system successfully predicted the crocin concentration in an aqueous saffron solution and had good function for this goal. Therefore, we believe that the proposed electronic tongue system with a simplicity operation is an accurate and reliable technique for the analysis of samples containing crocin.
The used system to analyze a particular food can be compatible with other food materials or components. But this does not mean the reuse of the systems because the bioinformatics and analysis can responses to only the tested material and the software must be redeveloped for analysis other materials.
Acknowledgements
The authors would like to appreciate the invaluable support of Ilam University in this study.
Authors' contributions
SUN: Investigation, Writing—Original Draft. KH: Conceptualization, Supervision, Methodology, Software, Formal analysis, Writing- Reviewing and Editing. MR: Resources, Investigation.
Funding
The authors would like to appreciate the invaluable support of Ilam University in this study.
Declarations
Conflict of interest
The authors have declared no conflict of interest.
Ethics approval
The work has not been published before and it is not under consideration for publication elsewhere.
Consent to participate
The MS has been approved by all authors.
Footnotes
Publisher's Note
Springer Nature remains neutral with regard to jurisdictional claims in published maps and institutional affiliations.
References
- Abdullave F, Ortega C. HPLC quantification of major active components from different saffron (Crocus sativus L) sources. Food Chem. 2007;10:1126–1131. [Google Scholar]
- Baldeon EO, Alcaniz M, Masot R, Fuentes EM, Barat JM, Grau R. Voltammetry pulse array developed to determine the antioxidant activity of camu-camu (Myrciaria dubia (H.B.K.) McVaug and tumbo (PassiFLora mollisima (Kunth) L.H. Bailey) juices employing voltammetric electronic tongues. Food Control. 2015;54:181–185. doi: 10.1016/j.foodcont.2015.01.044. [DOI] [Google Scholar]
- Baldwin EA, Bai J, Plotto A, Dea S. Electronic noses and tongues: Applications for the food and pharmaceutical industries. Sens Mol Diversity Preservation Int. 2011;11(5):4744–4766. doi: 10.3390/s110504744. [DOI] [PMC free article] [PubMed] [Google Scholar]
- Bhattacharyya N, Bandhopadhyay R. Electronic Nose and Electronic Tongue. In: Jha SN, editor. Nondestructive evaluation of food quality. 1. Berlin, Heidelberg: Springer; 2010. pp. 73–100. [Google Scholar]
- Campo CP, Garde-Cerdan T, Sanchez AM, Maggi L, Carmona M, Alonso GL. Determination of free amino acids and ammonium ion in saffron (Crocus sativus L.) from different geographical origins. Food Chem. 2009;114:1542–1548. doi: 10.1016/j.foodchem.2008.11.034. [DOI] [Google Scholar]
- Carmona M, Martinez J, Zalacain A, Rodriguez-Mendez ML, Saja JA, Alonso GL. Analysis of saffron volatile fraction by TD-GC-MS and e-nose. Eur Food Res Technol. 2006;223:96–101. doi: 10.1007/s00217-005-0144-5. [DOI] [Google Scholar]
- Carmona M, Zalacain A, Salinas MR, Alonso GL. A new approach to saffron aroma. Crit Rev Food Sci Nutr. 2007;47:145–159. doi: 10.1080/10408390600626511. [DOI] [PubMed] [Google Scholar]
- Chen Q, Zhao J, Vittayapadung S. Identification of the green tea grade level using electronic tongue and pattern recognition. Food Res Int. 2008;41(5):500–504. doi: 10.1016/j.foodres.2008.03.005. [DOI] [Google Scholar]
- Cho YJ, Kang S (2016) Emerging technologies for food quality and food safety evaluation. CRC Press 378 Pages.
- Dias LA, Peres AM, Vilas-Boas M, Rocha MA, Estevinho L, Machado AASC. An electronic tongue for honey classification. Microchim Acta. 2008;163(1–2):97–102. doi: 10.1007/s00604-007-0923-8. [DOI] [Google Scholar]
- Gohari AR, Saeidnia S, KourepazMahmoodabadi M. An overview on saffron, phytochemicals, and medicinal properties. Pharmacognosy Review. 2013;7(13):61–66. doi: 10.4103/0973-7847.112850. [DOI] [PMC free article] [PubMed] [Google Scholar]
- Haghighi B, Feizy J, Hemati-Kakhki A. LC Determination of Adulterated Saffron Prepared by Adding Styles Colored with Some Natural Colorants. Chromatographia. 2007;66(5/6):325–332. doi: 10.1365/s10337-007-0321-8. [DOI] [Google Scholar]
- Harzalli U, Rodriguesa N, Velosod A, Diasa G, Pereira J, Oueslatib S, Peres M. A taste sensor device for unmasking admixing of rancid or winey-vinegary olive oil to extra virgin olive oil. Comput Electron Agric. 2018;144:222–231. doi: 10.1016/j.compag.2017.12.016. [DOI] [Google Scholar]
- Heidarbeigi K, Mohtasebi SS, Foroughirad A, Ghasemi-Varnamkhasti M, Rafiee SH, Rezaei K. Detection of adulteration in saffron samples using electronic nose. Int J Food Prop. 2015;18(7):1391–1401. doi: 10.1080/10942912.2014.915850. [DOI] [Google Scholar]
- Heidarbeigi K, Mohtasebi SS, Serrano-Diaz J, Medina-Plaza C, Ghasemi-Varnamkhasti M, Alonso GL, Garcia-Rodriguez MV, Rafiee S, Rezaei K, Hernandez CG, Saja JA, Rodriguez-Mendez ML. Flavour characteristics of Spanish and Iranian saffron analyzed by electronic tongue. Quality Assurance Safety Crops Foods. 2016;8(3):359–368. doi: 10.3920/QAS2015.0591. [DOI] [Google Scholar]
- Hong X, Wang J. Detection of adulteration in cherry tomato juices based on electronic nose and tongue: Comparison of different data fusion approaches. J Food Eng. 2014;126:89–97. doi: 10.1016/j.jfoodeng.2013.11.008. [DOI] [Google Scholar]
- Iborra JOL, Castellar MR, Canovas MA, Manjon AR. TLC Preparative Purification of Picrocrocin, HTCC and Crocin from Saffron. J Food Sci. 1992;57(3):714–716. doi: 10.1111/j.1365-2621.1992.tb08079.x. [DOI] [Google Scholar]
- International Organization for Standarization (ISO) (2011) ISO 3632 saffron (Crocus sativus L.). Part 1: specification. Part 2: test methods. ISO, Geneva, Switzerland.
- Khalatbari-mohseni A, Banafshe HR, Mirhosseini N, Asemi Z, Ghaderi A, Omidi A. The effects of crocin on psychological parameters in patients under methadone maintenance treatment: a randomized clinical trial. Substance Abuse Treat Prevention Policy. 2019;14(9):2–8. doi: 10.1186/s13011-019-0198-1. [DOI] [PMC free article] [PubMed] [Google Scholar]
- Kosar M, Demirci B, Goger F, Kara I, Baser KHC. Volatile composition, antioxidant activity, and antioxidant components in saffron cultivated in Turkey. Int J Food Prop. 2017;20(1):746–754. doi: 10.1080/10942912.2017.1311341. [DOI] [Google Scholar]
- Medina-Plaza C, Revilla G, Munoz R, Fernandez-Escudero JA, Barajas E, Medrano G, Saja JA, Rodriguez-Mendez ML. Electronic tongue formed by sensors and biosensors containing phthalocyanines as electron mediators, Application to the analysis of red grapes. J Porphyrins Phthalocyanines. 2014;18:76–86. doi: 10.1142/S1088424613501137. [DOI] [Google Scholar]
- Nam KN, Park YM, Jung HJ, Lee JY, Min BD, Park SU, Jung WS, Cho KH, Park JH, Kang I, Hong JW, Lee EH. Anti-inflammatory effects of crocin and crocetin in rat brain microglial cells. Eur J Pharmacol. 2010;648:110–116. doi: 10.1016/j.ejphar.2010.09.003. [DOI] [PubMed] [Google Scholar]
- Nassiri-Asl M, Hosseinzadeh H. Neuropharmacology Effects of saffron (Crocus sativus) and its active constituents, Volume 1. In: Watson R, Preedy V, editors. Bioactive nutraceuticals and dietary supplements in neurological and brain disease. Prevention and Therapy: Academic Press; 2014. pp. 29–39. [Google Scholar]
- Paixao TRLC, Bertotti M. Fabrication of disposable voltammetric electronic tongues by using Prussian Blue films electrodeposited onto CD-R gold surfaces and recognition of milk adulteration. Sensors and Actuators (b) 2009;137(1):266–273. doi: 10.1016/j.snb.2008.10.045. [DOI] [Google Scholar]
- Para V, Arrieta AA, Fernandez-Escudero JA, Rodriguez-Mendez ML, Saja JA. Electronic tongue based on chemically modified electrodes and voltammetry for the detection of adulterations in wines. Sens Actuat. 2006;118(1–2):448–453. doi: 10.1016/j.snb.2006.04.043. [DOI] [Google Scholar]
- Pigani L, Foca G, Ionescu K, Martina V, Ulrici A, Terzi F, Vignali M, Zanardi C, Seeber R. Amperometric sensors based on poly(3,4-ethylenedioxythiophene)-modified electrodes: Discrimination of white wines. Anal Chim Acta. 2008;614(2):213–222. doi: 10.1016/j.aca.2008.03.029. [DOI] [PubMed] [Google Scholar]
- Podrazka M, Baczynska E, Kundys M, Jelen PS, Nery EW. Electronic Tongue-A Tool for All Tastes? Biosensors. 2018;8(1):3. doi: 10.3390/bios8010003. [DOI] [PMC free article] [PubMed] [Google Scholar]
- Roushani M, Shahdost-fard F. A novel ultrasenaitive aptasensor based on silver nanoparticles measured via enhanced voltammetric response of electrochemical reduction of riboflavin as redix probe for cocaine detection. Sens Actuat. 2015;207:764–771. doi: 10.1016/j.snb.2014.10.131. [DOI] [Google Scholar]
- Rudnitskaya A, Kirsanov D, Legin A, Beullens K, Lammertyn J, Nicola B, Irudayaraj J. Analysis of apples varieties-comparison of electronic tongue with different analytical techniques. Sens Actuat. 2006;116:23–28. doi: 10.1016/j.snb.2005.11.069. [DOI] [Google Scholar]
- Sanchez AM, Carmona M, Zalacain A, Carot JM, Jabaloyes JM, Alonso GL. Rapid determination of crocetin esters and picrocrocin from saffron spice (Crocus sativus L.) using UV-visible spectrophotometry for quality control. J Agric Food Chem. 2008;56:3167–3175. doi: 10.1021/jf703725e. [DOI] [PubMed] [Google Scholar]
- Singh AK, Singh L, Verma N. Extent and pattern of agro- morphological diversity in saffron (Crocus Sativus L) from Jammu and Kashmir in India. Soc Recent Develop Agri. 2010;10(1):232–239. [Google Scholar]
- Souayah F, Rodrigues N, Veloso A, Ana C, Dias L, Pereira A, Oueslati S, Peres M. Discrimination of Olive Oil by Cultivar, Geographical Origin and Quality Using Potentiometric Electronic Tongue Fingerprints. J Am Oil Chem Soc. 2017;94(12):1417–1429. doi: 10.1007/s11746-017-3051-6. [DOI] [Google Scholar]
- Tahri K, Bougrini M, Saidi T, Tiebe C, El-Alami-El-Hassani N, El-Bari N, Hubert T, Bouchikhi B (2015) Determination of safranal concentration in saffron samples by means of VE-tongue, SPME-GC-MS, UV-Vis spectrophotometry and multivariate analysis. IEEE Conference. Busan, South Korea.
- Vlasov Y, Legin A, Rudnitskaya A, Di Natale C, D’Amico A. Nonspecific sensor arrays (electronic tongue) for chemical analysis of liquids (IUPAC Technical Report) Pure Appl Chem. 2005;77:1965–1983. doi: 10.1351/pac200577111965. [DOI] [Google Scholar]
- Yousefi-Nejad S, Heidarbeigi K, Roushani M. Applications of electronic tongue system for quantification of safranal concentration in saffron (Crocus sativus L.) J Food Measure Characterization. 2021;15:1626–1633. doi: 10.1007/s11694-020-00723-7. [DOI] [Google Scholar]
- Zalacain A, Ordoudi SA, Diaaz-Plaza EM, Carmona M, Zquez IB, Tsimidou Z, Alonso GL. Near-infrared spectroscopy in saffron quality control: determination of chemical composition and geographical origin. J Agric Food Chem. 2005;53:9337–9341. doi: 10.1021/jf050846s. [DOI] [PubMed] [Google Scholar]