

Abstract
With an aim of studying the implication of the milling interventions and supplementation of non-wheat grains on the effect of the carbohydrate digestive profile of wheat flour the present study was conducted. Quinoa grain was selected for the study due its higher protein content and better amino acid profile than that of cereal grains. Milling of grains to produce atta (whole wheat flour) was carried out using traditional method of stone chakki mill and the other method of separation and recombination of different stream using roller mill. The atta flour was then supplemented with the quinoa flour in different combinations and the physico-chemical, rheological and product making characteristics were studied. The milling technique has an impact on the damaged starch with the difference of around 6% across the flour samples which further impacted the water absorption capacity and the gelatinization temperature of the flour. Carbohydrate digestive profile of the prepared tortillas have shown significant difference when the atta from roller mill substituted with quinoa flour upto 15%. Starch digestibility index of stone chakki atta was higher SDI (78.71) than that of roller milled quiooa supplemented flours (38.52 and 36.74). The rapidly digestible sugar decreased and the slow digestible sugar increased as compared to stone chakki atta tortillas which combinedly is responsible for lower glycaemic index. In the commercial point of view this will open a new avenue for food manufacturer to produce value added and healthy products from quinoa.
Supplementary Information
The online version contains supplementary material available at 10.1007/s13197-022-05365-9.
Keywords: Carbohydrate digestive profile, Glycaemic index, Quinoa, Tortillas
Introduction
Wheat and maize tortillas are contemplated as staple foods for the occupants of Mexico and Central America. Wheat tortillas were first developed after influx of the Spaniards who came with wheat to Mexico. Maize tortillas were headed down from the Aztecs. Wheat tortillas are being developed from whole as well as refined wheat flour, which are then mixed with water, shortening, baking powder, and other ingredients. This will produce a gluten-developed dough that can be divided into balls and formed into flat sheets. These sheets are baked on both sides to yield tortillas. Both corn and wheat flour tortillas are mainly used as wraps to produce tacos, burritos, and related products and greatly influence the nutritional status of their consumers. Quinoa is endemic in all countries of the Andean region. Quinoa cultivation is spreading and now occurs in more than 70 countries. The world quinoa production in 2017 is about 193 thousand metric tons. Chenopodium quinoa is good for vegetarians as it has good protein profile and a total protein level of about 12-18%. Quinoa seeds contain essential amino acid like lysine and good quantities of calcium, iron, phosphorus, dietary fibre and magnesium (Ruales and Nair 1992). The lipid content is higher than the cereals and is mainly located in embryo. The oil of quinoa seed is rich in polyunsaturated acid (linoleic and linolenic) and oleic acid (Alvarez et al. 2009). Its seeds range in color from ivory to pink,brown to red or almost black depending on the variety. There are about 120 species of Chenopodium but only three varieties are cultivated.
Wheat (Triticum aestivum L.) is the one of the important cereal crop for the majority of world’s population and 750 million metric tons is produced annually (Sakhare and Inamdar 2014). Wheat is most important staple food of about two billion people (36% of the world population). Tortillas are gaining popularity and are been widely accepted in many countries globally. Current study deals with the interventions of milling technology and replacement of wheat flour by quinoa flour in order to improve the nutritional characteristics and develop a product having low carbohydrate digestibility.
Materials and methods
Raw material selection
Wheat and quinoa were purchased from local markets from Mysuru, India. They were cleaned and stored in closed containers in room temperature until used.
The glucose oxidase enzyme, Aspergillus niger (128,200 units/g solid, Cat.no G7141-50KU, Lot SLBN8314V), amyloglucosidase (source Aspergillus niger, C 300U/ml, Cat.no A7095, Lot SLBJ2506V), aamylase (source Bacillus amyloliquefaciens (C 250 units/ g, Cat.no A7595, Lot SLBK3763V), pancreatin (source porcine pancreas (8 9 USP, Cat.no P7545, Lot SLBH7449V), pepsin (source porcine gastric mucosa (C 250 units/mg, Cat.no P7000, Lot BCBF9832V), and peroxidase (source horseradish (163 units/mg, Cat.no P8250, Lot SLBQ1119V), invertase (source bakers yeast, 355 units/mg solid, Cat.no I4504, Lot 111K7480), pepsin (sourcs gastric mucosa (1000 NF U/mg, Cat.no P7000, Lot BCBF9832V) were purchased from Sigma Aldrich Ltd (St. Louis, MO, USA). Analytical grade chemicals, organic solvents and triple distilled water were used for all the study.
Grain processing for flour
Cleaned raw wheat was ground for the production of whole wheat flour using two grinding techniques, one with stone chakki mill (Indica, Jumbo Model) having capacity of 3 kg per hour and the gap between the stones kept at 0.3 mm. This flour was nomenclature as control. Other grinding technique used was laboratory roller mill (Buhler, MLU 202) In this technique, flour from 3 break and 3 reduction rolls, fine and bran bran were obtained. The bran was finely ground and mixed with all the flour streams thoroughly to obtained whole wheat flour. This was named as roller milled atta (RA). Quinoa was ground in a hammer mill (HM), (Nataraj, India). The control flour and the quinoa blended in a ratio of 95:5 (A); 90:10 (B); 85:15 (C); 80:20 (D). Flours produced were packed in air tight container and stored at room temperature for further use.
Whole wheat flour chemical characterisation
Flours were tested as per methods approved American Association of Cereal Chemist (AACC 2000) for moisture (method 44-15), damaged starch (76-30 A), ash (method 08-01), protein (method 46-13) and fat (method 30-10). Dietary fibre was estimated according to method 991.43 of AOAC, 1999.
Color measurement
Measurement of color of flours was carried out by Hunter Color Lab (Color Measuring Labscan XE system, Reston, VA). Barium sulfate white board with 100% reflectance was standard control. Reflectance of the samples placed in the holder was auto-recorded for the wavelength between 360 and 800 nm. The colors were differentiated as L*, a* and b* that indicated the degrees of darkness; redness and yellowness respectively.
Dough mixing and pasting profile
Dough mixing characteristics of the dough prepared from different flours were determined by Brabender Farinograph and pasting properties by using Micro-visco Amylograph according to American Association of Cereal Chemist Methods (AACC 2000).
Tortilla preparation
Ingredients included flour (1000 g), salt (15 g), sugar (5 g), vegetable oil (70 g) sodiumbicarbonate (10 g), and water. All ingredients were scaled on the basis of 1000-g flour weight. Different amounts of water for each flour blend was added based on the water absorption data from the Farinograph and dough handling properties if required, for the flour from different grinders to get the consistency suitable for tortilla sheeting. Dough was rested for 10 min before cutting into a piece of 40gm each and was sheeted using a roller pin to a diameter of 15 cm. Electric hot plate was set at 225 °C and the sheeted dough sheet was baked on first side for 120 s and on the second side for 120 s. It was allowed to cool at room temperature.
Moisture estimation of tortilla at different time interval
Moisture of tortilla was estimated by two stage method at 0, 4, 8 and 12 h from the time of its preparation. In the first stage 20 g of sample was taken in a clean dried petri plate and covered with sieve and incubated at room temperature for overnight. The airdried samples are then powdered. From the powdered sample 2 g is weighed into an aluminium dish and kept in oven at 130°C ± 1 for 1 h.
Sensory evaluation of tortilla:
Tortillas were evaluated for appearance, tearing strength, pliability, aroma, eating quality and overall quality. Eight panellists were asked to give the scores between 0 and 20 for eating quality and between 0 and 10 for all the other parameters; desirable tortilla characteristics being the one with higher score.
Texture Studies
Tortillas were packed in polypropylene pouches (two tortilla in each pouch for the study at different time interval), heat sealed and stored in an atmosphere maintained at temperature 25 °C and 45% RH throughout the texture study. Analysis of the texture of tortillas was done using a Texture analyzer (Loyal Instruments Ltd. LR-5 K) as per the method described by Hemalatha et al. [12] with slight adjustments to suit the study. 1KN load cell was set for 50 N and deflection of 26 mm. The Warner blade speed was set at 100 mm/ min to compress the center of the Chapati and pita and the shear force was recorded.
Storage studies of quinoa enriched whole wheat flour
Storage studies of whole wheat flour were conducted only whole wheat flour C which have shown acceptable tortilla making qualities compared to control whole wheat flour tortillas. 0.5 kg quinoa whole wheat flour samples were packed in polypropylene pouches and stored at temperature of 30o C and relative humidity of 65%. Flours were tested for alcoholic acidity and moisture for a storage period of 120 days at an interval of every 30 days.
Carbohydrate Digestive Profile
Simulated gastro intestinal digestion procedure was used for the determination of carbohydrate digestive profile as mentioned by Englyst et al. (1999). Digestion of carbohydrates and glucose release pattern at 20 min represents rapidly available glucose (RAG), whereas subsequently at 100 min slowly available glucose (SAG). Total glucose (TG) was measured at 120 min after hydrolysis with potassium hydroxide and complete enzymatic digestion. Resistant Starch is the one which left undigested after 120 min of hydrolysis. Determination of free glucose was done separately and its measurement in all the fractions was carried out by glucose oxidase-peroxidase method.
Results and discussion
Grain characteristics
The moisture, protein, fat and ash content of wheat grains are 10.6%, 10.63%, 1.80% and 1.76% respectively while quinoa grains had 9.55% of moisture, 13.8% of protein, 5.1% of fat and 3.4% of ash content. The protein content of quinoa is higher than that of wheat grains. The nutritional values of wheat and quinoa are similar to those reported earlier in literature by many researchers.
Composition of quinoa enriched whole wheat flour
Results of various analysis carried out on the quinoa enriched whole wheat flour are represented in Table 1. The grains were not conditioned thus the produced whole wheat flour has lower moisture content. The moisture content of produced whole wheat flour and quinoa enriched flour is 7.63%, 8.52%, 6.77%, 6.71%, 6.26% and 6.16% of control, RA, A, B, C and D respectively. Damaged starch content of control was also highest (16.48%) compared to other flour samples. Forces acting during grinding are higher compared to the roller mill grinding resulting in the higher loss of moisture and increased starch damage (Inamdar et al. 2015). Sharma et al. (2008) observed severity of grinding in stone chakki compared to other owing to the compression force along with the shear force resulting in higher damaged starch in rice samples. The quinoa enriched whole wheat flour was analysed for ash content and it was found that there was increase in ash content of produced sample. This is owing higher mineral content in quinoa as reported by Konishi et al. (2004). A significant difference was observed in the protein content of produced whole wheat flours. It was found to be 10.14%, 10.18%, 11.5%,12.25% ,13.12% and 13.58% respectively for control, RA, A, B, C and D respectively. The dietary fiber content of produced whole wheat flour also shown an increasing trend on incorporation of quinoa grains flour. The dietary fiber content of control was found to be 9.20% while that of RA was also 9.21%. It was 10.28%,10.40%,11.21% and 11.36% for A, B, C and D respectively. The quinoa grains have higher protein and dietary fiber content compared to wheat (Vega-Gálvez et al. 2010) and thus the increase was obvious. Fat content of the produced whole wheat flour was also increased because of incorporation of quinoa. The fat content was increased from 1.73%(control) to 2.88% (D). However higher levels of vit E in quinoa makes saturated fatty acids stable to oxidation (Fleming and Galwey 1995).
Table 1.
Characteristics of quinoa enriched whole wheat flour
|
Atta
Samples |
Moisture (%) | Damaged Starch | Ash^ | Acid Insoluble Ash^ | Fat^ | Dietary fiber^ | Protein^ |
|---|---|---|---|---|---|---|---|
| Control | 7.63±0.08c | 16.48+0.90 | 1.21±0.02a | 0.028±0.003a | 1.73±0.09a | 9.20±0.17a | 10.14±0.18a |
| RA | 8.52±0.08d | 10.31+0.51a | 1.21±0.08a | 0.027±0.001a | 1.74±0.05a | 9.21±0.15a | 10.18±0.18a |
| A | 6.77±0.12b | 10.41 ±0.12a | 1.32 ±0.03b | 0.032± 0.002a | 2.46±0.15b | 10.28±0.14b | 11.50±0.16b |
| B | 6.71±0.15b | 10.43±0.15 | 1.34 ±0.02b | 0.038 ± 0.003a | 2.47±0.13b | 10.40±0.16b | 12.25±0.15c |
| C | 6.26±0.13a | 10.51±0.13 | 1.37 ±0.04c | 0.038 ± 0.001a | 2.64±0.16c | 11.21±0.18c | 13.12±0.21d |
| D | 6.16±0.09a | 10.51±0.09 | 1.42 ±0.03c | 0.032 ± 0.001a | 2.88±0.18d | 11.36±0.15d | 13.58±0.14e |
Values are given as means ± standard deviation with sample size n=3
^: On dry basis
Values in the column with the same letter in superscript are not significantly different from each other at p ≤ 0.05
Control: Stone Chakki Atta; RA: Roller flour mill atta; A: 5% quino and 95% RA; B: 10% quino and 90% RA; C: 15% quino and
85% RA; D: 20% quino and 80% RA
Repercussion of Quinoa flour on color of developed whole wheat flour and tortilla
Table 2 indicates the color of different flours as observed in hunter color lab. The color of the food product plays a crucial role in determining consumer acceptance where substitution of the traditional raw material is to be carried out for health and nutritional enhancements. Developed whole wheat flour samples shown lesser brightness with lesser L* values with increase in the percentage of the quinoa flour and ranged from 83.2 to 81.55 between control and D sample. Values for redness increased (a* value 2.12–2.38) and the yellowness increased (b* value 11.90–12.97). Similar results were observed in the tortilla prepared from the developed flours. Crumb colour of tortilla was found to be directly influenced by the formulation, because, with increased replacement whole wheat whole wheat flour by quinoa flour, the tortilla crumb tended to become darker (L* value 51.14–50.26) with lower reddish (a* 3.84–3.65) and higher yellowish (b* 16.83–19.03). Gewehr et al. (2017) and Pande et al. (2017) have reported decrease in the lightness and increase in a* and b* value in bread and chapati on addition of quinoa flakes and non-wheat grains respectively in wheat flour.
Table 2.
Moisture, texture; sensory characteristics of tortilla
| Moisure(%) # | Sensory characteristics* | Texture(Shear Force N)@ | |||||||||||||||
|---|---|---|---|---|---|---|---|---|---|---|---|---|---|---|---|---|---|
|
Tortilla Sample |
0 h | 4 h | 8 h | 12 h | Appearence (10) |
Tearing Strength (10) |
Pliability (10) |
Aroma (10) |
Eating Quality (20) |
Overall Quality (60) |
0 h | 4 h | 8 h | 12 h | |||
| Control | 31.6±0.1e | 29.9±0.2f | 28.8±0.1f | 28.4±0.1f | 8.0 ± 0.5c | 8.0 ± 0.5b | 8.0 ± 1.0ab | 8.0 ± 0.5b | 16.2 ± 0.5b | 48.2± 0.5c | 14.6 ± 0.2d | 14.5 ± 0.1e | 11.5± 0.3d | 7.7 ± 0.3b | |||
| RA | 28.6±0.1a | 27.9±0.2a | 27.8±0.1a | 27.5±0.1a | 8.0 ± 0.5c | 7.0 ± 0.5b | 8.0 ± 1.0ab | 8.0 ± 0.5b | 16.2 ± 0.5b | 47.2± 0.5c | 14.1 ± 0.2d | 14.2 ± 0.1e | 11.2± 0.3d | 7.1 ± 0.3b | |||
| A | 28.9±0.1b | 28.6±0.1b | 28.5±0.1b | 27.9±0.2b | 7.5 ± 1.0b | 8.5 ± 0.5b | 8.0 ± 0.5ab | 8.0 ± 0.5b | 15.0 ± 0.5b | 47.0± 0.5b | 14.2 ± 0.4c | 13.9 ± 0.3d | 11.12 ± 0.2c | 7.0 ± 0.1c | |||
| B | 30.2±0.2c | 30.1±0.2c | 30.1±0.2c | 30.07±0.1c | 7.5 ± 0.5b | 8.5 ± 0.5b | 8.0 ± 0.5ab | 8.0 ± 1.0b | 15.5 ± 1.0b | 47.5± 0.5a | 14.4 ± 0.3b | 13.6 ± 0.1c | 10.6 ± 0.3b | 6.3 ± 0.1b | |||
| C | 30.3±0.1d | 29.4±0.2d | 28.2±0.1d | 26.1±0.1d | 8.5 ± 0.5b | 8.0 ± 0.5b | 8.0 ± 0.5a | 7.5 ± 0.5b | 15.0 ± 0.5c | 47.5± 0.5a | 14.56 ± 0.3b | 11.4 ± 0.2c | 9.8 ± 0.1b | 6.2 ± 0.2b | |||
| D | 30.4±0.3d | 28.9±0.2e | 27.1±0.3e | 25.1±0.1e | 8.5 ± 0.5a | 7.5 ± 0.5a | 7.5 ± 0.5a | 7.5 ± 0.5a | 15. ± 1.0a | 46.0± 0.5a | 14.62 ± 0.2a | 10.1 ± 0.4a | 7.5 ± 0.1a | 5.2 ± 0.2a | |||
± SD (n=8*, 3#, 16@)
Values in the column with the same letter in superscript are not significantly different from each other at p ≤ 0.05
Refer Table 1for abbreviations
Influenced of Quinoa flour on dough mixing and pasting profile
The evaluation of dough behaviours against mixing at a specific water addition and specific constant speed is resistance of the dough which is measured by farinograph. Water absorption capacity (WAC), dough development time (DDT) and dough stability (DS) were compared for different flour samples (Fig. 1). Water absorption of control whole wheat flour was found to be 80% and 72.2% for the RA as indicated by farinograph studies. WAC increased to 72.8, 73.5, 73.9% and 74.1% respectively for developed whole wheat flour A, B, C and D respectively. Higher damaged starch in the control flour is responsible for higher water absorption in control samples as observed by Inamdar and Prabhasankar (2017). Further the increase in the water absorption in the formulations was observed with addition of quinoa flour which was in linear progression as the protein and dietery fibre content in the formulations. (Hallen et al. 2004) studied the effect of cowpea flour addition on the rheological of wheat flour and reported similar results owing to higher protein content of cowpea flours. The addition of 5% or 10% quinoa flour did not change dough rheological properties with significance difference. The water absorption decreased by 2% from the control. The gluten network which is formed in dough by disulphide bonding of gluten was capable to the addition of 5, 10 and 15% quinoa flour without changing dough Farinograph properties. It was found that incorporation of 20% quinoa affects the gluten network. There might be possibility of formation of new bonds between the gluten and quinoa flour which decreased water absorption. The addition of 20% quinoa flour had a positive effect on the farinograph characteristics (Stikic R et al. 2011). Increase in fibre content may increase the hydrogen bonding leading to higher water absorption was observed by Englyst et al. (1999). The DDT (3.8 to 3.45 min) and DS values were (1.32 min to 1.19 min) were not consistent with the other parameters and these findings are in agreement with findings of Haridas Rao et al. (1989).
Fig. 1.
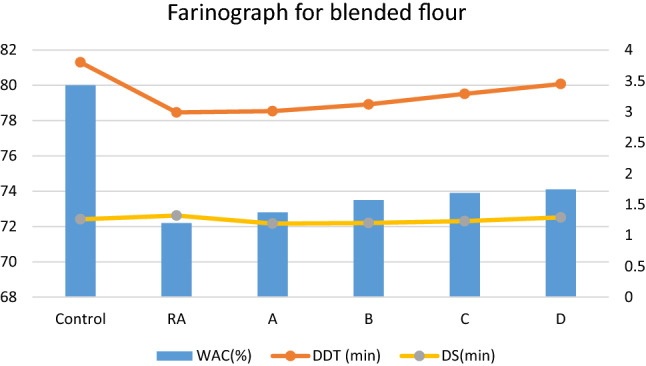
Farinograph Characteristics. WAC: Water Absorption Capacity; DDT: Dough Development Time; DS: Dough Stability. Values are given as means ± standard deviation with sample size n=3. Refer Table 1 for other abbreviations
Pasting properties studies of different flour samples are shown in Fig. 2. Gelatinization temperature which is an indication of the time required to cook in a given sample was found to be 62.64 and 62.32oC for control and RA respectively. A noticeable decrease was observed in the gelatinization temperature compared to RA with values of 63.30, 63.28, 63.18, and 62.81 °C for developed A, B, C, and D respectively. This indicates a delay in the beginning of the gelatinization temperature due to higher resistance of starch granules. Control atta had highest gelatinization temperature owing to the higher damaged starch that renders faster water binding which also is indicated by shorter dough development time of the same. The similar results were observed by Tulse et al. (2014). Hot Paste Viscosity (HPV) and Cold Paste Viscosity (CPV) of control whole wheat flour was higher compared to all other developed whole wheat flour (Fig. 2). Jyotsna et al. (2014) reported a decrease in the PV of the durum wheat semolina with the incorporation of the green gram semolina and attributed it to the lesser water-binding capacities of the starches in them. Pasting properties are mostly influenced by starch and higher starch content result in greater swelling during gelatinization which is the peak viscosity (McWatters et al. 2004).
Fig. 2.
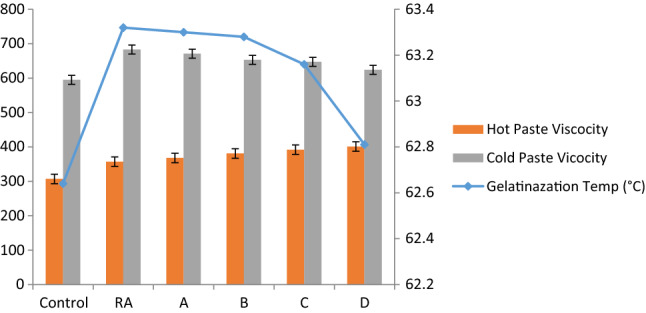
Pasting Characteristics. Values are given as means ± standard deviation with sample size n=3. Refer Table 1for abbreviations
Tortilla Characteristics
Tortillas prepared form different formulations of whole wheat flour are shown in Fig. 3. Sensory characteristics evaluated by the panel of judges (Table 2) revealed that the appearance of the control whole wheat flour tortilla was better among all the tortillas, with the light brown colour which uniformly distributed on tortilla. With the increase of the percentage of quinoa flour the colour of tortilla were turning yellowish which is similar as that of corn tortilla. The pliability changed in the final sample that is sample D because of increase content in quinoa flour. Tearing strength increased with increase in the percentage (5 and 10%) but at higher percentage it started to decrease and was lesser than control whole wheat flour tortilla. This may be attributed to the dilution of the gluten protein and their viscoelastic properties. Aroma of the control and B were similar but reduced for the tortilla of whole wheat flour C, D. A typical wheaty aroma was desirable for wheat tortilla which was found in control whole wheat flour tortilla, but at higher level of incorporation of non-wheat flour it became bland. As expected, overall eating quality of the tortilla was found to be highest for control whole wheat flour tortilla. However, the tortilla’s with B (47.5) and C (47.5) were nearer to the overall quality scores of tortillas from control whole wheat flour. It was found to be 46 for blend D. It was found that incorporation of quinoa does not affect the taste that much because of bland test of quinoa grains.
Fig. 3.

Tortilla’s prepared by using different quinoa blends. Refer Table 1for abbreviations
The estimated values of moisture content of tortilla from different whole wheat flour blends are given in Table 2. Moisture content of the tortilla at 0, 4, 8 and 12 h for control whole wheat flour and RA tortilla were found to be 31.6 and 28.6% respectively. The moisture content of the tortilla from quinoa enriched wheat flour A, B, C, and D at 0 h were found to be 28.9, 30.2, 30.3 and 30.4% respectively. The blend C was having more moisture content than that of other blends. The roller mill will produce less damage starch than that of hammer mill because of less exposure of wheat to the roller surface. This will lead to formation of less damaged starches which will absorb less water than that of hammer mill.
Results of the texture studies of tortilla conducted at various intervals are tabulated in Table 2. Shear force require to tear the tortilla from control, RA, A, B, C, and D whole wheat flour at 0 h was found to be 14.6, 14.1, 14.2, 14.4, 14.56 and 14.64 respectively. After 12 h the shear force is decreasing as found out that is for control it was found to be in the range of 5.2 to 7.2 N. The decrease in the shear force may be due to the development of brittleness over the period of time. Venkateswara Rao et al. (1986) noted a decrease in the Warner Balde shear value when chapati was stored in polyethylene pouch and attributed it to the staling of chapati and the chemical changes unrelated to moisture content.
Storage studies of quinoa enriched whole wheat flour
Whole wheat flour, when stored for a long time, passes through various types of deterioration, which in turn gives values for alcoholic acidity. The detect deterioration of whole wheat flour alcoholic acidity is measured. Alcoholic acidity was found to be gradually increased during storage up to 60 days. from 0.09 to 0.15% for developed C. However, it increased to 0.27% at the end of 120 days. A moisture content of whole wheat flour significantly increased during the storage period. It was found that 6.5, 7.5, 8.2 and 9.01 at 30,60,90 and 120 days respectively. A moisture content of the incorporated whole wheat flour with quinoa flour increased significantly during the storage period of 90 days compared to 0 days.
Carbohydrate digestive profile
The Starch digestibility index (SDI) of the samples were studied as an index of glycemic index of sample. The glycemic index of sample is important to get to know how much glucose is absorbed in blood. The glycemic index can be correlated with SDI. As the SDI of the sample decreases the available glucose will decreases that lead to reduction in glycemic index of sample. The total carbohydrate estimation was carried out by using enzymes which gives results for rapidly available glucose, slowly available glucose and total starch digestibility index. The roller milled samples were selected for carbohydrate profile analysis as roller milled sample produces less damaged starch as compared to hammer mill thus available starch for releasing glucose will be lesser. The results were shown in Fig. 4. The sample B and C got the highest sensory score among the given sample therefore they were selected for SDI determination and compared with control sample. The control sample was having higher SDI (78.71) than that of sample B and C which were 38.52 and 36.74 respectively. This shows that, the glycemic index of the sample B and sample C is lower than that of control. SDI of the sample B and sample C shows that the glycaemic index is lowered because of incorporation of quinoa. The quinoa flour helps to decrease the glycaemic index of sample which can be attributed to the nature of starches. The results are in agreement with those of (Anika Wolter et al. 2013) wherein they observed with incorporation of quiona flour, the glycaemic index of gluten free bread decreased.
Fig. 4.

Carbohydrate digestibility Profile of Tortillas on g/100 g on as is basis
The RDS (rapidly digestible starch) was high in control as compared to sample B and C. RDS of control atta was 37.63, B was 31.83 and C was found to be 30.1. The figures of RDS clearly shows that the post prandial glucose level of sample B and C will be lowered. In case of roller mill flour and quinoa enriched samples the RAG decreased significantly as roller mill produces less damage starch thus rapidly available glucose after consumption of food will be decreased. Degree of starch damage is more in case of control atta and hence more sugars are produced (Parimala and Sudha 2015). The SAG (Slowly available glucose) (5.48–7.45) and FSG (free sugar glucose) (2.22–3.3) also shown increasing trend from control to C which shows that the GI of sample is decreasing and were. Pawar et al. (2020) reported a decrease in the RAG with different milling interventions and increase in the flour with higher protein and fibre content when added to wheat flour. Thus we can conclude that the samples prepared from roller mill and having higher protein and dietary fibre content has significantly lowered the GI of product which is helpful for maintaining glucose release from sample.
Conclusion
The present study showed that incorporation of quinoa can increase the nutritional quality of whole wheat flour significantly. The quinoa incorporation in whole wheat flour will increase the use of quinoa in product making. The tortilla produced from quinoa enriched whole wheat flour has high amount of protein, fibre and mineral content. The sensory attributes of developed quinoa are matching as that of control. The quinoa enriched tortilla having high protein content than that of corn as well as wheat tortillas. For the research we also conclude that incorporation of quinoa also helps to decrease glycaemic index of tortilla thereby decreasing starch digestibility index of product. The use of quinoa flour along with wheat flour will complete amino acid profile as quinoa is also rich in lysine. The quinoa is considered as superfood and its use in traditional product will increase acceptability of product in consumers. The quinoa has proven health benefits and regular consumption is beneficial for consumers. In the commercial point of view this will open a new avenue for food manufacturer to produce value added products from quinoa.
Electronic Supplementary Material
Below is the link to the electronic supplementary material.
Authors’ contributions
AAI contributed to the conceptualisation of the study and original manuscript, RH and AKMS conducted the experiments and statistical analysis, MK did data interpretation, SDS did the table an figure designs, wrote the part of original manuscript draft, and performing critical revision.
Funding
Not Applicable.
Data availability
All data generated or analysed during this study are.
Code availability
Not applicable.
Declarations
Conflict of interest
Authors declare no conflict of interest.
Ethical approval
Not applicable.
Footnotes
Publisher’s Note
Springer Nature remains neutral with regard to jurisdictional claims in published maps and institutional affiliations.
References
- AACC . Approved methods of the AACC. 10. St. Paul, MN: American Association of Cereal Chemists; 2000. [Google Scholar]
- Analysis of AOAC International (AOAC) (2012) in official methods of AOAC, 19th edition
- Englyst KN, Englyst HN, Hudson GJ, Cole TJ, Cummings JH. Rapidly available glucose in foods: an in vitro measurement that reflects the glycemic response. Am J Clin Nutr. 1999;69(3):448–454. doi: 10.1093/ajcn/69.3.448. [DOI] [PubMed] [Google Scholar]
- Fleming JE, Galwey NW (1995) Quinoa (Chenopodium quinoa). Cereals and pseudocereals. Chapman and Hall, pp 3–83
- Gewehr MF, Danelli D, Melo LMD, Flöres SH, Jong EVD. Nutritional and technological evaluation of bread made with quinoa flakes (Chenopodium quinoa willd) J Food Process Preserv. 2017;41(2):e12803. doi: 10.1111/jfpp.12803. [DOI] [Google Scholar]
- Gorinstein S, Pawelzik E, Delgado-Licon E, Haruenkit R, Weisz M, Trakhtenberg S. Characterisation of pseudocereal and cereal proteins by protein and amino acid analyses. J Sci Food Agric. 2002;82:886–891. doi: 10.1002/jsfa.1120. [DOI] [Google Scholar]
- Hallén E, İbanoğlu Ş, Ainsworth P. Effect of fermented/germinated cowpea flour addition on the rheological and baking properties of wheat flour. J Food Eng. 2004;63:177–184. doi: 10.1016/S0260-8774(03)00298-X. [DOI] [Google Scholar]
- Haridas Rao P, Leelavathi K, Shurpalekar SR. Effect of damaged starch on chapati making quality of whole wheat flour. Cereal Chem. 1989;66:329–333. [Google Scholar]
- Inamdar AA, Sakhare SD, Prabhasankar P. Chapati making quality of whole wheat flour (Atta) Obtained by various Processing Techniques. J Food Process Preserv. 2015;39:3032–3039. doi: 10.1111/jfpp.12568. [DOI] [Google Scholar]
- Inamdar AA, Prabhasankar P. Influence of stone chakki settings on the characteristics of whole wheat flour (Atta) and its chapati making quality. J Food Process Preserv. 2017;41(3):e12966. doi: 10.1111/jfpp.12966. [DOI] [Google Scholar]
- James LE. Quinoa (Chenopodium quinoa Willd.): composition, chemistry, nutritional, and functional properties. Adv Food Nutrition Res. 2009;58:1–31. doi: 10.1016/S1043-4526(09)58001-1. [DOI] [PubMed] [Google Scholar]
- Jancurová M, Minarovičová L, Dandár A. Rheological properties of doughs with buckwheat and quinoa additives. Chem Papers. 2009;63(6):738–41. doi: 10.2478/s11696-009-0073-z. [DOI] [Google Scholar]
- Konishi Y, Hirano S, Tsuboi H, Wada M. Distribution of minerals in quinoa (Chenopodium quinoa Willd) seeds. Biosci Biotechnol Biochem. 2004;68(1):231–234. doi: 10.1271/bbb.68.231. [DOI] [PubMed] [Google Scholar]
- Lee D, Hwang W, Artan M, Jeong DE, Lee SJ. Effects of nutritional components on aging. Aging Cell. 2015;14:8–16. doi: 10.1111/acel.12277. [DOI] [PMC free article] [PubMed] [Google Scholar]
- McWatters KH, Phillips RD, Walker SL, McCullough SE, Mensa-Wilmot Y, Saalia FK, Hung YC, Patterson SP. Baking performance and consumer acceptability of raw and extruded cowpea flour breads. J Food Qual. 2004;27(5):337–351. doi: 10.1111/j.1745-4557.2004.00660.x. [DOI] [Google Scholar]
- Mousa EI, Ibrahim RH, Shuey WC, Maneval RD. Influence of wheat classes, flour extractions and baking method on Egyptian balady bread. Cereal Chem. 1979;56:563–566. [Google Scholar]
- Pande S, Sakhare SD, Bhosale MG, Haware DJ, Inamdar AA. Atta (whole wheat flour) with multi-wholegrains: flour characterization, nutritional profiling and evaluation of chapati making quality. J Food Sci Technol. 2017;54(11):3451–3458. doi: 10.1007/s13197-017-2801-7. [DOI] [PMC free article] [PubMed] [Google Scholar]
- Parimala KR, Sudha ML. Wheat-based traditional flat breads of India. Crit Rev Food Sci Nutr. 2015;55:67–81. doi: 10.1080/10408398.2011.647121. [DOI] [PubMed] [Google Scholar]
- Pawar T, Kumar P, Ashwin Kumar P, et al. Milling interventions for the production of atta for Indian flat bread with low carbohydrate digestibility. J Food Sci Technol. 2020 doi: 10.1007/s13197-020-04373-x. [DOI] [PMC free article] [PubMed] [Google Scholar]
- Quail K, McMaster G, Wootton M (1993) Flat bread production. Food Australia: Official Journal of CAFTA and AIFST. 43, 155–157
- Repo-Carrasco R, Espinoza C, Jacobsen SE. Nutritional value and use of the Andean crops quinoa (Chenopodium quinoa) andka˜ niwa (Chenopodium pallidicaule) Food Rev Int. 2003;19:179–189. doi: 10.1081/FRI-120018884. [DOI] [Google Scholar]
- Repo-Carrasco-Valencia R, A-M, Serna LA. Quinoa (Chenopodium quinoa, Willd) as a source of dietary fiber and other functional components. Food Sci Tech-Brasil. 2011;31:225–223. doi: 10.1590/S0101-20612011000100035. [DOI] [Google Scholar]
- Ruales J, Nair BM. Properties of starch and dietary fibre in raw and processed quinoa (Chenopodium quinoa, Willd.) seeds. Plant Foods Hum Nutr. 1994;45:223–246. doi: 10.1007/BF01094092. [DOI] [PubMed] [Google Scholar]
- Ruales J, Valencia S, Nair B. Effect of Processing on the Physico-Chemical Characteristics of Quinoa Flour (Chenopodium quinoa, Willd) Starch‐Stärke. 1993;45(1):13–19. doi: 10.1002/star.19930450105. [DOI] [Google Scholar]
- Sakhare SD, Inamdar AA. Indian Atta (whole wheat flour) industry: History and recent trends. Agro Food Industry Hi-Tech. 2014;25(1):66–69. [Google Scholar]
- Sharma P, Chakkaravarthi A, Singh V, Subramanian R. Grinding characteristics and batter quality of rice in different wet grinding systems. J Food Eng. 2008;88:499–506. doi: 10.1016/j.jfoodeng.2008.03.009. [DOI] [Google Scholar]
- Stikic R, Glamoclija D, Demin M, Vucelic-Radovic B, Jovanovic Z, Milojkovic-Opsenica D, Jacobsen SE, Milovanovic M. Agronomical and nutritional evaluation of quinoa seeds (Chenopodium quinoa Willd) as an ingredient in bread formulations. J Cereal Sci. 2012;55(2):132–8. doi: 10.1016/j.jcs.2011.10.010. [DOI] [Google Scholar]
- Tulse SB, Reshma V, Inamdar AA, Sakhare SD. Studies on multigrain milling and its effects on physical, chemical and rheology characteristics of milled streams. J Cereal Sci. 2014;60(2):361–367. doi: 10.1016/j.jcs.2014.05.010. [DOI] [Google Scholar]
- Vega-Gálvez A, Miranda M, Vergara J, Uribe E, Puente L, et al. Nutrition facts and functional potential of quinoa (Chenopodium quinoa Willd.), an ancient Andean grain: a review. J Sci Food Agric. 2010;90:2541–2547. doi: 10.1002/jsfa.4158. [DOI] [PubMed] [Google Scholar]
- Venkateswara Rao G, Leelavathi K, Haridas Rao P, Shurpalekar SR. Changes in the quality characteristics of chapati during storage. Cereal Chem. 1986;63(2):131–135. [Google Scholar]
Associated Data
This section collects any data citations, data availability statements, or supplementary materials included in this article.
Supplementary Materials
Data Availability Statement
All data generated or analysed during this study are.
Not applicable.