Abstract
The transformation of 1,2,4-trichlorobenzene (1,2,4-TCB) at initial concentrations in nano- and micromolar ranges was studied in batch experiments with Burkholderia sp. strain PS14. 1,2,4-TCB was metabolized from nano- and micromolar concentrations to below its detection limit of 0.5 nM. At low initial 1,2,4-TCB concentrations, a first-order relationship between specific transformation rate and substrate concentration was observed with a specific affinity (a0A) of 0.32 liter · mg (dry weight)−1 · h−1 followed by a second one at higher concentrations with an aoA of 0.77 liter · mg (dry weight)−1 · h−1. This transition from the first-order kinetics at low initial 1,2,4-TCB concentrations to the second first-order kinetics at higher 1,2,4-TCB concentrations was shifted towards higher initial 1,2,4-TCB concentrations with increasing cell mass. At high initial concentrations of 1,2,4-TCB, a maximal transformation rate of approximately 37 nmol · min−1 · mg (dry weight)−1 was measured, irrespective of the cell concentration.
Chlorinated benzenes are important starting materials and additives in the production of insecticides, fungicides, herbicides, dyes, pharmaceuticals, disinfectants, rubbers, plastics, and electric goods (2). Their toxicity (10, 11) and high persistence have led, in the last 1 or 2 decades, to prohibitions, restrictions on production and use, and legislation regulating waste disposal. Although some of the chlorobenzenes are biodegradable, they are very often present at micro- to nanomolar concentrations in drainage fluids from hazardous-waste disposal sites, lakes, rivers, and aquifers. These concentrations are mainly determined by the low water solubility of these compounds (2, 31, 44) and their occurrence at residual concentrations, beyond which no further metabolism is observed (1, 5, 18, 22, 27, 33, 34, 37).
Bacteria often must cope with fluctuations in the extracellular concentration of nutrients. One possible way to respond to this challenge is through the development of multiple uptake or transformation systems. This task can be performed either by a microbial community composed of different strains having systems with different affinities and capacities for the same substrate within mixed populations or by a single strain possessing different uptake or transformation systems. The latter possibility has been demonstrated for a number of bacteria and naturally occurring substrates (13). Reports on multiple uptake or transformation systems for xenobiotics, however, are very scarce. It was shown by Tros et al. (36) that the degradation of 3-chlorobenzoate by Pseudomonas sp. strain B13 involved two transformation systems, one operating above a concentration of 1 μM 3-chlorobenzoate and a second one operating below this concentration. Multiphasic kinetics was also observed in the transformation of the insecticide methyl parathion by a Flavobacterium species. The first system of this bacterium operated below approximately 76 nM and the second system operated below approximately 15 μM (23).
In a previous paper, it was reported that 1,2,4,5-tetrachlorobenzene, 1,2,4-trichlorobenzene (1,2,4-TCB), and the three isomeric dichlorobenzenes when supplied at an initial concentration of 500 nM were degraded by Burkholderia sp. strain PS14 to below their detection limits. For these batch experiments a cell concentration of 6.7 mg (dry weight) per liter was chosen, and it was found that 63% of the tetra- and trichlorobenzene isomers were mineralized (30). The present study presents kinetic data for the transformation of 1,2,4-TCB at nano- and micromolar concentrations in a batch system of Burkholderia sp. strain PS14. Because whole cells were used, it was not possible to distinguish between transport and transformation kinetics. Therefore, the term “transformation” of 1,2,4-TCB also includes its uptake. At low initial 1,2,4-TCB concentrations, a first-order relationship between the specific transformation rate and 1,2,4-TCB concentration was observed, followed by a second one at higher 1,2,4-TCB concentrations. The concentration range within which the first linear relationship between the specific transformation rate and initial 1,2,4-TCB concentration is observed widened with increasing cell concentration.
MATERIALS AND METHODS
Chemicals.
1,2,4-TCB was from Aldrich (Steinheim, Germany). Its solubility in water at 20°C was 165.3 μM (31). n-Hexane of analytical grade was redistilled. Water was highly purified (Milli-Q Systems; Millipore Co., Bedford, Mass.). All other chemicals were of analytical grade and were from commercial sources.
Medium and culture conditions.
Burkholderia sp. strain PS14 (32) was maintained in a fully induced state by growth in 500-ml Erlenmeyer flasks containing 100 ml of mineral salts medium (30) on a rotary shaker (120 rpm) at 30°C with 1,2,4-TCB as the sole carbon and energy source. 1,2,4-TCB was added via the vapor phase from a test tube with two holes, which was held by the seal of the screw cap. Inocula were grown in the same way, although for only 24 to 48 h. After centrifugation at 12,000 × g for 20 min at 4°C, the pellets were washed aseptically three times with mineral salts medium, resuspended in a small volume of fresh medium, and incubated for approximately 1 h at an ambient temperature to allow the intracellular substrate, as well as any substrate possibly still adhering to the cells, to be degraded. This short starvation period was chosen to ensure that the cells remained active. Inocula were checked for purity by plating bacteria on nutrient agar.
Transformation experiments.
A series of 500-ml flasks were used for these experiments. Each contained enough mineral salts medium that after inoculation and addition of 1,2,4-TCB, the total volume was 100 ml. The flasks were inoculated with strain PS14, giving a final cell concentration of 6.7 to 55 mg (dry weight) per liter. Incubation was started by adding 1,2,4-TCB from a stock solution, giving initial concentrations ranging from 0.145 to 27.6 μM. Stock solutions were prepared by dissolving 1,2,4-TCB in mineral salts medium via the gas phase (from a test tube with two holes, which was held by the seal of the screw cap). To determine the concentration of the stock solutions and to adjust the proper initial concentration of 1,2,4-TCB, standards were prepared by adding defined amounts of 1,2,4-TCB to mineral salts medium, giving a final volume of 100 ml. These standards were extracted and quantitated by gas chromatography as the samples to be analyzed. Incubations were carried out in 500-ml Erlenmeyer flasks, tightly closed with Teflon-sealed screw caps, at 30°C, with shaking at 120 rpm. Sterile controls of uninoculated media were made. In two or three 100-ml cell suspensions, degradation of 1,2,4-TCB was stopped at corresponding intervals by repeated extraction with 50 ml of redistilled n-hexane. Controls were treated in the same way.
Analytical methods.
After extraction of the cell suspensions, extracts were pooled, dried over anhydrous sodium sulfate, and concentrated, by evaporation, to 1 ml at 1.4 × 10⁴ Pa at 30°C. 1,2,4-TCB was analyzed by gas chromatography as described previously (30). Peaks were identified and quantified by comparing injections with authentic external standards, prepared by dissolving defined amounts of 1,2,4-TCB in mineral salts medium. These aqueous solutions were extracted and the extracts were concentrated in the same way as the samples to be analyzed.
Biomass measurement.
Bacterial dry weight was determined by centrifuging 1 liter of a cell suspension at 12,000 × g at 4°C. The resulting pellet was washed twice with mineral salts medium and dried to a constant weight at 60°C.
Specific affinity.
KT, the Michaelis constant related to transport, is often taken as an index of microbial affinity for a substrate, although specific affinity, aoA, is the preferred parameter because it is not normalized to maximal uptake or transformation rate and also because it specifies the value of the substrate flux. The equation for substrate uptake, v = aA · X · A (milligrams · liter−1 · hour-1), defines the specific affinity aA (liters · milligram [dry weight]−1 · hour−1) of cells at the concentration X (milligrams [dry weight] · liter−1) for the substrate at the concentration A (milligrams · liter−1) as the rate of substrate collection v/(X · A) (liters · milligram [dry weight]−1 · hour−1). As A approaches zero, aA approaches the limit, aoA, and is the initial slope of the plot of the equation as well as the initial slope of any v/X-versus-A curve, whether hyperbolic or not (7, 8).
RESULTS
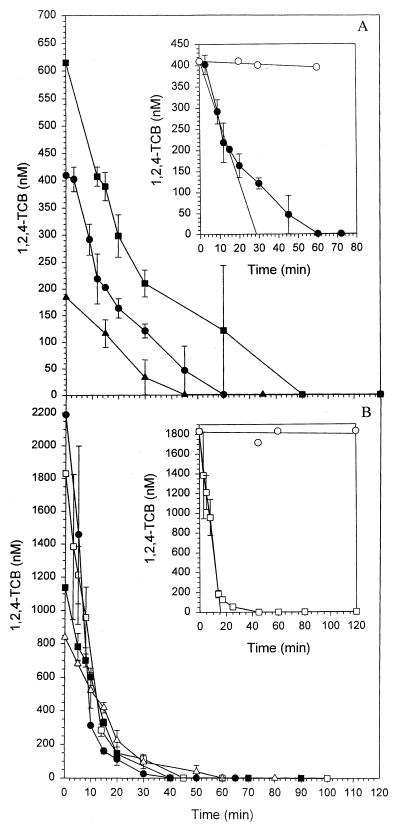
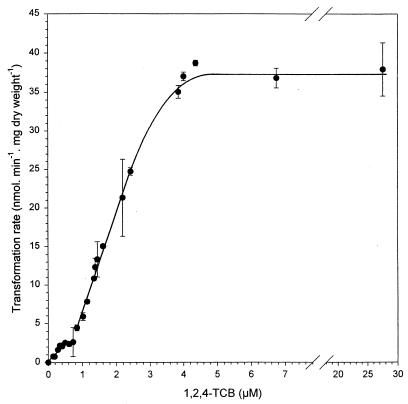
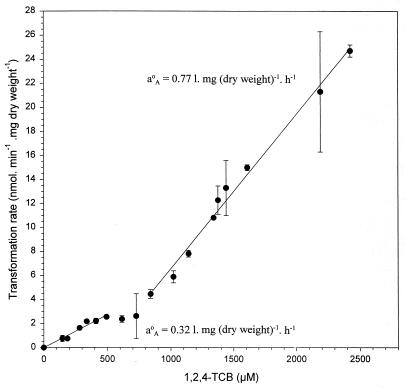
Strain PS14 at a cell concentration of 6.7 mg (dry weight) per liter degraded 1,2,4-TCB as the only carbon and energy source when it was supplied at nano- and micromolar concentrations, to below the detection limit of 0.5 nM (Fig. 1). Comparing Fig. 1A with 1B, it becomes evident that the rates of 1,2,4-TCB degradation by 6.7 mg (dry weight) per liter of PS14 were significantly lower at initial concentrations of ≤615 nM than at concentrations of ≥840 nM. This difference between the degradation rates at low and higher initial 1,2,4-TCB concentrations becomes more clear when the initial specific transformation rates are plotted against the corresponding initial 1,2,4-TCB concentrations (Fig. 2). Each of the initial specific transformation rates presented in Fig. 2 to 5 was based on at least four datum points in the linear parts of the substrate depletion curves, as demonstrated in the insets in Fig. 1. Figure 2 shows two first-order relationships between the specific transformation rate and 1,2,4-TCB concentration, one below an initial concentration of 0.5 μM and another one between 0.84 and 2.4 μM. Beyond the initial concentration of 2.4 μM, the relationship between the specific transformation rate and the initial 1,2,4-TCB concentration ceased to be linear and gradually approached the maximal specific transformation rate of approximately 37.0 nmol · mg (dry weight)−1 · min−1 at approximately 4.6 μM. Figure 3 shows these two linear relationships more clearly. The calculation of the slopes of the two first-order kinetics delivered two different specific affinities. One was 0.32 liter · mg (dry weight)−1 · h−1 measured at initial 1,2,4-TCB concentrations of ≤0.5 μM, and the other was 0.77 liter · mg (dry weight)−1 · h−1 determined between initial 1,2,4-TCB concentrations of 0.84 and 2.4 μM.
FIG. 1.
Degradation of 1,2,4-TCB at initial concentrations between 184 and 2,190 nM by Burkholderia sp. strain PS14 at a cell concentration of 6.7 mg (dry weight) per liter. (A) Initial 1,2,4-TCB concentrations of 185 nM (▴), 410 nM (●), and 615 nM (■). (B) Initial 1,2,4-TCB concentrations of 840 nM (▵), 1,138 nM (■), 1,830 nM (□), and 2,190 nM (●). (Insets) Degradation of 1,2,4-TCB at initial concentrations of 410 nM (A) and 1,830 nM (B). Regression through the linear ranges of the curves gives the initial transformation rates. Open circles represent sterile controls. Values are the means of two to four independent experiments, and regressions were carried out with these means. Error bars show standard deviations.
FIG. 2.
Kinetics of 1,2,4-TCB transformation by Burkholderia sp. strain PS14 of a cell concentration of 6.7 mg (dry weight) per liter in the concentration range up to 27.6 μM. Values are the means of two to four independent experiments. Error bars show standard deviations.
FIG. 5.
Kinetics of 1,2,4-TCB transformation by Burkholderia sp. strain PS14 of cell concentrations (milligrams [dry weight] per liter) of 6.7 (●) and 55 (▴) in a concentration range up to 6.76 μM. Values are the means of two to four independent experiments. Error bars show standard deviations.
FIG. 3.
Kinetics of 1,2,4-TCB transformation by Burkholderia sp. strain PS14 of a cell concentration of 6.7 mg (dry weight) per liter in the concentration range up to 2.4 μM. Values are the means of two to four independent experiments. Error bars show standard deviations.
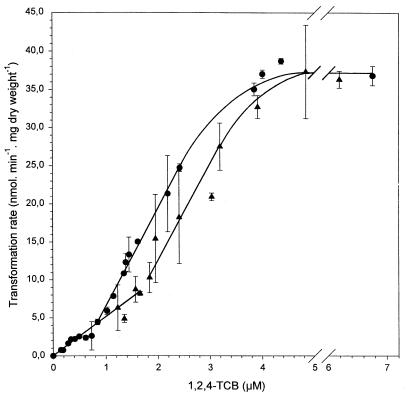
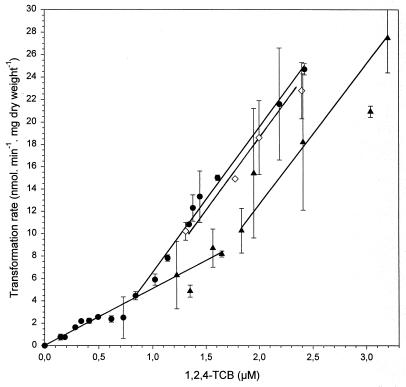
When the cell mass used for 1,2,4-TCB transformation was raised, 1,2,4-TCB concentration was also lowered to below the detection limit of 0.5 nM, but more rapidly than with 6.7 mg (dry weight) per liter (data not shown). At cell concentrations above 6.7 mg (dry weight) per liter, neither the specific affinities nor the maximal specific transformation rate changed (Fig. 4 and 5). With increasing cell mass, however, the transition from the first-order kinetics with the lower specific affinity to that with the higher specific affinity was shifted towards higher initial 1,2,4-TCB concentrations. Using a cell concentration of 14.3 mg (dry weight) per liter, the first-order relationship with the higher specific affinity was only slightly shifted towards higher initial 1,2,4-TCB concentrations. However, at a cell concentration of 55 mg (dry weight) per liter, this first-order kinetics with the higher specific affinity was shifted considerably towards higher initial 1,2,4-TCB concentrations. By this means, the first-order kinetics with the lower specific affinity was extended to an initial 1,2,4-TCB concentration of approximately 1.65 μM and the first-order kinetics with the higher specific affinity ranged over an initial 1,2,4-TCB concentration of approximately 1.8 to 3.4 μM (Fig. 4 and 5). At higher initial 1,2,4-TCB concentrations, the relationship between specific transformation rate and 1,2,4-TCB concentration was no more linear, and at an initial concentration of approximately 4.8 μM 1,2,4-TCB, it reached the same maximal transformation rate of approximately 37 nmol · mg (dry weight)−1 · min−1 as with 6.7 mg (dry weight) per liter (Fig. 5).
FIG. 4.
Kinetics of 1,2,4-TCB transformation by Burkholderia sp. strain PS14 at cell concentrations (milligrams [dry weight] per liter) of 6.7 (●), 14.3 (◊), and 55 (▴) in a concentration range up to 3.2 μM. Values are the means of two to four independent experiments. Error bars show standard deviations.
DISCUSSION
The results presented here extend previous observations of the degradation of 500 nM 1,2,4-TCB by Burkholderia sp. strain PS14 at a cell concentration of 6.7 mg (dry weight) per liter in batch experiments (30) to higher and lower 1,2,4-TCB concentrations and higher cell masses as well. It was confirmed that in batch experiments with strain PS14 not only at nano- but also at micromolar 1,2,4-TCB concentrations, no measurable residual 1,2,4-TCB concentration exists. This agrees with the postulate of Tros et al. (36) that in liquid aerobic batch cultures a residual concentration is not likely, since the maintenance requirement of cells implies continued utilization of substrate until all available substrate is exhausted. Two first-order relationships between the specific rate of transformation of 1,2,4-TCB by strain PS14 and the initial 1,2,4-TCB concentration were observed. Due to the succession of these two first-order kinetics, interrupted only by a short transition phase, which may represent the saturation of the transformation system operating at low initial 1,2,4-TCB concentrations, Vmax and KT of this transformation system could not be determined exactly. Moreover, KT is an ambiguous parameter, since it depends directly on Vmax (8). Therefore, specific affinity, aoA (expressed as the initial slope of the curve of substrate uptake or transformation rate per unit of biomass versus substrate concentration), was chosen as a measure of the ability of a microorganism to collect substrate from a dilute solution (6, 14). By means of the two first-order kinetics, two specific affinities were determined, one of 0.32 liter · mg (dry weight)−1 · h−1 at low initial 1,2,4-TCB concentrations and another of 0.77 liter · mg (dry weight)−1 · h−1 at higher substrate concentrations. The second linear relationship between specific transformation rate and initial 1,2,4-TCB concentration is followed by a nonlinear phase, finally changing to the maximum specific transformation rate of 37 nmol · mg (dry weight)−1 · min−1.
The data presented here suggest that Burkolderia sp. strain PS14 possesses two different uptake or transformation systems. Multiphasic uptake and transformation kinetics have been observed for a number of microorganisms and common substrates, such as glucose, phosphate, and amino acids (13, 16, 19, 21, 28, 39–41, 43). Such kinetics, however, were also reported for the transformation of 3-chlorobenzoate (36) and the insecticide parathion (23). The transformation kinetics observed in batch experiments using Pseudomonas sp. strain B13 to degrade 3-chlorobenzoate also comprised two first-order kinetics, although with much lower specific affinities than those reported in the present study. Tros et al. (36) also described two transformation systems; the first one, operating at low substrate concentrations, possessed a somewhat lower specific affinity than the second one, working at higher concentrations. At first sight, the lower specific affinities at low substrate concentrations observed in the present study and by Tros et al. (36) contradict the so-called “high-affinity, low-capacity” systems operating in other microorganisms at low concentrations. These systems are characterized by a low KT and a low Vmax (13, 16, 19, 23, 40, 43). KT is related to specific affinity as follows: KT = Vmax/aoA (6). That means that a low KT can imply a low aoA only when Vmax becomes very small. This might be the case, as explained above, with the transformation system of strain PS14 operating at low initial 1,2,4-TCB concentrations. Finally, comparing specific affinities of a wide range of microorganisms for their substrates (9, 12, 35) with those of Burkholderia sp. strain PS14 for 1,2,4-TCB, its oligotrophic behavior with chlorobenzenes as substrates becomes evident.
Degradation of chlorobenzenes by strain PS14 is initiated as in other chlorobenzene-degrading bacteria (3, 29) by a constitutively expressed chlorobenzene dioxygenase and dihydrodiol dehydrogenase (32). The chlorocatechols formed by these two enzymes are then metabolized by an inducible chlorocatechol pathway to Krebs cycle intermediates (32). The inducer of the gene coding for chlorocatechol 1,2-dioxygenase is very likely to be a chloro-cis,cis-muconate formed from the corresponding chlorocatechol (24, 25). One explanation of the observed multiphasic kinetics of transformation of 1,2,4-TCB by strain PS14 could be this different expression of the chlorobenzene-degrading enzymes. That would mean that since there is only a very small basal level of chlorocatechol 1,2-dioxygenase activity at very low 1,2,4-TCB concentrations (32, 38), 3,4,6-trichlorocatechol accumulates and attenuates the degradation of 1,2,4-TCB. At higher 1,2,4-TCB concentrations, however, the formation of chlorocatechol 1,2-dioxygenase activity is induced and the rate of transformation of 1,2,4-TCB distinctly increases.
The multiphasic kinetics of 1,2,4-TCB transformation, however, could also indicate that 1,2,4-TCB is taken up by PS14 in two different ways. The two linear relationships between transformation rate and substrate concentration may indicate that 1,2,4-TCB is taken up by diffusion, but with different specific affinities. There is increasing evidence that besides hydrophobic β-lactam antibiotics (17, 20), compounds such as formamide, acetamide, urea, and methanol can be taken up with the help of porins. It was shown that porins are involved in their transport at very low concentrations through the outer membrane of Methylophilus methylotrophus, while they pass it by simple diffusion at higher concentrations (15, 26). Furthermore, the uptake of exogenous long-chain fatty acids into Escherichia coli (4) and the translocation of extracellular toluene inside Pseudomonas putida F1 (42) require an outer membrane protein. One could suggest, therefore, that at low initial 1,2,4-TCB concentrations, at which the first-order kinetics with the lower specific affinity was observed, 1,2,4-TCB is transported through the outer membrane of strain PS14 by facilitated diffusion with the help of a protein or porin. And at higher concentrations, at which the first-order kinetics with the higher specific affinity was determined, 1,2,4-TCB could be taken up by simple diffusion through the lipid domain of the outer membrane. Such a mechanism of 1,2,4-TCB uptake would also explain the different specific affinities of strain PS14 for 1,2,4-TCB, since a protein certainly has a weaker affinity for the very hydrophobic 1,2,4-TCB than the long-chain fatty acids of the lipopolysaccharides.
The results presented in this paper did not permit distinction between the two hypotheses outlined above. Only information about the outer membrane of Burkholderia sp. strain PS14 might give the necessary insight to decide in favor of one of these two possibilities.
ACKNOWLEDGMENTS
I thank M. Sylla for technical assistance.
This research was financially supported by the German Federal Ministry of Education, Science, Research and Technology (BMBF grant 0139433).
REFERENCES
- 1.Alexander M. Biodegradation of organic chemicals. Environ Sci Technol. 1985;18:106–111. doi: 10.1021/es00135a601. [DOI] [PubMed] [Google Scholar]
- 2.Beck U. Nucleus-chlorinated aromatic hydrocarbons. In: Campbell F T, Pfefferkorn R, Rounsaville J F, editors. Ullmann's encyclopedia of industrial chemistry. 5th ed. Weinheim, Germany: VCH Verlagsgesellschaft; 1986. pp. 330–355. [Google Scholar]
- 3.Beil S, Happe B, Timmis K N, Pieper D H. Genetic and biochemical characterization of the broad spectrum chlorobenzene dioxygenase from Burkholderia sp. strain PS12. Dechlorination of 1,2,4,5-tetrachlorobenzene. Eur J Biochem. 1997;247:190–199. doi: 10.1111/j.1432-1033.1997.00190.x. [DOI] [PubMed] [Google Scholar]
- 4.Black P N. Primary sequence of the Escherichia coli fadL gene encoding an outer membrane protein required for long-chain fatty acid transport. J Bacteriol. 1991;173:435–442. doi: 10.1128/jb.173.2.435-442.1991. [DOI] [PMC free article] [PubMed] [Google Scholar]
- 5.Boethling R S, Alexander M. Effect of concentration of organic chemicals on their biodegradation by natural microbial communities. Appl Environ Microbiol. 1979;37:1211–1216. doi: 10.1128/aem.37.6.1211-1216.1979. [DOI] [PMC free article] [PubMed] [Google Scholar]
- 6.Button D K. Biochemical basis for whole-cell uptake kinetics: specific affinity, oligotrophic capacity, and the meaning of the Michaelis constant. Appl Environ Microbiol. 1991;57:2033–2038. doi: 10.1128/aem.57.7.2033-2038.1991. [DOI] [PMC free article] [PubMed] [Google Scholar]
- 7.Button D K, Robertson B R, McIntosh D, Jüttner F. Interaction between marine bacteria and dissolved-phase and beached hydrocarbons after the Exxon Valdez oil spill. Appl Environ Microbiol. 1992;58:243–251. doi: 10.1128/aem.58.1.243-251.1992. [DOI] [PMC free article] [PubMed] [Google Scholar]
- 8.Button D K. Nutrient-limited microbial growth kinetics: overview and recent advances. Antonie Leeuwenhoek. 1993;63:225–235. doi: 10.1007/BF00871220. [DOI] [PubMed] [Google Scholar]
- 9.Button D K. Nutrient uptake by microorganisms according to kinetic parameters from theory as related to cytoarchitecture. Microbiol Mol Biol Rev. 1998;62:636–645. doi: 10.1128/mmbr.62.3.636-645.1998. [DOI] [PMC free article] [PubMed] [Google Scholar]
- 10.Den Besten C, Vet J J R M, Besselink H T, Kiel G S, van Berkel B J M, Beems R, van Bladeren P J. The liver, kidney, and thyroid toxicity of chlorinated benzenes. Toxicol Appl Pharmacol. 1991;111:69–81. doi: 10.1016/0041-008x(91)90135-2. [DOI] [PubMed] [Google Scholar]
- 11.Den Besten C, Brouwer A, Rietjens I M C M, van Bladeren P J. Biotransformation and toxicity of halogenated benzenes. Hum Exp Toxicol. 1994;13:866–875. doi: 10.1177/096032719401301209. [DOI] [PubMed] [Google Scholar]
- 12.Duetz W A, Wind B, van Andel J G, Barnes M R, Williams P A, Rutgers M. Biodegradation kinetics of toluene, m-xylene, p-xylene and their intermediates through the upper TOL pathway in Pseudomonas putida (pWWO) Microbiology. 1998;144:1669–1675. doi: 10.1099/00221287-144-6-1669. [DOI] [PubMed] [Google Scholar]
- 13.Ferenci T. Adaptation to life at micromolar nutrient levels: the regulation of Escherichia coli glucose transport by endoinduction and cAMP. FEMS Microbiol Rev. 1996;18:301–317. doi: 10.1111/j.1574-6976.1996.tb00246.x. [DOI] [PubMed] [Google Scholar]
- 14.Gottschal J C. Some reflections on microbial competitiveness among heterotrophic bacteria. Antonie Leeuwenhoek. 1985;51:473–494. doi: 10.1007/BF00404494. [DOI] [PubMed] [Google Scholar]
- 15.Greenwood J A, Mills J, Jones C W. Purification, properties and physiological regulation of a putative outer-membrane porin for methanol in Methylophilus methylotrophus. FEMS Microbiol Lett. 1997;153:167–171. [Google Scholar]
- 16.Guardiola J, de Felice M, Klopotowski T, Iaccarino M. Multiplicity of isoleucine, leucine, and valine transport systems in Escherichia coli K-12. J Bacteriol. 1974;117:382–392. doi: 10.1128/jb.117.2.382-392.1974. [DOI] [PMC free article] [PubMed] [Google Scholar]
- 17.Hancock R E W, Bell A. Antibiotic uptake into Gram-negative bacteria. Eur J Clin Microbiol Infect Dis. 1988;7:713–720. doi: 10.1007/BF01975036. [DOI] [PubMed] [Google Scholar]
- 18.Hopkins B T, McInerney M J, Warikoo V. Evidence for an anaerobic syntrophic benzoate degradation threshold and isolation of the syntrophic benzoate degrader. Appl Environ Microbiol. 1995;61:526–530. doi: 10.1128/aem.61.2.526-530.1995. [DOI] [PMC free article] [PubMed] [Google Scholar]
- 19.Ishida Y, Imai I, Miyagaki T, Kadota H. Growth and uptake kinetics of a facultatively oligotrophic bacterium at low nutrient concentrations. Microb Ecol. 1982;8:23–32. doi: 10.1007/BF02011458. [DOI] [PubMed] [Google Scholar]
- 20.Ishii J, Nakae T. Specific interaction of protein-D2-porin of Pseudomonas aeruginosa with antibiotics. FEMS Microbiol Lett. 1996;136:85–90. doi: 10.1016/0378-1097(95)00497-1. [DOI] [PubMed] [Google Scholar]
- 21.Lang J M, Cirillo V P. Glucose transport in a kinaseless Saccharomyces cerevisiae mutant. J Bacteriol. 1987;169:2932–2937. doi: 10.1128/jb.169.7.2932-2937.1987. [DOI] [PMC free article] [PubMed] [Google Scholar]
- 22.LaPat-Polasko L T, McCarty P L, Zehnder A J B. Secondary substrate utilization of methylene chloride by an isolated strain of Pseudomonas sp. Appl Environ Microbiol. 1984;47:825–830. doi: 10.1128/aem.47.4.825-830.1984. [DOI] [PMC free article] [PubMed] [Google Scholar]
- 23.Lewis D L, Hodson R E, Freemann L F., III Multiphasic kinetics for transformation of methyl parathion by Flavobacterium species. Appl Environ Microbiol. 1985;50:553–557. doi: 10.1128/aem.50.3.553-557.1985. [DOI] [PMC free article] [PubMed] [Google Scholar]
- 24.McFall S M, Parsek M R, Chakrabarty A M. 2-Chloromuconate and ClcR-mediated activation of the clcABD operon: in vitro transcriptional and DNase I footprint analyses. J Bacteriol. 1997;179:3655–3663. doi: 10.1128/jb.179.11.3655-3663.1997. [DOI] [PMC free article] [PubMed] [Google Scholar]
- 25.Meckenstock R, Steinle P, van der Meer J R, Snozzi M. Quantification of bacterial mRNA involved in degradation of 1,2,4-trichlorobenzene by Pseudomonas sp. strain P51 from liquid culture and from river sediment by reverse transcriptase PCR (RT/PCR) FEMS Microbiol Lett. 1998;167:123–129. doi: 10.1111/j.1574-6968.1998.tb13217.x. [DOI] [PubMed] [Google Scholar]
- 26.Mills J, Wyborn N R, Greenwood J A, Williams S G, Jones C W. An outer-membrane porin inducible by short-chain amides and urea in the methylotrophic bacterium Methylophilus methylotrophus. Microbiology. 1997;143:2373–2379. doi: 10.1099/00221287-143-7-2373. [DOI] [PubMed] [Google Scholar]
- 27.Nielsen P H, Christensen T H. Variability of biological degradation of aromatic hydrocarbons in an aerobic aquifer determined by laboratory batch experiments. J Contam Hydrol. 1994;15:305–320. [Google Scholar]
- 28.Nissen H, Nissen P, Azam F. Multiphasic uptake of d-glucose by an oligotrophic marine bacterium. Mar Ecol Prog Ser. 1984;16:155–160. [Google Scholar]
- 29.Potrawfke T, Timmis K N, Wittich R-W. Degradation of 1,2,3,4-tetrachlorobenzene by Pseudomonas chlororaphis RW71. Appl Environ Microbiol. 1998;64:3798–3806. doi: 10.1128/aem.64.10.3798-3806.1998. [DOI] [PMC free article] [PubMed] [Google Scholar]
- 30.Rapp P, Timmis K N. Degradation of chlorobenzenes at nanomolar concentrations by Burkholderia sp. strain PS14 in liquid cultures and in soil. Appl Environ Microbiol. 1999;65:2547–2552. doi: 10.1128/aem.65.6.2547-2552.1999. [DOI] [PMC free article] [PubMed] [Google Scholar]
- 31.Rippen G. Handbuch Umweltchemikalien. Landsberg/Lech, Germany: Ecomed Verlagsgesellschaft AG&Co KG; 1991. [Google Scholar]
- 32.Sander P, Wittich R-M, Fortnagel P, Wilkes H, Francke W. Degradation of 1,2,4-trichloro- and 1,2,4,5-tetrachlorobenzene by Pseudomonas strains. Appl Environ Microbiol. 1991;57:1430–1440. doi: 10.1128/aem.57.5.1430-1440.1991. [DOI] [PMC free article] [PubMed] [Google Scholar]
- 33.Schmidt S K, Alexander M, Shuler M L. Predicting threshold concentrations of organic substrates for bacterial growth. J Theor Biol. 1985;114:1–8. [Google Scholar]
- 34.Schmidt S K, Scow K M, Alexander M. Kinetics of p-nitrophenol mineralization by a Pseudomonas sp.: effects of second substrates. Appl Environ Microbiol. 1987;53:2617–2623. doi: 10.1128/aem.53.11.2617-2623.1987. [DOI] [PMC free article] [PubMed] [Google Scholar]
- 35.Schut F, de Vries E J, Gottschal J C, Robertson B R, Harder W, Prins R A, Button D K. Isolation of typical marine bacteria by dilution culture: growth, maintenance, and characteristics of isolates under laboratory conditions. Appl Environ Microbiol. 1993;59:2150–2160. doi: 10.1128/aem.59.7.2150-2160.1993. [DOI] [PMC free article] [PubMed] [Google Scholar]
- 36.Tros M E, Schraa G, Zehnder A J B. Transformation of low concentrations of 3-chlorobenzoate by Pseudomonas sp. strain B13: kinetics and residual concentrations. Appl Environ Microbiol. 1996;62:437–442. doi: 10.1128/aem.62.2.437-442.1996. [DOI] [PMC free article] [PubMed] [Google Scholar]
- 37.Van der Meer J R, Roelofsen W, Schraa G, Zehnder A J B. Degradation of low concentrations of dichlorobenzenes and 1,2,4-trichlorobenzene by Pseudomonas sp. strain P51 in nonsterile soil columns. FEMS Microbiol Ecol. 1987;45:333–341. [Google Scholar]
- 38.Van der Meer J R, van Neerven A R W, De Vries E J, de Vos W M, Zehnder A J B. Cloning and characterization of plasmid-encoded genes for the degradation of 1,2-dichloro-, 1,4-dichloro-, and 1,2,4-trichlorobenzene of Pseudomonas sp. strain P51. J Bacteriol. 1991;173:6–15. doi: 10.1128/jb.173.1.6-15.1991. [DOI] [PMC free article] [PubMed] [Google Scholar]
- 39.Van Veen H W, Abee T, Kortstee G J J, Konings W N, Zehnder A J B. Characterization of two phosphate transport systems in Acinetobacter johnsonii 210A. J Bacteriol. 1993;175:200–206. doi: 10.1128/jb.175.1.200-206.1993. [DOI] [PMC free article] [PubMed] [Google Scholar]
- 40.Voegele R T, Bardin S, Finan T M. Characterization of the Rhizobium (Sinorhizobium) meliloti high- and low-affinity phosphate uptake systems. J Bacteriol. 1997;179:7226–7232. doi: 10.1128/jb.179.23.7226-7232.1997. [DOI] [PMC free article] [PubMed] [Google Scholar]
- 41.Walsh M C, Smits H P, Scholte M, van Dam K. Affinity of glucose transport in Saccharomyces cerevisiae is modulated during growth on glucose. J Bacteriol. 1994;176:953–958. doi: 10.1128/jb.176.4.953-958.1994. [DOI] [PMC free article] [PubMed] [Google Scholar]
- 42.Wang Y, Rawlings M, Gibson D T, Labbé D, Bergeron H, Brousseau R, Lau P C K. Identification of a membrane protein and a truncated LysR-type regulator associated with toluene degradation pathway in Pseudomonas putida F1. Mol Gen Genet. 1995;246:570–579. doi: 10.1007/BF00298963. [DOI] [PubMed] [Google Scholar]
- 43.Whiteman P A, Iijima T, Diesterhaft M D, Freese E. Evidence for a low affinity but high velocity aspartate transport system needed for rapid growth of Bacillus subtilis on aspartate as sole carbon source. J Gen Microbiol. 1978;107:297–307. [Google Scholar]
- 44.Yalkowsky S H, Valvani S C. Solubility and partitioning I: solubility of nonelectrolytes in water. J Pharm Sci. 1980;69:912–922. doi: 10.1002/jps.2600690814. [DOI] [PubMed] [Google Scholar]


