

Abstract
Background
The use of ultrasound as an adjunct to clinical swallowing evaluation provides quantitative physiological and morphological data. As a low‐risk procedure, ultrasound imaging can be performed outside of a medical setting. This is particularly important for patients living in rural areas with restricted access to a hospital. Technical advances have produced pocket‐sized ultrasound technology that is more affordable, and therefore within the fiscal reach of most allied health services.
Aims
To explore the validity and reliability of pocket‐sized ultrasound technology in dysphagia assessment.
Methods & Procedures
Data were acquired from 43 patients with dysphagia using the Clarius ultrasound device. Ultrasound and videofluoroscopic measures of hyoid and laryngeal displacement during liquid and puree swallowing were collected concurrently to quantify correlation and agreement between identical measures derived from the two instruments. Reliability of ultrasound was assessed for measures of hyoid and laryngeal displacement, tongue thickness, and size of the submental muscles in eight patients. Reliability was evaluated for the entire process of data acquisition including scanning and online measurement using an iPad in a clinical setting and for offline measurement on a computer screen to explore environmental influences on reliability.
Outcomes & Results
Results revealed poor correlation between the measures of interest across instruments. Reliability of the entire process of data acquisition in a clinical setting was insufficient while reliability was more promising for offline measurements.
Conclusions & Implications
The clinical use of pocket‐sized ultrasound devices, such as the Clarius system, for swallowing evaluation is not indicated at this time. Enhanced validity and reliability of the entire process of data acquisition are needed prior to clinical translation of such technology.
WHAT THIS PAPER ADDS
What is already known on the subject
The use of ultrasound allows for radiation‐free, non‐invasive swallowing assessment. Some data suggest that ultrasound is valid and reliable in the evaluation of swallowing using standard‐sized equipment. Insufficient validity and reliability have been reported for pocket‐sized ultrasound technology in the assessment of healthy swallowing.
What this paper adds to existing knowledge
This research is the first to provide validity and reliability data of the pocket‐sized Clarius technology in the evaluation of swallowing in patients with dysphagia. Insufficient validity and reliability of online data acquisition in a clinical environment were found. Reliability for offline measurement was more promising.
What are the potential or actual clinical implications of this work?
The clinical use of pocket‐sized ultrasound devices, such as the Clarius system, for swallowing assessment is not indicated at this time.
Keywords: ultrasound, videofluoroscopy, deglutition, dysphagia, validity, reliability
INTRODUCTION
Imaging modalities are key for swallowing assessment. Commonly used instruments for swallowing evaluation in clinical practice include videofluoroscopy and flexible endoscopy (Rugiu, 2007). While data from these tools provide important information for differential diagnosis and treatment of dysphagia, both imaging methods come with limitations. The procedures must be completed where risk factors, such as exposure to ionizing radiation during videofluoroscopic swallowing assessment, or potential complications including laryngospasm during endoscopic imaging, can be monitored. However, access to medical environments may be challenging for some patients, such as those living in rural regions or the community where mobility issues provide a barrier to hospital visits. Thus, diagnostics that are flexible to environment and affordable within the reach of healthcare settings are needed. Such instrumentation may serve as an adjunctive tool to the clinical swallowing evaluation to facilitate identification of patients who need referral to a hospital for further instrumental swallowing evaluation.
The use of ultrasound in swallowing assessment provides advantages as it is a non‐invasive, low‐risk procedure. There is research documenting ultrasound assessment of swallowing biomechanics, such as hyolaryngeal excursion (Hsiao et al., 2012), and of morphology of muscles relevant for swallowing, such as the submental muscles (Shimizu et al., 2016). Hyolaryngeal excursion is of interest in swallowing assessment because it contributes to airway protection (Daniels & Huckabee, 2014) and opening of the upper oesophageal sphincter (Jacob et al., 1989). Evaluation of morphometry may be of interest in the evaluation of training effects or to monitor muscle wasting (Feng et al., 2012).
A strong association between ultrasound and videofluoroscopic measurements of hyoid excursion in impaired swallowing has been documented (Chen et al., 2017; Hsiao et al., 2012). No significant difference between ultrasound and radiographic measurements of thyrohyoid approximation in patients with dysphagia was reported by Huang et al. (2009). Several studies have reported promising reliability of ultrasound swallowing measures in healthy subjects including hyoid excursion (Hsiao et al., 2012; Macrae et al., 2012), thyrohyoid approximation (Huang et al., 2009), tongue thickness (Tamura et al., 2012) and size of submental muscles (Shimizu et al., 2016). One study has documented good intra‐rater measurement reliability for ultrasound assessment of hyoid excursion in patients with dysphagia (Chen et al., 2017). While validity and reliability data are promising, the use of ultrasound in swallowing assessment has not translated into usual clinical practice.
Technological progress has produced economic, pocket‐sized ultrasound systems that allow for immediate online data extraction on an iPad or iPhone. Development of such devices may fulfil the requirements of portability and reduced expense. Straightforward data extraction may increase clinical applicability in a time‐constrained working context. Validity and reliability of a pocket‐sized ultrasound system in swallowing assessment in healthy subjects has been previously explored. No evidence for a significant association for ultrasound and videofluoroscopic measures of hyoid excursion and thyrohyoid approximation during swallowing was found (Winiker et al., 2021a). Intra‐ and interrater reliability for the entire process of data acquisition was poor (intraclass correlation coefficient (ICC) < 0.38) for hyoid excursion and thyrohyoid approximation and moderate (ICC = 0.56–0.70) for tongue thickness. Lower image quality of pocket‐sized ultrasound technology compared with larger instrumentation is one of the different potential explanations for these findings (Winiker et al., 2021b). Data for impaired swallowing are needed since reliability depends, in part, on the homogeneity of the sample (Bartlett & Frost, 2008).
This study evaluated the validity and reliability of a pocket‐sized ultrasound device in the assessment of swallowing in patients with dysphagia. Ultrasound measures, including hyoid excursion and thyrohyoid approximation, were validated against concurrently collected videofluoroscopic measures. Reliability was evaluated for the entire process of evaluation (data acquisition and measurement), and for measurement only to probe differential influence on measured outcome. Reliability was assessed for hyoid excursion, thyrohyoid approximation, tongue thickness and the size of the submental muscles.
MATERIALS AND METHODS
Participants
Two clinical researchers with training in dysphagia participated in the reliability study. Participants 1 and 2 were experienced in clinical practice for 22 and 4 years, respectively. Both were novice ultrasound users and trained in scanning and measurement for this study. Training was provided by two researchers with expertise in swallowing assessment using ultrasound. Training involved three half‐day sessions for participant 1 and two half‐day sessions for participant 2 and took place at a clinical research laboratory and at a hospital. A written document with example images and measurement descriptions was provided to both participants to be used as a guide during data collection. This training protocol was selected to reflect skill acquisition in a real‐world setting.
Ultrasound data were collected from 43 adult in‐ or out‐patients with dysphagia of variable aetiology who were referred for videofluoroscopic swallowing. In‐ and out‐patients were recruited from two urban secondary care hospitals within the same district. Data collection was performed in the larger of the two hospitals with a videofluoroscopy suite. Patients were recruited consecutively. Patients who were status post‐head or neck surgery were excluded. Inclusion criteria were reduced hyoid excursion or thyrohyoid approximation during swallowing, as confirmed during radiographic imaging via perceptual evaluation by participant 1. Recordings could be reviewed multiple times if required. To reduce inclusion bias, participant 2 was consulted if needed and discussion was undertaken to reach a consensus. Patient demographics including age, sex and likely aetiology of dysphagia were collected. Patients provided informed consent prior to study participation.
The study was approved by the appropriate national Health and Disability Ethics Committee (17/STH/230).
Equipment
Ultrasound
A curvilinear Clarius ultrasound scanner (C3, Clarius, Burnaby, BC, Canada) (frequency range = 2–6 MHz, depth = 3–30 cm, size = 169 × 105 × 41 mm) and a linear Clarius scanner (L7) (frequency range = 4–13 MHz, depth = 1–7 cm) were used for imaging. The scanners connected wirelessly to the Clarius application software that was installed on an iPad Air 2 (screen size 200 × 150 mm).
Videofluoroscopy
Radiographic imaging was performed using a Toshiba Ultimax Fluoroscope (ultimax‐i, Cannon medical systems, Zoetermeer, the Netherlands). Images were digitally recorded at 30 frames/s on a Medi‐capture 170 recorder (MediCap USB 170, Plymouth, PA, USA) using a low‐dose continuous screening mode. Public ImageJ software was used for measurement.
Methods of data collection
Ultrasound
Patients were seated in a chair. The ultrasound scanners were manually placed on the patient's neck's skin surface following application of aquasonic transmission gel to the transducer surface. Manual rather than fixed scanner placement was selected to improve clinical applicability. Further, there are inadequate data to suggest greater measurement precision by utilisation of scanner stabilization (Perry et al., 2016). Two‐dimensional grey‐scale imaging was performed using brightness mode and preset scanning depth and gain. If necessary, scanning settings were adjusted individually for optimal imaging quality. Data acquisition was performed with minimal required pressure against the skin. Swallowing events were captured in 20‐s video recordings. Measures of hyoid excursion and thyrohyoid approximation were acquired during swallowing. Tongue thickness and size of the submental muscles were collected at rest.
For assessment of hyoid excursion, the C3 scanner with a 7–10 cm depth and a frequency of 4 MHz, single focus, was placed in the mid‐sagittal plane submentally. It was held perpendicular to the floor of mouth, providing a view of the mandible and hyoid. Following scanning, an image depicting the hyoid at rest pre‐swallow and one showing the hyoid at maximal displacement were selected for measurement. Rest position was identified pre‐swallow while participants were holding the bolus in their mouth. Events such as coughing and clearing swallows would hinder the selection of the rest position post‐swallow. A reference line was drawn along the anterior border of the shadow cast by the hyoid. In both images, a straight measurement line was drawn between the acoustic shadows cast by the mental spine of the mandible and the intersection point of the reference line with the opacity of the hyoid (Figure 1). Hyoid excursion was calculated as percentage change (maximum distance – rest distance/rest distance × 100).
FIGURE 1.

Sonogram of the hyoid in the rest position (a) and at maximal displacement (b) for the assessment of the distance from the hyoid to the mandible (measurement line A). The shadow on the left is cast by the mandible; the shadow on the right is cast by the hyoid [Colour figure can be viewed at wileyonlinelibrary.com]
For evaluation of thyrohyoid approximation, the C3 scanner with a 1–7 cm depth and a frequency of 5 MHz, dual focus, was held at the mid‐sagittal plane overlying the thyrohyoid muscle with the image encasing the superior aspect of the hyoid and inferior aspect of the thyroid cartilage. Following scanning, the image showing hyoid and thyroid cartilage at rest pre‐swallow and the image depicting the two structures maximally approximated was selected. The visibility of the acoustic shadows of the hyoid and thyroid cartilage varied across patients. Thus, slightly different as per guideline document, the straight measurement line was drawn between the inferior or superior acoustic shadow cast by the hyoid and the inferior or superior shadow cast by the thyroid cartilage, depending on the visibility of the reference points (Figure 2). For each patient the same reference points were used for both images used for measurement. Thyrohyoid approximation was calculated as percentage change from rest to maximal approximation (maximum distance – rest distance/rest distance × 100).
FIGURE 2.

Sonogram of the distance between the hyoid and thyroid cartilage at rest (a) and at maximal approximation (b) with green measurement line D. The shadow on the left is cast by the hyoid; the shadow on the right is cast by the thyroid cartilage [Colour figure can be viewed at wileyonlinelibrary.com]
Tongue thickness was assessed in mid‐sagittal plane with the C3 scanner (depth = 7–10 cm, frequency = 4 MHz, single focus) placed under the chin and held perpendicular to the floor of mouth, providing a view of the mandible, hyoid and tongue surface. Tongue thickness was assessed prior to swallowing with the patient holding a 5 ml bolus of apple sauce (Wattie's) anteriorly in the mouth for identification of the tongue surface. An image was selected with the bolus visible on the tongue during the participant's hold position. The same measurement lines were drawn for measurement purpose as for hyoid excursion. A second line was drawn between the mid‐point of this line and the posterior edge of the bolus (Figure 3). For assessment of the cross‐sectional area of the submental muscles, the L7 scanner (depth = 3–5 cm, frequency = 10 MHz, dual focus) was placed under the chin in a coronal position, overlying the bilateral anterior belly of digastric, mylohyoid and geniohyoid muscles. Patients were asked to relax, keep their mouth closed and sit with their chin in a neutral position during scanning while the scanner was moved from anterior to posterior to find the largest and clearest boundaries for the left and the right anterior belly of the digastric muscles (Figure 4) and the geniohyoid muscles (Figure 5). For ultrasound measurement of cross‐sectional area of the submental muscles, the muscles of interest were traced. The bilateral geniohyoid muscles were calculated as a single unit including the mylohyoid at the superior border due to indistinct borders between geniohyoids and mylohyoid. This measure will be referred to as geniohyoid+ muscles.
FIGURE 3.

Sonogram of tongue thickness (measurement line D). The shadow on the left is cast by the mandible; the shadow at the right is cast by the hyoid. Lines A and B were drawn to define the measurement point at the lower side of the tongue. The only difference between the two images is that the posterior edge of the bolus on the tongue surface is outlined in red on (b) [Colour figure can be viewed at wileyonlinelibrary.com]
FIGURE 4.

Sonogram of the cross‐sectional area (outline T) of the left (a) and right (b) anterior belly of the digastric muscles [Colour figure can be viewed at wileyonlinelibrary.com]
FIGURE 5.

Sonogram of the cross‐sectional area of the geniohyoid+ muscles (outline T) [Colour figure can be viewed at wileyonlinelibrary.com]
Videofluoroscopy
Patients were seated upright in a chair in the videofluoroscopy suite with a metal disc taped to their lateral face or spine for post‐hoc calibration. Patients were instructed to maintain neutral head position and to avoid neck flexion. Data acquisition included measures of hyoid excursion and thyrohyoid approximation during swallowing. Radiopaque boluses were prepared using 100 g of X‐Opaque‐HD barium sulphate suspension formulation powder to 150 ml water for liquid boluses, and 20 g of the formulation powder to 100 g of apple sauce (Watties) for puree boluses.
For evaluation of hyoid excursion, the first image showing the hyoid at the lowest point in the bolus hold position and the image depicting the hyoid at maximal anterior superior excursion were selected. The measurement line was drawn between the anterior inferior edge of the hyoid and the mandible (Thompson et al., 2014) (Figure 6). Hyoid displacement was calculated as percentage change (maximum distance – rest distance/rest distance × 100). For assessment of thyrohyoid approximation, the first image showing thyroid and hyoid at their lowest position in the bolus hold position and the image with the two structures most approximated were selected. A line was drawn between the anterior inferior edge of the hyoid and the anterior inferior edge of the thyroid cartilage (Figure 7). If the latter was not visible, the anterior aspect of the vocal folds was used (Leonard et al., 2000). Thyrohyoid approximation was calculated as percentage change from rest to maximal approximation (maximum distance – rest distance/rest distance × 100).
FIGURE 6.

Videofluoroscopic measures of hyoid excursion. Turquoise measurement lines depicting the distance from hyoid to mandible at rest (a) and at maximal hyoid displacement (b). The dark blue drawings at the mandibular prominence were used to define the anterior measurement point [Colour figure can be viewed at wileyonlinelibrary.com]
FIGURE 7.

Videofluoroscopic measures of thyrohyoid approximation. Turquoise measurement lines depicting the distance between the hyoid and thyroid cartilage at rest (a) and at maximal approximation (b) [Colour figure can be viewed at wileyonlinelibrary.com]
Procedure
Concurrent ultrasound and videofluoroscopic imaging of hyoid excursion and thyrohyoid approximation during swallowing of one 5 ml liquid bolus and one 5 ml pureed bolus per patient was performed for the assessment of validity. Boluses were administered using a syringe to minimize the patient's body or head movements and to optimize stable transducer placement. Videofluoroscopic data were acquired by participant 1 with training in radiographic swallowing assessment and in quantitative videofluoroscopic analysis. Participant 1 wore a leaded sleeve and gloves as ultrasound acquisition required proximity to the beam during imaging due to manual ultrasound transducer placement. Immediately following dynamic measurement of swallowing biomechanics, participant 1 acquired static ultrasound data of at rest tongue thickness and cross‐sectional areas of the submental muscles with one measurement of each per patient for evaluation of online acquisition reliability. Online acquisition reliability reflects reliability of the entire process of data collection including scanning, image selection from the recording for measurement and online manual measurement on the iPad using Clarius software in a time‐constrained clinical environment in the presence of the patient. For assessment of online interrater acquisition reliability, participant 2 collected ultrasound measures of hyoid excursion, thyrohyoid approximation, tongue thickness and size of the submental muscles in 20% of the patients (n = 8) on the same day; every fifth patient was preselected to reduce selection bias.
Additionally, both participants performed offline measurements of preselected images with a mouse on a computer using ImageJ software (Schneider et al., 2012) to evaluate offline intra‐ and interrater measurement reliability. This reflects reliability of measurement only, excluding the impact of image selection from the recording and scanning on reliability. Measures were taken on two occasions. The first of the two measurement occasions took place no sooner than 27 days after online data collection to avoid recall. The second offline measurement was performed 11 days after the first offline rating (Winiker et al., 2021b). Each participant was blinded to their own and the other's measurements. Offline measurement reliability was assessed to control for the impact of scanning and image selection on reliability and to quantify reliability of measurement that was performed without pressure of time, in the absence of the patient, using a large computer screen and external software.
Analysis
R software was used for statistical analyses (R Core Team, 2017). Means and standard deviations (SD) were calculated per measure across patients acquired by participant 1. A total of 20% of the videofluoroscopic data were measured by a second rater for evaluation of interrater reliability. The second rater for videofluoroscopic analysis was a doctoral student trained in dysphagia assessment and with 3 years of experience in quantitative analysis. For evaluation of intra‐rater reliability, the second rater remeasured another randomly selected 20% of the data on a second occasion no sooner than 2 months after the first measurement.
Pearson's r coefficients were calculated for evaluation of validity. A p ≤ 0.05 indicated statistical significance. Non‐parametric Kendall's tau coefficients were calculated if the assumptions for a Pearson's analysis were not met. Coefficients were interpreted based on published guidelines (Allen, 2017). Limits of agreement were calculated, and Bland–Altman plots were created if the assumptions for agreement analysis were met. Reliability of ultrasound and videofluoroscopic data was calculated using the intra‐class correlation coefficient (ICC) and the standard error of measurement (SEM). Using a bootstrap distribution, 95% confidence intervals (CI) were calculated for each ICC. The between‐subject variance was calculated. To perform linear mixed effect analyses, lme4 (Bates et al., 2015) was used following assumption testing. For intra‐rater reliability, the subject was entered as a random effect and measurement trial as a fixed effect, while for interrater reliability, rater and subject were entered as a random effect. For the measures of hyoid excursion and thyrohyoid approximation, the effect of bolus type was tested by using a likelihood ratio test that allowed comparison of a full model with bolus as a fixed effect, to a reduced model in which bolus was not a fixed effect. Analysis was continued using the full model if a significant bolus effect was present, whereas the reduced model was used where no bolus effect was identified. For interpretation of the reliability findings, published criteria were used (Portney & Watkins, 2009): good reliability (ICC > 0.75), moderate reliability (ICC = 0.50–0.75), poor reliability (ICC < 0.50). In addition to analysis of online acquisition reliability and offline measurement reliability, online–offline measurement intra‐rater reliability was calculated post‐hoc using on‐ and offline measurements of identical images acquired by participant 1. The offline measure of the first measurement occasion of participant 1 was used for analysis. This reliability was calculated to explore if a clinical context with online data extraction impacts reliability differently than offline measurement.
RESULTS
Data were collected from 43 patients (36 males, seven females; age range = 33–96 years, mean age = 78 years). Patient details are depicted in Table 1. Descriptive statistics of group data for swallowing measures are provided in Table 2. A total of 79 of 86 measurements for hyoid excursion were considered for validity analysis, with three data points excluded for liquid swallowing and four data points excluded for puree swallowing. For thyrohyoid approximation, 74 of 86 measurements were analysed with six data points excluded for liquid and for puree swallowing, each. Reasons for data exclusion included insufficient radiographic image quality of key structures or of the calibration disc for measurement. The ultrasound images of thyrohyoid approximation of one patient failed to store. Thus, measurements from screen shots from the iPad were used for the analysis of offline measurement reliability. For intra‐rater reliability analysis of videofluoroscopic measures, one measure of thyrohyoid approximation was excluded due to insufficient image quality.
TABLE 1.
Patient details
| Aetiology of dysphagia | Number of subjects included in the validity analysis |
|---|---|
| Stroke | 13 |
| Neurodegenerative disease (Parkinson's disease, motor neurone disease) | 7 |
| Lower respiratory tract infection | 6 |
| Inclusion body myositis | 3 |
| Status post‐surgery (abdominal, spinal) | 3 |
| Myotonic dystrophy | 1 |
| Traumatic brain injury | 1 |
| Oesophageal cancer, vocal fold palsy | 1 |
| Unknown | 6 |
| Unwell, deconditioned | 3 |
TABLE 2.
Ultrasound and videofluoroscopic measures: Mean (SD)
| Measure | Bolus | Ultrasound % change) | Videofluoroscopy (% change) |
|---|---|---|---|
| Hyoid excursion | Liquid | 28.26 (9.45) | 31.05 (8.39) |
| Puree | 27.13 (9.27) | 31.66 (7.19) | |
| Thyrohyoid approximation | Liquid | 55.15 (20.71) | 29.17 (10.99) |
| Puree | 58.58 (17.81) | 29.72 (10.30) |
Results of validity analysis are shown in Table 3. The assumptions for Pearson's correlation analysis were met for the measures of hyoid excursion and violated for the measures of thyrohyoid approximation. There was evidence of positive weak correlation for ultrasound and videofluoroscopic measures of hyoid excursion during liquid swallowing and of a positive fair correlation for puree swallowing. For thyrohyoid approximation, the correlation was positive weak for liquid and for puree boluses. Post‐hoc analyses revealed that the assumptions for agreement analyses were met for all measures except for hyoid excursion during liquid swallowing. Upper and lower limits of agreement for hyoid excursion during puree swallowing were calculated at +12.18 and –22.85 per cent change. For thyrohyoid approximation, the upper and lower limits of agreement were calculated at +58.60 and –6.19 per cent change for liquid swallowing and at +60.94 and –2.95 per cent change for puree swallowing. Bland–Altman plots are illustrated for hyoid excursion during puree swallowing in Figure 8. Plots for thyrohyoid approximation for liquid and puree boluses are depicted in Figure 9. The reliability of videofluoroscopic measures of hyoid excursion was good within a rater (ICC = 0.82 [95% CI = (0.48, 0.94)]) and poor between raters (ICC = 0.49 [95% CI = (0.06, 0.79)]). For thyrohyoid approximation, good intra‐rater reliability (ICC = 0.91 [95% CI = (0.69, 0.97)]) and good interrater reliability (0.83 [95% CI = (0.48, 0.93)]) were found.
TABLE 3.
Correlation between ultrasound and videofluoroscopic measurements of hyoid excursion and thyrohyoid approximation
| Measure | Bolus | Correlation coefficient, p‐value |
|---|---|---|
| Hyoid excursion | Liquid | r = 0.33, p = 0.04* |
| Puree | r = 0.43, p = 0.01* | |
| Thyrohyoid approximation | Liquid | tau = 0.38, p < 0.01* |
| Puree | tau = 0.29, p = 0.01* |
Note: *Significant at p ≤ 0.05.
FIGURE 8.

Bland–Altman plot for hyoid excursion during puree swallowing assessed using ultrasound and videofluoroscopy (VFSS). The unit of the x‐ and y‐axes is percentage change. The mean difference between measures of the two instruments is illustrated by the thick dashed red line, with the thin dashed red lines representing the 95% confidence interval. Upper and lower limits of agreement are represented by the thick dashed blue lines, with the 95% confidence intervals represented by the thin blue lines [Colour figure can be viewed at wileyonlinelibrary.com]
FIGURE 9.
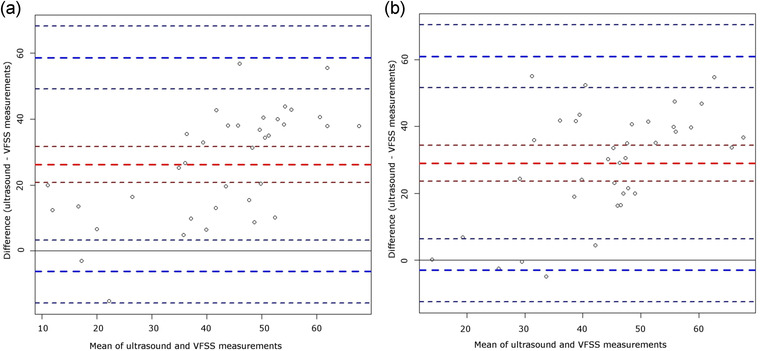
Bland–Altman plot for thyrohyoid approximation during liquid (a) and puree swallowing (b) assessed using ultrasound and videofluoroscopy (VFSS) [Colour figure can be viewed at wileyonlinelibrary.com]
No effect of bolus was found for hyoid excursion and thyrohyoid approximation of any of the reliability analyses of ultrasound and videofluoroscopic data. Table 4 reports findings of online acquisition interrater reliability. Reliability was moderate for hyoid excursion and thyrohyoid approximation and good for the cross‐sectional area of the left anterior belly of the digastric muscle. Results of intra‐ and interrater offline measurement reliability are depicted in Tables 5 and 6, respectively. Intra‐rater reliability was good for all measures except for tongue thickness. There was evidence for good interrater reliability of hyoid excursion, thyrohyoid approximation and tongue thickness measurement. Data for online–offline reliability are reported in Table 7. Comparison of on‐ and offline ultrasound reliability revealed moderate reliability for hyoid excursion and tongue thickness. Reliability for floor of mouth muscles was good.
TABLE 4.
Online acquisition interrater reliability
| Measure | Bolus | Interrater ICC (95% CI) | SEM (95% CI) | Between‐subject SD |
|---|---|---|---|---|
| Hyoid excursion | Liquid, puree | 0.55 (0.09, 0.80) | 6.84 % (5.28, 9.35) | 7.60 % |
| Thyrohyoid approximation | Liquid, puree | 0.56 (0.12, 0.82) | 14.55 % (11.19, 20.12) | 19.02 % |
| Tongue thickness | – | n.a. | n.a. | n.a. |
| GH+ | – | [0.60 (0, 0.90) | 43.92 mm2 (28.30, 82.30) | 56.98 mm2] |
| LAB | – | 0.78 (0.25, 0.94) | 10.63 mm2 (6.98, 10.09) | 19.82 mm2 |
| RAB | – | [0.42 (0, 0.85) | 14.17 mm2 (9.19, 24.54) | 12.16 mm2] |
Note: ICC, intraclass correlation coefficient; CI, confidence interval; GH+, geniohyoid+ muscles; LAB, left anterior belly of the digastric muscles; RAB, right anterior belly of the digastric muscles; n.a., not applicable as the model is overfitted for this measure; and [ ], assumptions for analysis may not be met.
TABLE 5.
Offline measurement intra‐rater reliability
| Measure | Rater | Bolus | Intra‐rater ICC (95% CI) | SEM (95% CI) | Between‐subject SD |
|---|---|---|---|---|---|
| Hyoid excursion | 1 | Liquid, puree | 0.83 (0.52, 0.94) | 3.82 % change (2.89, 5.11) | 8.51 % change |
| 2 | 0.83 (0.46, 0.94) | 3.82 % change (2.89, 5.12) | 8.50 % change | ||
| Thyrohyoid approximation | 1 | Liquid, puree | [0.75 (0.30, 0.91) | 9.01 % change (6.81, 12.06) | 15.76 % change] |
| 2 | 0.82 (0.48, 0.93) | 8.46 % change (6.40, 11.32) | 18.21 % change | ||
| Tongue thickness | 1 | – | 0.98 (0.91, 1.00) | 0.66 mm (0.41, 1.11) | 4.34 mm |
| 2 | 0.47 (0, 0.81) | 3.46 mm (2.46,4.96) | 3.25 mm | ||
| GH+ | 1 | – | 0.98 (0.93, 1.00) | 5.35 mm2 (3.28, 8.98) | 41.26 mm2 |
| 2 | 0.98 (0.92, 1.0) | 5.35 mm2 (3.28, 8.98) | 41.26 mm2 | ||
| LAB | 1 | – | [0.99 (0.97, 1.00) | 1.84 mm2 (1.13, 3.08) | 21.71 mm2] |
| 2 | 0.97 (0.98, 0.99) | 2.85 mm2 (1.75, 4.79) | 16.80 mm2 | ||
| RAB | 1 | – | [0.91 (0.93, 1.00) | 6.24 mm2 (3.83, 10.47) | 19.70 mm2] |
| 2 | 0.99 (0.96, 1.00) | 1.59 mm2 (0.98, 2.67) | 16.84 mm2 |
Note: ICC, intraclass correlation coefficient; CI, confidence interval; SD, standard deviation; GH+, geniohyoid+ muscles; LAB, left anterior belly of the digastric muscles; RAB, right anterior belly of the digastric muscles; and [ ], assumptions for analysis may not be met.
TABLE 6.
Offline measurement interrater reliability
| Measure | Bolus | Interrater ICC (95% CI) | SEM (95% CI) | Between‐subject SD |
|---|---|---|---|---|
| Hyoid excursion | Liquid, puree | 0.83 (0.49, 0.94) | 3.75 % change (2.90, 5.13) | 8.28 % change |
| Thyrohyoid approximation | Liquid, puree | 0.78 (0.35, 0.91) | 8.23 % change (6.33, 11.36) | 16.41 % change |
| Tongue thickness | – | 0.85 (0.44, 0.97) | 1.70 mm (1.10, 3.06) | 4.01 mm |
| GH+ | – | [0.99 (0.94, 1.00) | 4.96 mm2 (3.26, 8.91) | 42.15 mm2] |
| LAB | – | [0.84 (0.44, 0.96) | 8.23 mm2 (5.39, 14.77) | 19.09 mm2] |
| RAB | – | [0.95 (0.77, 0.99) | 3.75 mm2 (2.44, 6.73) | 16.99 mm2] |
Note: ICC, intraclass correlation coefficient; CI, confidence interval; SD, standard deviation; GH+, geniohyoid muscles+; LAB, left anterior belly of the digastric muscles; RAB, right anterior belly of the digastric muscles; and [ ] assumptions for analysis may not be met.
TABLE 7.
Online–offline intra‐rater reliability
| Measure | Bolus | Intra‐rater ICC (95% CI) | SEM (95% CI) | Between‐subject SD |
|---|---|---|---|---|
| Hyoid excursion | Liquid, puree | 0.67 (0.27, 0.87) | 5.65 % change (4.27, 7.56) | 8.06 % change |
| Thyrohyoid approximation | Liquid, puree | [0.63 (0.19, 0.83) | 11.85 % change (9.15, 16.19) | 15.43 % change] |
| Tongue thickness | – | 0.64 (0.00, 0.93) | 3.29 mm (2.02, 5.53) | 4.37 mm |
| GH+ | – | [0.97 (0.89, 1.00) | 6.86 mm2 (4.21, 11.52) | 42.45 mm2] |
| LAB | – | 0.95 (0.81, 0.99) | 4.53 mm2 (2.78, 7.60) | 20.23 mm2 |
| RAB | – | 0.99 (0.95, 1.00)) | 1.86 mm2 (1.14, 3.13) | 17.91 mm2 |
Note: ICC, intraclass correlation coefficient; CI, confidence interval; SD, standard deviation; GH+, geniohyoid+ muscles; LAB, left anterior belly of the digastric muscles; RAB, right anterior belly of the digastric muscles; and [ ], assumptions for analysis may not be met.
DISCUSSION
Validity and reliability testing of pocket‐sized ultrasound technology in the assessment of swallowing was completed in a cohort of patients with dysphagia. Data from this study suggest that ultrasound measures of hyoid excursion and thyrohyoid approximation using the Clarius device poorly depict identical videofluoroscopic measures. While this finding mirrors validity data of pocket‐sized ultrasound in the assessment of healthy swallowing despite the use of slightly different measurement methods for thyrohyoid approximation (Winiker et al., 2021a), it does not align with published data of larger ultrasound equipment (Hsiao et al., 2012; Huang et al., 2009). Discrepancies may be explained by differences in image quality due to differing ultrasound technology. Insufficient reliability of ultrasound data acquisition, as documented in this study, may further account for the validity findings.
Reliability was assessed for different aspects and settings of data acquisition as they will relate to application in clinical practice. Reliability of offline measurement was promising. Good intra‐ and interrater reliability of offline measurement corresponds to published measurement reliability data of laptop‐driven ultrasound instrumentation in the assessment of hyoid excursion (Chen et al., 2017). Yet it is not in agreement with the reported insufficient reliability of pocket‐sized ultrasound technology in healthy swallowing (Winiker et al., 2021b). Interrater reliability of immediate online measurement on the iPad was insufficient for most measures. This finding aligns with reported data of online acquisition reliability in healthy subjects using the Clarius technology (Winiker et al., 2021b). Reliability of online measurement may have been negatively affected by several factors including scanning and image selection from the recording. The scanning technique and selection of images for measurement may have varied across clinicians, despite the use of a written reference document. The findings suggest the need for a strong focus on scanning techniques and image selection in rater training. Further, online reliability may have been impacted by time pressure and suboptimal lighting paired with the small size of the iPad user interface. The impact of the measurement setting on reliability is further highlighted by the data of online–offline reliability showing reduced intra‐rater reliability compared with offline intra‐rater reliability. Good offline measurement reliability gives some indication that poor online reliability may not be primarily explained by reduced image quality of pocket‐sized technology as compared with larger ultrasound systems.
Limitations of this study are acknowledged. Patients were included based on perceptual assessment of reduced hyolaryngeal excursion, posing a risk of inclusion bias. Some technical problems, such as failed data storage using the Clarius system, were encountered and may have negatively impacted data collection. The clinician wore lead gloves for radiation protection. This may have impeded optimal transducer placement during concurrent ultrasound and videofluoroscopic swallowing assessment.
Although there is an assumption that insufficient reliability is related to the pocket‐sized ultrasound technology, it is acknowledged that the participants in this study may have been inadequately trained and data potentially suggest the need for more elaborated and criterion‐based training if ultrasound is to transition to clinical practice. In the current published literature documenting reliability of ultrasound in swallowing assessment, information regarding rater experience and/or training is lacking (Chen et al., 2017; Huang et al., 2009; Macrae et al., 2012; Tamura et al., 2012) or insufficient to be replicable (Hsiao et al., 2012; Shimizu et al., 2016; Winiker et al., 2021b). Future research is indicated to establish primary requirements for standardized training recommendations in use of ultrasound swallowing evaluation.
In conclusion, while the potential of small and portable instrumentation seems promising, it loses functionality if it has to be measured offline on a computer. Prior to clinical translation of the emerging pocket‐sized ultrasound technology, increased validity and online acquisition reliability in ultrasound swallowing assessment is required. Further exploration of intra‐, interrater and test–retest reliability of the entire process of ultrasound data acquisition rather than of measurement only is needed, as clinical patient care will involve acquisition of swallowing measures by different clinicians at different occasions. Future studies focussing on the reliability of data acquisition in a clinical environment rather than in research laboratories are critical to mirror the setting where clinicians will predominantly use this instrumentation. Comparison of validity and reliability across different ultrasound systems including different pocket‐sized systems but also larger, lap‐top driven ultrasound technology in the assessment of swallowing will increase our understanding of the impact that technology may have on validity and reliability.
CONFLICT OF INTEREST
The authors declare no conflict of interest.
ETHICS STATEMENT
Ethical approval for this study was obtained by the appropriate ethics committee.
ACKNOWLEDGEMENTS
The authors thank Tamzin Brott (Chief Allied Health, Scientific and Technical Professions Officer, Waitematā District Health Board) and Lifeng Zhou (former epidemiologist, Planning, Funding & Outcomes Unit, Waitematā District Health Board) for their support.
Open access publishing facilitated by University of Canterbury, as part of the Wiley‐University of Canterbury agreement via the Council of Australian University Librarians.
Winiker, K. , Hammond, R. , Thomas, P. , Dimmock, A. , Huckabee, M.‐L. Swallowing assessment in patients with dysphagia: Validity and reliability of a pocket‐sized ultrasound system. International Journal of Language & Communication Disorders. 2022;57:539–551. 10.1111/1460-6984.12703
DATA AVAILABILITY STATEMENT
The data that support the findings of this study are available on request from the corresponding author. The data are not publicly available due to privacy or ethical restrictions.
REFERENCES
- Allen, M. (2017) Correlation, Pearson. The SAGE encyclopedia of communication research methods. Thousand Oaks, CA: SAGE Publications. [Google Scholar]
- Bartlett, J.W. & Frost, C. (2008) Reliability, repeatability and reproducibility: analysis of measurement errors in continuous variables. Ultrasound in Obstetrics and Gynecology, 31, 466–475. [DOI] [PubMed] [Google Scholar]
- Bates, D. , Mächler, M. , Bolker, B. & Walker, S. (2015) Fitting linear mixed‐effects models using {lme4}. Journal of Statistical Software, 67, 1–48. [Google Scholar]
- Chen, Y.‐C. , Hsiao, M.‐Y. , Wang, Y.‐C. , Fu, C.‐P. & Wang, T.‐G. (2017) Reliability of ultrasonography in evaluating hyoid bone movement. Journal of Medical Ultrasound, 25, 90–95. [DOI] [PMC free article] [PubMed] [Google Scholar]
- Daniels, S.K. & Huckabee, M.L. (2014) Dysphagia following stroke, San Diego: Plural Publishing. [Google Scholar]
- Feng, X. , Todd, T. , Lintzenich, C.R. , Ding, J. , Carr, J.J. , Ge, Y. , et al. (2012) Aging‐related geniohyoid muscle atrophy is related to aspiration status in healthy older adults. Journals of Gerontology Series A: Biomedical Sciences and Medical Sciences, 68, 853–860. [DOI] [PMC free article] [PubMed] [Google Scholar]
- Hsiao, M.‐Y. , Chang, Y.‐C. , Chen, W.‐S. , Chang, H.‐Y. & Wang, T.‐G. (2012) Application of ultrasonography in assessing oropharyngeal dysphagia in stroke patients. Ultrasound in Medicine & Biology, 38, 1522–1528. [DOI] [PubMed] [Google Scholar]
- Huang, Y.‐L. , Hsieh, S.‐F. , Chang, Y.‐C. , Chen, H.‐C. & Wang, T.‐G. (2009) Ultrasonographic evaluation of hyoid–larynx approximation in dysphagic stroke patients. Ultrasound in Medicine and Biology, 35, 1103–1108. [DOI] [PubMed] [Google Scholar]
- Jacob, P. , Kahrilas, P.J. , Logemann, J.A. , Shah, V. & Ha, T. (1989) Upper esophageal sphincter opening and modulation during swallowing. Gastroenterology, 97, 1469–1478. [DOI] [PubMed] [Google Scholar]
- Leonard, R. , Kendall, K.A. , Mckenzie, S. , Gonçalves, M.I. & Walker, A. (2000) Structural displacements in normal swallowing: a videofluoroscopic study. Dysphagia, 15, 146–152. [DOI] [PubMed] [Google Scholar]
- Macrae, P.R. , Doeltgen, S.H. , Jones, R.D. & Huckabee, M.‐L. (2012) Intra‐ and inter‐rater reliability for analysis of hyoid displacement measured with sonography. Journal of clinical ultrasound, 40, 74–78. [DOI] [PubMed] [Google Scholar]
- Perry, S.E. , Winkelman, C.J. & Huckabee, M.‐L. (2016) Variability in ultrasound measurement of hyoid bone displacement and submental muscle size using 2 methods of data acquisition. Folia Phoniatrica et Logopaedica, 68(5), 205–210. [DOI] [PubMed] [Google Scholar]
- Portney, L.G. & Watkins, M.P. (2009) Foundations of clinical research. Applications to practice. London, Sydney, Singapore, Hong Kong, Toronto, S.A. de C.V., Tokyo, Malaysia, New Jersey: Pearson Education. [Google Scholar]
- R Core Team (2017) R: A language and environment for statistical computing. Available at: https://www.r‐project.org/
- Rugiu, M.G. (2007) Role of videofluoroscopy in evaluation of neurologic dysphagia. Acta Otorhinolaryngologica Italica, 27, 306–316. [PMC free article] [PubMed] [Google Scholar]
- Schneider, C.A. , Rasband, W.S. & Eliceiri, K.W. (2012) NIH Image to ImageJ: 25 years of image analysis. Nature Methods, 9, 671–675. [DOI] [PMC free article] [PubMed] [Google Scholar]
- Shimizu, S. , Hanayama, K. , Metani, H. , Sugiyama, T. , Abe, H. , Seki, S. , et al. (2016) Retest reliability of ultrasonic geniohyoid muscle measurement. Japanese Journal of Comprehensive Rehabilitation Science, 7, 55–60. [Google Scholar]
- Tamura, F. , Kikutani, T. , Tohara, T. , Yoshida, M. & Yaegaki, K. (2012) Tongue thickness relates to nutritional status in the elderly. Dysphagia, 27, 556–561. [DOI] [PMC free article] [PubMed] [Google Scholar]
- Thompson, T.Z. , Obeidin, F. , Davidoff, A.A. , Hightower, C.L. , Johnson, C.Z. , Rice, S.L. , et al. (2014) Coordinate mapping of hyolaryngeal mechanics in swallowing. Journal of Visualized Experiments(87), 1–11. [DOI] [PMC free article] [PubMed] [Google Scholar]
- Winiker, K. , Burnip, E. , Gozdzikowska, K. , Guiu Hernandez, E. , Hammond, R. , Macrae, P. , et al. (2021a) Ultrasound: validity of a pocket‐sized system in the assessment of swallowing. Dysphagia, 36(6), 1010–1018. [DOI] [PMC free article] [PubMed] [Google Scholar]
- Winiker, K. , Burnip, E. , Gozdzikowska, K. , Guiu Hernandez, E. , Hammond, R. , Macrae, P. , et al. (2021b) Ultrasound: reliability of a pocket‐sized system in the assessment of swallowing. Journal of Speech, Language and Hearing Research, 64(8), 2928–2940. [DOI] [PubMed] [Google Scholar]
Associated Data
This section collects any data citations, data availability statements, or supplementary materials included in this article.
Data Availability Statement
The data that support the findings of this study are available on request from the corresponding author. The data are not publicly available due to privacy or ethical restrictions.