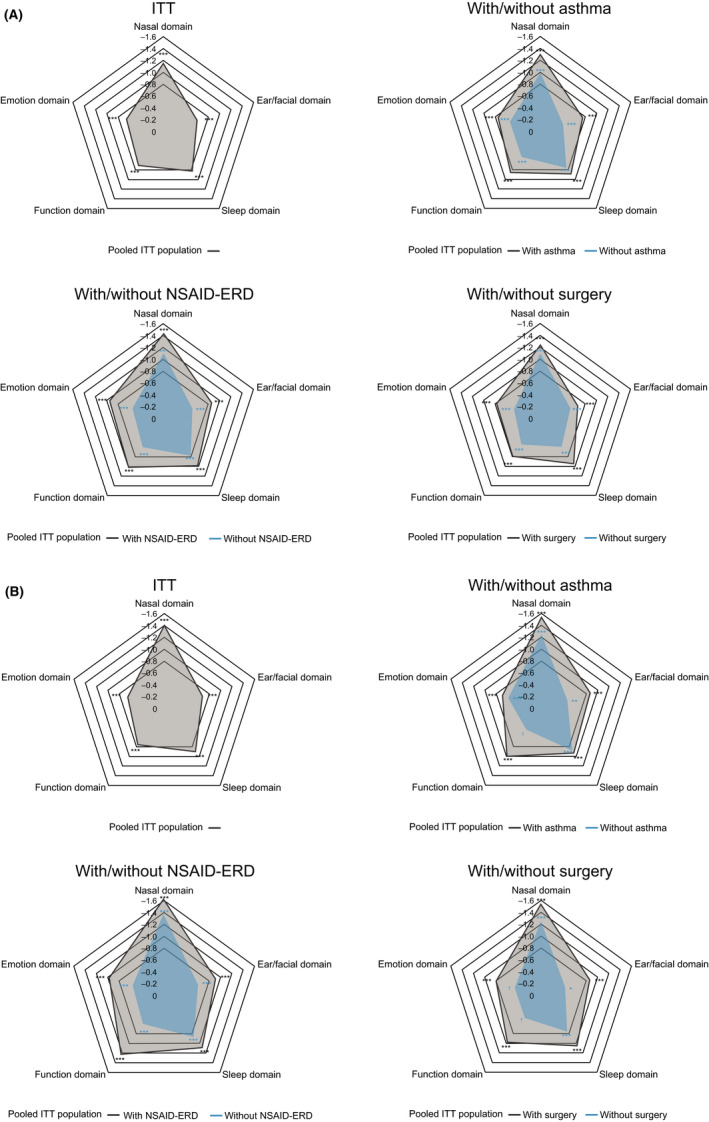
FIGURE 2.

Spider plot of LS mean difference between dupilumab and placebo in change from baseline in SNOT‐22 domain scores at (A) Week 24, and (B) Week 52 (ITT and subgroups). LS mean difference vs placebo in domain scores (range, 0–5) are plotted. Each of the imputed complete data were analyzed by fitting an ANCOVA model with change from baseline at the corresponding visit as the response variable, and the corresponding baseline value, treatment group, asthma/NSAID‐ERD status, prior surgery history, regions, and, for the pooled analyses, study indicator as covariates. Data collected after treatment discontinuation were included. Data post‐SCS or NP surgery were set to missing and imputed by WOCF; other missing data were imputed by multiple imputation methods. *p < .01, **p < .001, ***p < .0001; †p < .05. ANCOVA, analysis of covariance; ITT, intention to treat; LS, least squares; NP, nasal polyp; NSAID‐ERD, non‐steroidal anti‐inflammatory drug‐exacerbated respiratory disease; SCS, systemic corticosteroids; SNOT‐22, 22‐item sino‐nasal outcome test; WOCF, worst observation carried forward
