

Abstract
Disturbances of the early stages of neurogenesis lead to irreversible changes in the structure of the mature brain and its functional impairment, including increased excitability, which may be the basis for drug‐resistant epilepsy. The range of possible clinical symptoms is as wide as the different stages of disturbed neurogenesis may be. In this study, we used a quadruple model of brain dysplasia by comparing structural and functional disorders in animals whose neurogenesis was disturbed with a single dose of 1 Gy of gamma rays at one of the four stages of neurogenesis, that is, on days 13, 15, 17, or 19 of prenatal development.
When reached adulthood, the prenatally irradiated rats received EEG teletransmitter implantation. Thereafter, pilocarpine was administered and significant differences in susceptibility to seizure behavioral symptoms were detected depending on the degree of brain dysplasia. Before, during, and after the seizures significant correlations were found between the density of parvalbumin‐immunopositive neurons located in the cerebral cortex and the intensity of behavioral seizure symptoms or increases in the power of particular EEG bands. Neurons expressing calretinin or NPY showed also dysplasia‐related increases without, however, correlations with parameters of seizure intensity. The results point to significant roles of parvalbumin‐expressing interneurons, and also to expression of NPY—an endogenous anticonvulsant and neuroprotectant reducing susceptibility to seizures and supporting neuronal survival.
Keywords: calcium‐binding proteins, calretinin, dysplastic brain, disorders of neurogenesis, epilepsy, gamma irradiation, NPY, parvalbumin

1. INTRODUCTION
The organization of neocortical layers and their functional features depend on the precisely scheduled production of nerve cells and their migration to appropriate areas within the cerebral hemisphere wall (Bayer et al., 1993). An interruption of these processes leads to a condition called dysplasia, where the cerebral cortex shows a deficiency of nerve cells, which, having not reached their destination sites in appropriate cortical layers, form incorrectly located aggregates (subcortical or periventricular heterotopia) and aberrant connections underlying functional instability (Barkovich et al., 2015; Blümcke et al., 2011). Experimental studies of these phenomena focus on generalized disorders in the course of prenatal neurogenesis caused by various factors in animals (Luhmann, 2015) and show deficits of inhibitory interneurons in the dysplastic cerebral cortex and increases in spontaneous seizure activity and/or susceptibility to seizure‐genic stimuli (second hit) (Baraban et al., 2000; Battaglia et al., 2013; Chen & Roper, 2003; Colciaghi et al., 2011; Deukmedjian et al., 2004; Kellinghaus et al., 2004; Kondo et al., 2001; Rudy et al., 2011; Zhou & Roper, 2010a).
This seizure susceptibility may trigger epileptogenesis leading to further quantitative reduction of inhibitory interneurons and further increases in excitability. In our previous studies (Setkowicz et al., 2014, 2005, 2003, 2020), we showed that rats with different degrees of brain dysplasia had also different susceptibility seizure behavior. However, this relation could undergo further modifications depending on the type of seizure‐genic agent (Setkowicz et al., 2014, 2005). It appeared obvious that under normal conditions, such diverse properties must be accompanied by different EEG spectra (Kielbinski et al., 2018) also undergoing characteristic transformations during and after status epilepticus (Setkowicz et al., 2020). Moreover, the power of resting EEG spectra and of their particular bands were correlated with changes in the general brain morphology, that is, with volumes of particular brain regions (Setkowicz et al., 2020). The newly detected relations point to possible local or systemic changes in the neuronal structure, which in this experimental context have not been thoroughly studied yet. In this study, we show changes in the distribution of selected subpopulations of inhibitory interneurons within the cerebral cortex before and after pilocarpine‐induced seizures. Also, we determine their relationships with different degrees of dysplasia and correlate their numbers with the intensity of seizure behavior and bioelectrical activity of the brain.
The optimal model for the relationships in the dysplastic brain should reflect the range of their clinical variability. However, the current studies focus on consequences of neurogenesis interruption at only one selected developmental stage showing only a limited sample of possible relationships while some important determinants remain outside the scope of observation. A detected difference between the structure of dysplastic and normal brains cannot automatically be considered as the cause of observed functional changes. Greater attention appears necessary to exploration of “dose‐dependent” relationships by analyzing the correlation between degrees of structural disorders and the intensity of functional pathology. In this work, three wide spectra of quantitative changes of parvalbumin‐, calretinin‐, and NPY‐containing interneurons and of functional disorders presented by four degrees of dysplastic changes were simultaneously matched with seizure reactivity defined as changes in behavioral symptoms and in EEG spectra. However, these signs of dysplasia, commonly called “cortical dysplasia,” and their functional correlates cannot be regarded as isolated from coexisting diffuse extracortical changes since they are systemically connected and functionally affect the whole brain.
2. MATERIALS AND METHODS
2.1. Animals
Female Wistar rats were irradiated on gestational days 13, 15, 17, or 19 (E13, E15, E17, and E19, respectively) as described previously (Setkowicz et al., 2014, 2003, 2020). Briefly, each of the females was exposed to a dose of 1 Gy gamma rays from a 60Co source (Institute of Nuclear Research, Polish Academy of Sciences, Krakow). Untreated (N, naıve) females provided experimental controls. These females and their offsprings were maintained under conditions of controlled temperature (20 ± 2°C) and a 12/12 h light/dark cycle. Standard laboratory feed (Labofeed) and water were available ad libitum.
Males offspring of the irradiated and nonirradiated control females were subjected to further experimental procedures. Their numbers in the examined groups depended on litter sizes, sperm‐positive females giving birth and the ability to obtain good quality EEG data. Figure 1 shows a general scheme of the experiment. The animal numbers used in this study are given in section 2.7.
FIGURE 1.

A general scheme of the present study: (1) Pregnant females were exposed to gamma radiation (1 Gy dose) on prenatal days 13, 15, 17, or 19 (E13–E19, respectively); (2) EEG teletransmitters were implanted in 55‐day‐old male offspring (P55) of the irradiated females. (3) After a 2‐week recovery period, EEG recordings were performed 2 days before (P70–71) and 3 days after (P72–74) pilocarpine‐induced seizures, and three 6 h‐lasting samples from the periods before, during, and after seizure induction were taken for analysis. (4) After the EEG recordings, perfusion‐fixation of the rats was performed
All experimental procedures were compliant with the European Communities Council Directive (2010/63/EU) and were approved by the Animal Care and Use Committee of the Jagiellonian University (decision no. 122/2011).
2.2. Remote EEG recordings
At the age of 55 days, the male rats were implanted with EEG teletransmitters under anesthesia with 2 to 4% inhaled isoflurane (Aerrane, Baxter) in oxygen. An incision was made in the skin on the side and a portable rodent telemetry transmitter (TA11CTA‐F40 Implant, Data Sciences International) was inserted under the skin. Two biopotential leads (positive and reference) were guided toward the animal's head subcutaneously. A hole for the recording lead was drilled 1.0 mm posterior to the Bregma and 3.0 mm left to the midline, over the primary somatosensory cortex for fore‐ and hindlimbs (Paxinos & Watson, 1998). For the reference lead, a hole was located 10.5 mm posterior to the Bregma and on the midline, over the cerebellum. The leads were placed on the exposed dura, held in place with dental cement (Duracryl Plus, Spofa Dental), and the skin above the cement cap was sutured. The surgeries were carried out in aseptic conditions, and animals were given proper postoperative care. Antibiotics (Sul‐Tridin, Norbrook Laboratories Ltd.) and nonsteroid anti‐inflammatory drugs (Tolfedine, Vetaquinol SA) were administered. After surgery, rats were placed in single cages and given 2 weeks of recovery before further experimental procedures.
At 2 weeks after surgery (postnatal day 70), electroencephalographic data were recorded continuously at 500 Hz sampling rate from all animals using DSI receiver plates and DSI acquisition software. For all animals, continuous data starting around 9 a.m. were acquired for 2 days before seizure induction. On the postnatal day 72, seizures were induced with pilocarpine, as described below, and EEG recordings were continued for 3 days. For further analysis, the following three 6 h‐lasting samples were taken: (i) 2 days before seizure induction, (ii) from the time of pilocarpine injection and (iii) from the third day after seizure induction. Each sample included the period from around 9 a.m. till 3 p.m.
Raw EEG data were transferred into the Spike2 program, which was subsequently used for further analysis. Based on initial inspection of the waveforms, an amplitude window was selected and all activity crossing the threshold was marked in a separate event channel. This was followed by a second round of visual inspection, during which any additional artifacts missed by the initial procedure were marked. Our initial observations suggest that the main sources of artifacts were: animal motion (such as chewing, scratching) and momentary loss of wireless signal, resulting in sharp, very high‐power spikes with extreme amplitude. All signals in 10‐s time windows from any marked artifact were excluded from further analysis. We also identified animals in which, likely due to mechanical damage to the insulation of the biopotential leads, or to contamination of the signal with electrocardiographic noise, this approach was unsuccessful. These recordings were excluded completely. The resulting signal was processed with fast Fourier transform with a Hanning window of width = 256, corresponding to 128 bins of width = 1.953 Hz, and epochs of 0.5 s. Frequencies from approximately 2 to 65 Hz were used for further analysis. Principal component analysis (PCA) was performed in the frequency domains with relative spectral densities over the entire sampling period (32 total input variables, each corresponding to a single bin obtained from fast Fourier transform). The rationale was that adjacent frequencies that vary together form EEG bands. The first two components obtained from PCA contained 89.2% of the cumulative variance: 72% for the first and 17.2% for the second component, respectively. Component loadings were then examined: concurrent variables (corresponding to adjacent EEG bins) with similar loadings for the first two components were grouped together. Similarity was defined as loadings having the same sign (positive or negative, with values above 0.1) or near‐zero (value < 0.1). As a result, we have constructed empirical bands which corresponded to the following physiological bands: “delta” (approximately 2−4 Hz), “theta” (approximately 6−8 Hz), “alpha” (approximately 10−16 Hz), “beta” (approximately 18–32 Hz), and “gamma” (approximately 34−65 Hz). Our choice of this method for our research is explained in Section 4. We then normalized the signal in each band to the sum of all bands. This relative power metric (RP) was taken as a measure of the contribution of the specific band to the overall activity. Examples of EEG recordings and power spectra referring to 6‐h periods before and after pilocarpine injection are presented in Figure 2.
FIGURE 2.

Examples of EEG recordings and power spectra referring to 6‐h periods before (PRE‐SE stage) black bars and upper tracings) and after seizure induction (SE stage, grey bars and lower tracings). N normal, nonirradiated rats; E13, E15, E17, E19 rats irradiated on prenatal days 13, 15, 17, or 19, respectively. The recordings for E13s reflect significantly lower increases the power of EEG signal following seizure induction
2.3. Seizure induction
About 70‐day‐old rats which experienced irradiation and untreated controls received single i.p. injections of pilocarpine (250 mg/kg, Sigma P6503). Scopolamine methyl bromide (1 mg/kg, Sigma S8502) was injected i.p. 30 min prior to pilocarpine to reduce its peripheral effects. Pilocarpine was injected between 9 and 10 a.m. to avoid circadian effects of seizure vulnerability. To reduce a relatively high mortality (Curia et al., 2008) of the animals implanted with EEG transmitters, the pilocarpine dosage used here was lower than that in our previous studies (300 mg/kg, Setkowicz et al., 2003; Setkowicz et al., 2005, 2006) or, for example, in studies by Covolan and Mello (2000; 350 mg/kg) or Turski et al. (1983; 400 mg/kg). Thus, all the animals survived the procedure in good condition.
2.4. Assessment of behavioral seizure symptoms
In the present study, we focused on the acute period of status epilepticus lasting no longer than 6 h. During the 6 h period following the pilocarpine injection, the animals were continuously observed without knowledge of their previous experimental treatment. The pilocarpine‐induced changes in the animal behavior were rated on a previously used six‐point scale with respect to characteristic symptoms and their intensity (Setkowicz et al., 2005, 2003, 2020):
Light symptoms: 0.5—immobility, piloerection, salivation, narrowing of eyes, face and vibrissae twitching, ear rubbing with forepaws; 1.0—head nodding and chewing movements.
Intermediate symptoms: 1.5—clonic movements of forelimbs, and mild whole body convulsions, exophthalmia, aggressive behavior; 2.0—rearing and running with stronger tonic–clonic motions including hindlimbs, tail hypertension, lockjaw;
Heavy symptoms: 2.5—rearing and falling, eye congestion; 3.0—loss of postural tone with general body rigidity.
The maximal intensity of seizures was rated in each of the successive 10‐min periods within the whole 6 h of the observation time. The recorded scores were summarized separately for each animal and indicated with a symbol 6 h SUM SE further in the text.
2.5. Animal sacrifice and tissue processing
Three days after the induction of seizures, the rats were sacrificed by a lethal dose of pentobarbital (Morbital, Biowet) and perfused transcardially with 0.9% NaCl followed by 10% formalin (Chempur) in 0.1 M phosphate buffer, pH 7.4. Brains were removed, postfixed for several days, and sectioned into 30‐μm‐thick coronal slices on a vibratome (Leica). In free‐floating sections, nerve cells were immunostained using anti‐Parvalbumin IgG (Millipore, MAB1572; 1:1000), anti‐Calretinin IgG (Sigma, C7479; 1:1000), or anti‐NPY (Sigma, N9528; 1: 5000) combined with Vectastain Elite ABC kit PK 6200 (1 : 50) and diaminobenzidine (DAB; Sigma, D8001) being used as chromogen. The sections were mounted, dehydrated, and coverslipped with DPX (Sigma, 100579). To check specificity of the antibodies, some sections were processed omitting the primary antibody. No unspecific staining was detected.
2.6. Cell counting
Microscopic examinations of immunostained brain sections were performed using a square 10 × 10 mm frame‐containing eyepiece. Under a ×400 magnification, the frame delimited a 250 × 250 μm unit area of the observed tissue. Neuronal cell bodies immunopositive for parvalbumin (N‐PV+), calretinin (N‐CR+), and neuropeptide Y (N‐NPY+) were counted bilaterally (Bregma −0.3, according to Paxinos & Watson, 1998) within stripes of tissue representing the dorsal wall of the cerebral hemisphere as shown in Figures 3 and 4. The width of the stripe was 500 μm, which was equal to twice width of the frame used during the inside‐out and out‐inside bidirectional counting. The whole thickness of each cerebral hemisphere wall was divided into eight equal depth zones and numbers of immunopositive neurons per the 250 × 250 μm unit area (i.e., their densities) were assigned to respective zones according to their locations. After the cell counting, general profiles of distribution of immunopositive cells within the cerebral hemisphere wall were plotted. Figure 3a explains spatial relations between the scale of 8 depth zones and the layered hemisphere wall in the normal brain. Figure 4 shows the relations within different patterns of internal structure resulting from irradiations on E13 or E15 which could not directly be matched with the normal pattern. Following irradiations on E17 or E19, normal relations between cortical layers were basically preserved but all intergroup comparisons were based on the eight zones as a standard. Further reasons for application of this reference are presented in Section 4.
FIGURE 3.

(a) Cresyl violet staining shows cortical layers (roman numerals) and underlying white matter (WM) in the normal cerebral hemisphere wall in relation to eight depth zones (a vertical white bar with Arabic numerals). The region delimited for counting of immunopositive neurons was a vertical rectangle of 500 μm width located between the lumen of the lateral ventricle and the surface of cerebral hemisphere at the level of the anterior commissure. Within the region, neurons immunopositive for (b) parvalbumin (PV), (c) calretinin (CR), or (d) neuropeptide Y (NPY) were counted. As indicated with white rectangles, for each of the counting regions, example areas with neurons immunopositive for PV (b1), CR (c1, c2), and NPY (d1, d2) are shown at higher magnification. Each bar shows 100 μm length
FIGURE 4.

The scale of eight depth zones (a vertical white bar with Arabic numerals) in relation to the examined region of the cerebral hemisphere wall showing examples of different dysplastic patterns. The region delimited for counting of immunopositive neurons in the cerebral hemisphere wall was a vertical rectangle of 500 μm width located between the lumen of the lateral ventricle and the surface of cerebral hemisphere at the level of the anterior commissure. (a) Cresyl violet staining, irradiation on E15. Examples of the examined regions from dysplastic brains irradiated on E15 where neurons immunopositive for (b) parvalbumin (PV), (c) calretinin (CR), or (d) neuropeptide Y (NPY) were counted. As indicated with white rectangles, for each of the counting regions, example areas from heterotopia with neurons immunopositive for PV (b1), CR (c1‐2), or NPY (d1‐2) are shown at higher magnification. Each bar shows 100 μm length
This nonstereologic cell counting was applied here to compare densities (but not total numbers or absolute densities) of immunoreactive neurons in the defined neocortical area of immunostained vibratome sections. It has already been described that such two‐dimensional cell counting overestimates object density (West & Gundersen, 1990). However, neurons in the dysplastic cortex show no volumetric abnormalities so the possible counting errors apply equally to all compared groups and obtained results should be valid for such comparative purposes. Using this method performed by observers blind to the previous animal treatment, relative changes in the distribution of immunopositive cells within the cerebral hemisphere walls were revealed.
2.7. Statistical analysis
In total, 43 rats were used for EEG recordings, assessment of seizure behavioral symptoms, and histological analyses, that is, n = 9 in E13s; n = 6 in E15s; n = 8 in E17s; n = 8 in E19s and n = 12 in nonirradiated controls.
Normality of data and homogeneity of variance were checked with the Shapiro‐Wilk and Levene's tests, respectively. Numbers of immunopositive neurons were compared between groups using nonparametric Kruskall–Wallis and Mann–Whitney tests, because of non‐normal data distribution. The level of statistical significance was set at .05. All box plots in the figures illustrate the full span of all data points (whiskers), 25 to 75% quartiles (boxes) and median (small squares). Relationships between parameters of behavioral seizure symptoms and increases in the absolute or RP of particular EEG bands were assessed by calculation of Spearman's correlation coefficients. Most statistical analyses were performed with Statistica 10 (Statsoft), with the exception of exploratory PCA used for informing the choice of EEG bands, which were performed in R. The sample size of rats necessary to detect a difference of 15% with a power of 80% and alpha 0.05 (Machin et al., 2009) was estimated using variance values obtained in previous analyses (Setkowicz et al., 2014, 2020).
3. RESULTS
Brains irradiated at E13 showed the highest degree of dysplasia. The later was the developmental stage at which the irradiation was performed, the less severe was the brain reduction and after irradiation on E19 the brains were similar to normal. Of particular interest were periventricular nodular heterotopia, the largest in E13s, smaller in E15s and very small in E17s. We have shown these regular trends previously (Setkowicz et al., 2003, 2014), and recently in volumetric studies (Setkowicz et al., 2020).
The lower dose of pilocarpine (250 mg/kg) used for seizure induction led to modification of the previously described profile of susceptibility to seizures in rats irradiated at different stages of prenatal development. It was minimal in E13s, even in comparison with nonirradiated controls (Setkowicz et al., 2020). Brains irradiated in the particular developmental stages, when became adult, displayed different changes in EEG spectra. Consequently, following seizure induction, different reactive changes in those spectra were observed, depending on the degree of brain dysplasia and were presented previously (Kielbinski et al., 2018; Setkowicz et al., 2020).
3.1. Effects of irradiation alone (dysplastic vs. normal brains)
As a generalized effect of prenatal irradiation, the average density of N‐PV+ within the whole studied area was increased only in E15s (p < .03, Figure 5a), while in the other groups it remained close to the control level. Even though the overall density of N‐PV+ did not show a significant change, some decreases were detected at different depths zones (D1–8) within the brain hemisphere wall (Figure 6a–d). The density of N‐PV+ was decreased within D3–D5 in E13s (p < .02; .0009; and .02, respectively), D4–D5 in E15s (p < .02 and .03, respectively), D2–D6 in E17s (p < .03;.005;.0007;.001;.0005, respectively), and D3, p < .02); and D5–D7 (p < .03;.01;.009, respectively) in E19s.
FIGURE 5.

Average density of parvalbumin‐ (a), calretinin‐ (b), and NPY‐immunoreactive (c) neurons before (white boxes) and after seizure induction (grey boxes) recorded within the region of the cerebral hemisphere wall shown in Figures 3 and 4. The density is expressed as the number of immunoreactive cells per 250 × 250 μm unit area. N normal, nonirradiated rats; E13, E15, E17, E19 rats irradiated on prenatal days 13, 15, 17, or 19, respectively. An additional SE symbol indicates that a given animal group experienced seizures induced with pilocarpine at the age of 2 months. Each box and whisker graph shows the median (small rectangle in the box), the 25–75% variability range (large box) with maximal and minimal values (whiskers). The levels of statistical significance of differences in relation to normal rats are shown with vertically oriented decimal indexes in green for effects of irradiation alone in relation to the normal group (N), in red for effects of seizures (differences between corresponding groups experiencing or not experiencing seizures), in blue for summarized effects of irradiation and seizures related to the normal group (N). The vertical indexes in black show significance of differences in relation to seizure‐treated controls (N SE). Decimal indexes located over double headed arrows show statistical significance of differences between pairs of animal groups (Mann Whitney U‐test)
FIGURE 6.

Variations in the density of parvalbumin‐immunoreactive neurons within the examined region of the cerebral hemisphere wall shown in Figures 3 and 4. Average numbers of the cells per 250 × 250 μm unit area (the ordinate) are plotted against ten eight zones (abscissa). Lines of different colors show profiles for each animal group (inserted legend). Columns at the left side of each diagram show approximate locations of cortical layers (Roman numerals) and white matter referring to eight depth zones (D1–8) of the cerebral hemisphere wall, respectively. N, normal, non‐irradiated rats; E13, E15, E17, E1, rats irradiated on prenatal days 13, 15, 17, or 19, respectively. An additional SE symbol (status epilepticus) indicates that a given animal group experienced seizures induced with pilocarpine at the age of 2 months. Each box and whisker graph shows the median (small rectangle in the box), the 25–75% variability range (large box), maximal and minimal values (whiskers). Decimal indexes in bold show levels of statistical significance of differences between two irradiated groups: control and experiencing seizures. Indexes located close to the ordinate axis (in respective colors) show statistical significance of differences in relation to the group of normal, non‐irradiated rats (Mann Whitney U‐test). Increases are additionally marked with “+” symbols
The average density of N‐CR+ in the same region showed general increases in E13s and E15s (p < .0005 and < .0009, respectively, Figure 5b). However, some local changes within the whole thickness of cerebral hemisphere wall had different directions (Figure 7a–d). Locations of increases were detected in E13s (D4–D5, p < .009;.002), E15 (D1, p < .03; D5–D7, p < .005;.0001;.02), E17s (D1 and D6, p < .0009;.03, respectively). No increase was observed in E19s. In the same time, decreases in the density of N‐CR+ were detected in E15s, E17s, and E19s within the same area, that is, at D2–D3 (p values within the range .002–.05).
FIGURE 7.

Variations in the density of calretinin‐immunoreactive neurons within the examined region of the cerebral hemisphere wall shown in Figures 3 and 4. Average numbers of the cells per 250 × 250 μm unit area (the ordinate) are plotted against eight depth zones (abscissa). Lines of different colors show profiles for each animal group (inserted legend). Columns at the left side of each diagram show approximate locations of cortical layers (Roman numerals) and white matter referring to eight depth zones (D 1–8) of the cerebral hemisphere wall, respectively. For further explanations, see Figure 6
The density of N‐NPY+ showed neither general (Figure 5c) nor local changes (Figure 8a–d). Table 1a summarizes all the detected changes with their levels of statistical significance.
FIGURE 8.

Variations in the density of NPY‐immunoreactive neurons within the examined region of the cerebral hemisphere wall shown in Figures 3 and 4. Average numbers of the cells per 250 × 250 μm unit area (the ordinate) are plotted against eight depth zones (abscissa). Lines of different colors show profiles for each animal group (inserted legend). Columns at the left side of each diagram show approximate locations of cortical layers (Roman numerals) and white matter referring to eight depth zones (D 1–8) of the cerebral hemisphere wall, respectively. For further explanations, see Figure 6
TABLE 1.
Summary of statistically significant changes (levels of statistical significance, Mann‐Whitney test) in the distribution of PV‐, CR‐, and NPY‐immunopositive neurons (PV+, CR+, and NPY+, respectively) within the selected region of cerebral hemisphere wall shown in Figures 3 and 4

|
Statistically significant increases and decreases are highlighted in yellow and blue, respectively. (a) Effects of prenatal irradiation alone; (b) effects of seizures alone on normal brains; (c) effects of seizures alone on irradiated brains; (d) summarized effects of both irradiation and seizures. Abbreviations E13, E15, E17, E19 represent rats irradiated on prenatal days 13, 15, 17, or 19, respectively. Columns on the left show approximate locations of cortical layers (CL) and white matter referring to eight depth zones (D1–8) of the cerebral hemisphere wall, respectively.
3.2. Effects of seizures alone
In the cortex of normal, nonirradiated brains, which were subjected to seizures, the average density of N‐PV+, N‐Cr+, or N‐NPY+ did not change significantly (N vs. N SE groups, Figure 5a–c). Locally, N‐PV+ showed a decrease in their density only in a small part of the white matter (D7, p < .02; Figure 6), N‐CR+ in D3 (p < .004), and in subcortical white matter (p < .04 for D7 and D8, Figure 7). N‐NPY+ did not show any significant changes (Figure 7). All the changes are summarized in Table 1b.
In the cortex of dysplastic brains, induction of seizures led to further significant decreases in the average density of N‐PV+ in E13s (p < .05) and E15s (p < .002), with negative trends in E17s and E19s (Figure 5a). Local seizure‐induced decreases of N‐PV+ density in E13s included D1–D2 (p < .002 and .01) and D4 (p < .03, Figure 6a), in E15, D2–D4 (p < .005;.02;.0007, Figure 6b), and in E17s D1–D3 (p < .01;.05;.04) and D7‐8 (p < .02;.05, Figure 6c). In E19s, the density of N‐PV+ was lower in D3–6; p <.02; .002; .05; .03, Figure 6d; Table 1c1).
After the seizures, changes in the average density of N‐CR+ within the investigated area did not reach the level of statistical significance neither in the nonirradiated group nor in any group of dysplastic brains (Figure 5b). Local increases prior to seizures have completely disappeared and decreased densities of N‐CR+ (Figure 7a–d and Table 1c2) were detected in E13s (D2–D3, p < .03; .004), in E15s (D6, p < .03), and in E17s (D3–D5, p < .006;.02;.02). In E19s, such decreases in N‐CR occurred in D4 (p < .02) and D8 (p < .04). The average density of N‐NPY+ showed only statistically insignificant trends in E13s and E15s (Figure 5c). However, E13s were the only group with local changes, that is, increases in D3–D6 (p values from.02 to.04, Figure 8a–d and Table 1c3).
3.3. Total effects of prenatal neurogenesis disruption (irradiation) and of postnatal seizures
As the final result of prenatally disrupted neurogenesis and seizures experienced in adulthood, in the cortex of dysplastic brains, the average density of N‐PV+ became significantly lower than in untreated controls (p values from .0001 in E19s to .03 in E13s; Figure 5). Locally, those decreases in E13s and E15s included the area of D2–D5 (p values from.0001 to.004), in E17s, almost the entire cerebral cortex D1–D7 (p values from .0005 to .05), and in E19s the whole cerebral hemisphere wall (D1–D8, p values from.0001 to.05; Figure 6a–d and Table 1d). In E15s, near the lateral ventricular lumen, a small local increase in the average density N‐PV+ (p < .04) was associated with the presence of periventricular heterotopia.
Among seizure‐treated animals with dysplastic brains, E13s was the only group showing an increase in the average density of cortical N‐CR+ (p < .03; Figure 4b). Local increases of the density (Figure 6a–d) were detected in E13s (D5, p < .002), E15s (D1, p < .03; D6, p < .02), and in E17s (D1, p < .05). There were also local decreases in E13s (D2–D3, p < .04, .05), E17s (D2–D3, p < .003, .0004), and E19s (D3, p < .004).
The average density of N‐NPY+ increased significantly above the norm in E13s and E15s (p < .02,.006; Figure 5c), and local significant increases (Figure 8a–d) were observed in E13s within the range D2–D5 (p values from.002 to.05) and in E15s at D2–D3 (p < .007;.03) and D6–D8 (p < .04;.03;.02). In E17s, the density of N‐NPY+ increased in D2–D4 (p < .004;.04;.03) and D7 (p < .05) but E19s showed no significant local change.
All the changes in N‐PV+, N‐CR+, or N‐NPY+ distribution are summarized in Table 1 as effects of gamma irradiation alone on prenatal neurogenesis (Table 1a), effects of seizure induction in control and irradiated brains (Table 1b and c), and as effects of both treatments (Table 1d).
3.4. Correlation between changes in EEG spectrum or the intensity of behavioral seizure symptoms and changes in the number of PV+ neurons
Interruptions of prenatal neurogenesis alone, apart from changes in the neocortical structure, led also to changes in the power of particular frequency bands of EEG signal. Profiles of the changes were presented previously (Kielbinski et al., 2018; Setkowicz et al., 2020).
To avoid an extra‐scale variability of EEG signal between individual animals, the power of each band at the stage of seizure induction (SE stage) was divided by the power of the same band recorded at the stage before seizure induction (PRE‐SE stage) in the same animal. By this way, each EEG band was expressed by the ratio of increase between the two experimental stages instead of its absolute power. The same was applied for the changes between the PRE‐SE and POST‐SE stages. After seizures, in the dysplastic brains further significant changes in the cortical structure were detected but their correlations with increases in the power of EEG signal reached statistical significance only in the case of N‐PV+ (Figure 9a) but not in N‐CR+ or N‐NPY+.
FIGURE 9.
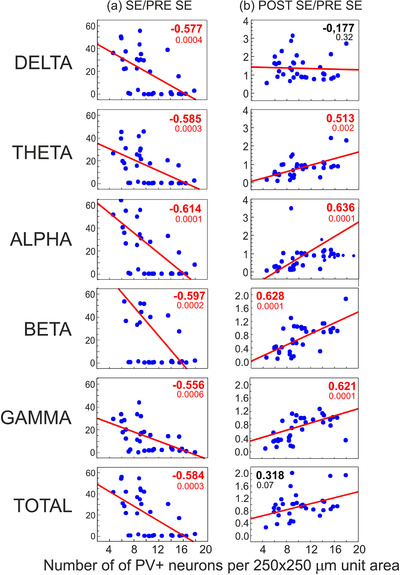
Correlations of changes of the average density of PV‐immunopositive neurons and increases in the power of selected EEG bands recorded during 6 h periods after induction of seizures (a, SE stage) and after seizure disappearance (b, POST‐SE stage). The ordinate axes show values of ratios between the intensities of EEG signal recorded at the SE or POST‐SE stages and the control pre seizure level (PRE‐SE stage) respectively. The ratios are symbolized as SE/PRE‐SE or POST‐SE/PRE‐SE, respectively. Spearman's rank coefficients of correlation are shown in bold as significant (in red) or insignificant (in black) with indexes of statistical significance. Solid diagonal lines show linear fits for the correlations
The correlations for N‐PV+ were negative within the range between −0.614 and −0.556. It means that the higher was the N‐PV+ density, the lower increases were in the power of each EEG frequency band. After the behavioral seizure symptoms subsided, the correlations became positive. It means that the remaining power of EEG signal was greater in brains where the more cortical N‐PV+ survived (or the higher was neuronal expression of parvalbumin) compared to the preseizure stage (Figure 9b). All the significant positive correlation coefficients had values within the 0.513–0.636 range. However, the power of Delta band did not show a significant correlation with the density of N‐PV+. Consequently, the total power of EEG signal, as depending mostly on the Delta frequency, lost the correlation as well. It is noteworthy to indicate that the postseizure correlations refer to levels of EEG power many times lower than those recorded before seizure induction. Therefore, they appear to reflect the return to normal brain activity and this process could be considered as depending functionally on the presence of N‐PV+.
Expectedly, the above correlations closely corresponded with those between the intensity of behavioral seizure symptoms and the N‐PV+ density. Their values were r = −0.601 (p < .0002) for MAX SE, r = −.596 (p < .004) for 6 h SE SUM, and r = −0.653 (p < .00005) for seizure duration (Figure 10).
FIGURE 10.

Correlations between the intensity of behavioral seizure symptoms (the ordinate) and the average density of PV‐immunopositive neurons (abscissa). Spearman s rank coefficients of correlation are shown in bold with indexes of statistical significance. The average densities of PV+ neurons are plotted against scores of the maximal seizure intensity reached within the whole observation (a, MAX SE), summarized scores of maximal seizure intensity recorded in each of successive 10‐minute periods within the whole 6 h observation time (b, 6h SE SUM) or seizure duration (c). Solid diagonal lines show linear fits for the correlations
Consequently, significant correlations were found between increases in the total power of EEG signal and parameters of behavioral seizure symptoms: r = 0.660 (p < .000002) for MAX SE, r = .787 (p < .00000001) for 6 h SE SUM, and r = 0.874 (p < .0000000001) for seizure duration (Figure 11).
FIGURE 11.

Correlations between increases in the total power of EEG signal and the intensity of behavioral seizure symptoms (MAX SE or 6 h SUM SE). Spearman's rank coefficients of correlation are shown in bold with indexes of statistical significance. Increases the total power of EEG signal or particular EEG bands (abscissa) are plotted against scores of the maximal seizure intensity reached within the whole observation (a, MAX SE), summarized scores of maximal seizure intensity recorded in each of successive 10‐min periods within the whole 6 h observation time (b, 6h SE SUM) or seizure duration (c). Solid lines show linear fits for the correlations
4. DISCUSSION
Several animal models of a brain dysplasia produced by interruption of a one selected stage of prenatal neurogenesis (for example Baraban et al., 2000; Battaglia et al., 2013; Chen & Roper, 2003; Colciaghi et al., 2011; Deukmedjian et al., 2004; Kellinghaus et al., 2004; Kondo et al., 2001; Zhou & Roper, 2010a, 2010b) are dedicated to simulate analogous clinical cases frequently associated with drug‐resistant epilepsy (Baraban et al., 2000; Barkovich et al., 2015; Battaglia et al., 2013; Blümcke et al., 2011; Chen & Roper, 2003; Colciaghi et al., 2011; Deukmedjian et al., 2004; Kellinghaus et al., 2004; Kondo et al., 2001; Rudy et al., 2011; Zhou & Roper, 2010b). Because the production of neurons that are predestined for each of the neocortical layers reaches its peak according to a precisely defined spatio‐temporal schedule (Bayer et al., 1993), the developmental stage at which the proliferative activity is interrupted determines which of the layers will have maximal reduction of its neuronal population and, consequently, maximal functional impairment. In the same way, this interruption affects sets of neurons of various neurochemical phenotypes. Since the neuronal production is a widespread and continuous process, all the remaining cortical layers are always affected but at different degrees.
Irradiation‐induced defects of neuronal migration have an additional impact on the clarity of the dysplastic patterns. A significant part of neurons, which are formed at a defined developmental stage, does not reach its destination sites and settles in deeper cortical layers because of changes in extracellular matrix creating an environment for cell migration (Inouye et al., 1993; Sun et al., 1999; Verreet et al., 2016). We have already assessed approximate ranges of such locational shifts resulting from gamma‐irradiations at four developmental stages applied in our investigations (Setkowicz et al., 2014). These abnormalities lead to modification in the distribution of synapses and fiber orientation (Saito et al., 2014). Finally, to adequately present the range of dysplastic changes, it should be stated that all subcortical structures undergoing neurogenesis at the time of irradiation are always simultaneously affected in a generally similar, diffuse way. Depending on the developmental stage at which the irradiation occurs, a typical pattern of brain dysplasia is formed. This change is accompanied by characteristic modification in seizure susceptibility. Traditionally, but incorrectly, all the effects of the disruption of prenatal neurogenesis (mostly using antimitotic chemical agents like MAMac or ionizing radiation), which diffusely impair the whole brain, are commonly declared and termed as models of cortical dysplasia without paying attention to other functionally linked and also affected brain regions.
The above conclusion was formulated for the first time, when we extended the commonly used model of brain dysplasia (Setkowicz et al., 2003) to compare the effects of neurogenesis interruptions at each of four selected stages of prenatal development. Our further research (Kielbinski et al., 2018; Setkowicz et al., 2014, 2020) showed that this “quadruple” model more adequately represents the wide variability of clinical cases.
This approach drew our attention to the previously unnoticed functional consequences of brain dysplasia. For the first time, and in spite of the common belief that any disorder of the brain structure increases its tendency to seizures, it was revealed that a particular degree (or type) of dysplasia may decrease susceptibility to seizures even below that observed in the normal brain (Setkowicz et al., 2003). Moreover, this particular dysplasia could prevent the brain from a strong increase in seizure susceptibility (Setkowicz & Janeczko, 2005) which develops inevitably after a mechanical damage in the normal brain, as it has been documented earlier (Setkowicz & Janeczko, 2003). Also, in this methodological approach, the anatomical and structural changes could be considered as a continuum (Setkowicz et al., 2014, 2020) and detected significant correlations of these changes with susceptibility to seizures justified further exploration of possible causal relationships. So far, the data on spontaneous seizure activity in the dysplastic brains are very few (Chen & Roper, 2003; Kellinghaus et al., 2004; Kondo et al., 2001; Zhou and Roper, 2010b). Therefore, most of the research focuses on changes in the reactivity of dysplastic brains to various exogenous seizure‐genic factors (“second hit”) (for example, Battaglia et al., 2013; Setkowicz et al., 2005, 2003, 2014; Tschuluun et al., 2011).
Our investigations have been devoted to a more universal definition of the consequences of diffuse brain dysplasia using the “multiple” model of single developmental interruptions. These consequences are simultaneously considered in three main aspects: (1) primary dysplastic structural changes as determinants of modified functional features of the brain in normal living conditions at a “resting state,” (2) variability of responsiveness to seizuregenic agents showed by behavioral and/bioelectric symptoms, and (3) differences in tissue reactivity to already occurring seizures (neurodegeneration).
In the brain dysplasia induced with bromodeoxyuridine given on E15 (Benardete & Kriegstein, 2002), an increase in excitability of the cerebral cortex was found with qualitative disorders of the distribution of CB+, PV+, or CR+ neurons but without changes in their density. Roper et al. (1999) detected significant decreases in the density of PV+ and CR+ neurons in the cerebral cortex (67 and 50% of the norm, respectively) and, in their further studies, considered them to be determinants of increased excitability (Chen & Roper, 2003; Zhou & Roper, 2010a).
Zhou and Roper (2010b) recorded spontaneous discharges and excitatory and inhibitory synaptic currents in PV+ and CR+ interneurons in slices of the somatosensory cortex, which was under consideration in the present study, from rat brains with dysplasia induced with irradiation on E17. In PV+ neurons, the frequency and regularity of spontaneous action potentials were reduced and were accompanied by decreases in excitatory synaptic influences on these neurons. This might underlie a reduction of the inhibitory influences of PV+ neurons and increases in cortical excitability. In contrast, CR+ neurons did not display similar features, thus, indicating, in this respect only, their neutral relation to general functional changes typical of the dysplastic brain. The detected phenomena appear to support the results of the present study showing that involvement of PV+ neurons in the brain seizure susceptibility was much greater than that of those expressing CR. However, in the study by Zhou and Roper (2010a), a much stronger radiation dose (2.25 Gy) was used and the cerebral cortex showed a much more disorganized laminar pattern. Therefore, changes in laminar distribution could not be analyzed and, for example, the densities of glutamate transporters were summarized to average values for the whole dysplastic cortex, then compared to particular layers of the normal cortex. By using 1 Gy irradiation dose in our research, we tried to lower its destructive influences, while preserving, at least in part, a general cortical stratification with its relation to the entire thickness of the cerebral hemisphere wall and subcortical neuronal aggregates resulting from migration disorders. However, because of the differently modified cortical structure, particular layers could not be directly compared with their normal pattern and the eight depth zones scale was applied.
Previously (Setkowicz et al., 2014), we reported that periventricular heterotopia were located not only bilaterally but also unilaterally and this variability was observed even within the same female offspring. This fact cannot be explained by different in utero locations of the fetuses, especially when irradiation was applied from two opposite directions. It is generally declared that the heterotopia result from defects in neuronal migration from the periventricular region. However, the vast majority of GABA‐ergic neurons are generated in the ventral proliferating zones and they reach the dorsal cortex via tangential migration. Therefore, to our best knowledge, the abundant presence of these neurons in the heterotopia (Figure 4) remains unexplained.
Technically, our histological evaluations were based on commonly applied measurements of neuronal density at different depths of the cerebral hemisphere wall (for example, see Barinka et al., 2010; Barinka & Druga, 2010; Clark et al., 2017; Kuchukhidze et al., 2013; Moroni et al., 2008; Papp et al., 2018; Zhou & Roper, 2010a). Irradiation in the early prenatal stages (E13 and E15) led to significant structural changes in the brain hemisphere wall. The composition of each of the cortical layers was incomplete and functionally undefined because the neuronal migration stopped at intermediate positions including white matter. However, even if the neurons remained within periventricular regions, they might develop functional connections to the cerebral cortex (Battaglia et al., 2003; Tschuluun et al., 2011; Zhou et al., 2010b) and even to the spinal cord (Jensen & Killackey, 1984). From our previous studies (Setkowicz et al., 2014, 2020), we know that the relative size of subcortical heterotopia correlates positively with seizure susceptibility and, consequently, this correlation is negative for the volume of the above located neocortex as it lacks the neurons which have remained in periventricular regions.
Such changes are commonly presented as the only determinants of seizure excitability without any reference to the still undefined and irreversible extracortical changes. This means, therefore, that the assignment of the abnormal neuronal distribution to the standard cortical layers, characterizing also their functional features, became unreasonable (for example, Zhou & Roper, 2010a). Instead, the actual distribution of these neurons within arbitrarily delineated cortical depth zones could be effectively correlated with the parameters of bioelectric activity in the cerebral cortex. Therefore, in the present study, it was assumed that the subcortical heterotopias and the altered cerebral cortex above them create a continuum of changes in neuronal distribution within the whole examined area. It also included a part of the radiation of the corpus callosum since immunopositive neuronal bodies were also present in it.
Here, changes in density were evaluated for PV+ or CR+ neurons, that is, those containing calcium‐binding proteins typical of GABAergic inhibitory interneurons. They were also estimated for interneurons immunopositive for NPY, an endogenous neuroprotectant and anticonvulsant (Baraban, 2004; Dobolyi et al., 2014; Xapelli et al., 2007). The obtained results were tested for their correlation with susceptibility to seizures assessed on the basis of behavioral symptoms and on the power of EEG signal within particular frequency bands.
While planning this study, possible changes in neuronal distribution within the examined area of the cerebral hemisphere could be predicted based on the commonly known general neurogenetic schedule. According to Bayer et al. (1993), neocortical neurons in the rat are produced between E13 and E20, with a peak around E15. The earliest‐formed neurons migrate into the cortical layer I and subplate. For the remaining cortical layers, the neurons arise between E13 and E20 according to the inside‐out scheme, that is, the neurons formed around E15 populate the deep layers (VI and V), and those from around E16 and E17‐18 are successively destined for layers IV and II/III. This pattern is also followed by glutamatergic neurons that migrate radially to the neocortex from the ventricular proliferative zone (Fairén et al., 1986).
Unlike glutamatergic, GABAergic neurons arise in the ventral germinal zones and tangentially migrate to the dorsal cortex (Miyoshi et al., 2007; Miyoshi & Fishell, 2011; Taniguchi et al., 2013). Among them, the production of PV+ and CR+ neurons is most intense around E17 or E16, respectively, with generally similar profiles. However, while N‐PV+ colonize the cortex in the inside‐out sequence, N‐CR+ follow the opposite outside‐in pattern (Rymar & Sadikot, 2007). Consequently, a peak of NPV+ production occurs earlier for deep layers (around E14–16) than for surface ones (E18), but for N‐CR+ the profile is reversed and peaks around E18–19 for deep layers and at E16 for more superficial layers.
In rodents, N‐PV+ and N‐CR+ interneurons are formed in different areas of the embryonic brain (Gelman et al., 2012; Fazzari et al., 2020) and they constitute separate populations with different distribution in cortical layers which is additionally modified in particular functionally defined areas (Barinka & Druga, 2010; Kubota et al., 2011). This results in various impacts on projection neurons (Barinka & Druga, 2010) since PV+ and CR+ neurons play different roles when forming units responsible for the synchronization of pyramidal neurons, particularly extracortical, activity and disinhibition phenomena (Barinka & Druga, 2010; Clark et al., 2017; Druga, 2009; DeFelipe, 1999; Feldmeyer et al., 2018; Kubota et al., 2011; Tremblay et al., 2016).
Disruption of different stages of neurogenesis and the resulting permanent dysplastic changes can have various functional consequences for each of these neuronal populations but these still remain obscure. Additionally, CR is believed to have neuroprotective effects (Barinka & Druga, 2010) which are an additional factor that might differentiate reactivity of these cells.
In this study, quantitative changes in the two subpopulations were compared. However, if we only considered consequences of the interruption of one stage of neurogenesis (i.e., that occurred on E15 or E17), then, any significant change detected in each of these isolated cases could automatically be accepted (sometimes incorrectly), as a critical determinant of modified susceptibility to seizures. In this work, however, two wide and continuous spectra of changes in N‐PV+ or N‐CR+ populations, characteristic of four degrees of dysplastic changes taken together, were simultaneously matched with behavioral and EEG evidence of functional disorders. Even though the average quantities of N‐CR+ were much lower than those of N‐PV+, the functional consequences of their changes could not be assessed in the same way since the results should be confirmed when other regions of the brain are included in the analyses.
The lack of significant correlation was demonstrated for N‐NPY+, even though their presence in the dysplastic neocortex was clearly higher than that in the normal one. The antiseizure and neuroprotective functions of NPY in neurons are well known (Baraban et al., 2000; Decressac & Barker, 2012; Xapelli et al., 2007), but no significant correlation was observed here between seizure intensity and the number of N‐NPY+ that survived seizures. The results obtained here and the previously detected regional volume changes (Setkowicz et al., 2020) point again to a wider extracortical location of the neural determinants of seizure susceptibility.
Calcium‐binding proteins protect neuronal homeostasis by buffering incoming calcium ions and they also determine neuronal resistance to degeneration and influence synaptic plasticity. The neuroprotective role of PV is realized with the participation of perineuronal nets, which disappear in response to the oxidative stress that accompanies seizures (Hsieh et al., 2017; Rankin‐Gee et al., 2015).
CR+ neurons have significant sensitivity (Barinka et al., 2010; Barinka & Druga, 2010; Toth & Magloczky., 2014) but are more resistant to seizures than N‐PV+ (Aronica et al., 2007; Barinka et al., 2010; Fairless et al., 2019). Supposedly, this results from the neuroprotective effects of calretinin (Barinka et al., 2010). In clinical epilepsy cases, the number of N‐PV+ decreased significantly but that of N‐CR+ did not (Zamecnik et al., 2006). Similar changes occurred in focal cortical dysplasia (Barinka & Druga, 2010). In this study, before the seizures, N‐CR+ had higher average density in the whole investigated area in E13s and E15s, but only locally in E17s, although this was accompanied by local decreases in other intracortical locations. Compared to N‐PV+, the seizures had a relatively little negative impact on CR+ neurons. In contrast, after the seizures, we observed an increase in the N‐CR+ population in the hippocampus (Blümcke et al., 1999; Marx et al., 2013) as well as marked synaptic reorganization and axonal sprouting, and possibly aberrant neuronal circuitries. Similar studies on postseizure changes in the cerebral cortex are relatively rare in comparison to those on the hippocampal formation.
When matched with N‐PV+ and N‐CR+, the presence of N‐NPY+ or the expression of NPY itself could also protect the brain under pathological conditions (Baraban et al., 2000; Dobolyi et al., 2014; Rankin‐Gee et al., 2015). Essentially, N‐NPY+ colonize the neocortex according to the inside‐out sequence, being maximal around E17; however, significant changes in NPY expression occur during development (Cavanagh & Parnavelas, 1990). The vast majority of N‐NPY+ originates around E17 and is distributed mainly within the layer VI and also in layers II‐IV, but some of them are located in white matter (Cavanagh & Parnavelas, 1990; de Quidt & Emson, 1986). However, a quantitative reduction of N‐NPY+, which could be expected in this study after irradiation in E17, did not occur.
However, postseizure increases in the density of N‐NPY+ were greatest in E13s and E15s. However, like N‐CR+, they showed no significant correlation with seizure intensity even though their density differed significantly between particular groups with dysplastic brains. Increases in cortical expression of NPY in the context of epileptic activity or various pathological conditions have already been described as endogenous neuroprotective and antiseizure factors (Decressac & Barker, 2012; Dobolyi et al., 2014; Vezzani & Sperk, 2004).
These local increases in N‐NPY+ density can only be considered to be the effect of elevated NPY expression in response to seizures. As not detected prior to seizures, they could not result from disruptions of prenatal neurogenesis. Since this kind of reactivity occurred in E13s, E15s, and E17s, it could underlie some effects which were completely missing in E19s. This uneven distribution of NPY expression could have been of significance for the previously presented general profile of susceptibility to seizures in the model of four degrees of brain dysplasia (Setkowicz et al., 2005, 2003). However, the lower dose of pilocarpine used here made it impossible to directly compare the previously and recently obtained results.
Most information about NPY effects also comes from studies on the hippocampal formation, so it cannot be ruled out that they might be region‐dependent. For example, after electroshocks, NPY immunoreactivity in rats increased in the parietal cortex and the hippocampus, but not in the striatum (Wahlestedt et al., 1990). Such regional variations can occur even within the cortex itself. According to Van Raay et al. (2012), NPY administration reduced the seizure activity of the somatosensory cortex, but not the motor cortex and suppressed spike‐wave discharges based on the cortico‐thalamo‐cortical loop in a model of absence epilepsy (Ali et al., 2018).
In our quadruple model of brain dysplasia, the overall pattern of reactivity of N‐PV+, N‐Cr+, and N‐NPY+ was generally consistent with other published data. At the same time, differences were found between particular degrees of dysplasia, which also generally confirm our own, previously published profiles of susceptibility to seizures induced with pilocarpine (Setkowicz et al., 2003) but not to those induced with kainic acid, which showed a generally opposite pattern (Setkowicz et al., 2005).
This study has identified pairs of animal groups that differ both in their parameters of seizure excitability and densities of immunopositive neurons in the cerebral cortex. However, these parameters were additionally significantly correlated with each other only in the case of N‐PV+. In contrast, in the case of changes in the densities of N‐CR+ and N‐NPY+, there was not even a tendency toward such a direct relation to seizure excitability. In many of the studies cited above‐cited studies, an animal group with only one degree of brain dysplasia (e.g., induced on E15s or E17s) was compared with controls. Consequently, any detected change of dysplastic origin was automatically considered to be the cause of the observed differences in seizure susceptibility. However, some detected intergroup differences might not be of causal importance, but only accompanying phenomena. Thus, their causal significance for seizure symptoms or for changes in EEG spectra should rather be reflected by “dose‐dependent” relations. The use of the quadruple model of dysplasia helps to detect such effects by examining correlations between phenomena that form continua that are much broader than before (Setkowicz et al., 2014, 2020). We have recently shown a significant correlation between the intensity of behavioral seizure symptoms or EEG frequency bands and volumetric changes of various regions of the dysplastic brains (Setkowicz et al., 2020). This was a general indication of possible internal structural changes occurring in these regions and having functional importance. The present article focuses on the neural structure of the cerebral cortex; however, more generalized studies are necessary since the observed phenomena must have much broader and still unrecognized extracortical determinants which are beyond the scope of reports published so far.
In animal studies, it is common to arbitrarily divide recorded EEG spectra based on visual evaluation and ranges of standard frequency bands in humans. However, the frequency bands distinguished using PCA are more consistent with physiological determinants in given animal and experimental conditions, and they undergo changes in relation to specific brain areas, locations of recording and reference electrodes, or many others. Therefore, in this study, we defined the EEG bands on the basis of the reasons described in detail by Jing et al. (2016).
Due its superficial location, the cerebral cortex exerted a dominant influence on the pattern of recorded EEG signal and the importance of cortical interneurons was correspondingly greater. However, the neural mechanisms underlying the detected changes in EEG spectra could not be localized using the present experimental design since generators of particular EEG rhythms include extracortical structures formed according to different schedules of neuronal production (Bayer et al., 1993). Therefore, these structures were impaired to various degrees by interruptions of particular developmental stages, which determined their functional involvement in systems that generate particular rhythms (Setkowicz et al., 2020). The Delta rhythm depends on cortico‐thalamic connections and can be reduced by beta or gamma oscillations based on cortical interneurons (Cardin, 2018; Cohen et al., 2017; Mann & Paulsen, 2007, 2015; Neske & Connors, 2016; Neske et al., 2015). The theta rhythm, which is typical of rodents, is based on structures that extend from the prefrontal cortex to the brainstem (Fujisawa & Buzsáki, 2011; Orzeł‐Gryglewska et al., 2015; Pignatelli et al., 2012). Different brain regions are involved in generation of the gamma rhythm (Whittington et al., 2011). In fact, all mechanisms responsible for the components of EEG spectra and their functional interrelations are still poorly understood (Cataldi & Vigliotti, 2018; Jing et al., 2016).
The initial concept of PV+ interneurons function was that they provide local inhibitory feedback loops in the local cortical and thalamocortical circuits (Bartholome et al., 2020; Hu et al., 2017). More recent results, as the most important, indicate synchronization of the systems within the gamma frequency (Sohal et al., 2009). The appearance of PV expression or changes in its level depend on neuronal activity (Filice et al., 2016). In our study, the correlation between the density of PV+ neurons (with a possible variable level of PV protein expression) and the seizure activity varied from negative values in the SE stage to positive values in the POST‐SE stage. This may reflect two aspects of the influence of these neurons on cortical activity. On the one hand, their main function is to support the regularity of discharges within the gamma frequency range (Sohal et al., 2009), with inhibitory effects on irregular and abnormal overexcitation; on the other hand, they provide supportive preservation of neuronal activities in states of energy deficiency during and after seizures (MacMullin et al., 2020). In this article, however, the expected more specific and stronger correlation with changes in gamma band power has not been distinguished, so in this case, the influence of PV+ neurons might be much broader. Perineuronal nets have also a significant impact on the function of PV+ neurons, especially when they disintegrate in pathological states (Tewari et al., 2018). However, PV+ interneurons themselves also have a high energy requirement, so during seizures they may be functionally collapsed and this, in turn, may change the level of PV expression. It should also be noted that the possible disinhibitory interaction of PV+ neurons (Pfeffer et al., 2013), including their different types, is rather beyond the scope of this article. They are functionally differentiated and also have distinct modes of migration (Miyoshi et al., 2007, 2011; Taniguchi et al., 2013) so they could be affected differently following prenatal irradiations. Thus, more advanced statements based on general quantitative changes in neuronal populations are not reasonably justified.
Concerning the studied neuronal populations, it is not known to what extent their recorded quantitative variability depended on actual numerical changes or on the expression levels of their markers, which are also of functional importance (Arkan et al., 2019; Barinka et al., 2010: Gall et al., 2003; Schwaller et al., 2004). The detected decreases in the density of N‐PV+ and N‐CR+ could have been the final result of decreases in neuronal production and/or seizure‐induced degeneration, or of decreases in the expression of the marker proteins which are also of functional importance (Dobolyi et al., 2014; Marksteiner et al., 1989). In contrast, the detected increases in N‐CR+ or N‐NPY+ density could only be the effect of higher expression of respective proteins (Marksteiner et al., 1989), which could also be important for neuronal survival.
The largest decreases were detected in the quantity of PV+ neurons. Despite the increase found in E15s before seizures, their average density in each group after seizures was lower than in the controls. Local changes in the density of N‐PV+ at particular depth zones within the cerebral hemisphere wall were clearly negative after both irradiation and seizures. Finally, these decreases spread throughout the greater part of the cortical thickness (in E13s and E15s) and even within the total thickness of the cerebral hemisphere wall (in E19s). Here, in the model of the combined four degrees of brain dysplasia, only N‐PV+ showed density decreases which gradually covered more and more of the cortical layers after gradually later disruptions of neurogenesis. This corresponded with the seizure reactivity profiles detected in our previous studies (Setkowicz et al., 2003, 2005).
In the present study, especially at particular depth zones or cortical layers, it was difficult to detect the exact location of changes, that were associated with the modification of seizure reactivity, but some clear indicators of their significant functional significance were obtained, which may initiate further research.
5. CONCLUSIONS
As the result of prenatal irradiation performed at different stages of neurogenesis, various general and/or local changes in the density of PV+, CR+, and NPY+ neurons were developed in the examined area of the brain hemisphere wall. Seizure induction in mature brains caused further changes in this regard. As a combined effect of these two treatments, the density of PV+ neurons decreased within the area which was minimal in E13s, gradually greater in E15a and E17s and maximal in E19s, where it included the whole thickness of the cerebral hemisphere wall.
For effective comparisons of the changes occurring in different locations in particular patterns of dysplasia, one common scale of eight depth degrees was used, and all the detected changes were assigned to this scale for statistical analysis.
After seizure induction (SE stage), the higher the density of PV+ neurons, the lower the increase in absolute EEG signal power was (negative correlation). However, when seizures disappeared (POST‐SE stage), the EEG power approached the normal level but remained elevated. Then, the correlation became positive: the higher the density of PV+ neurons, the greater the still elevated EEG power was. This appears to suggest that the presence of PV+ neurons neutralized the development of seizure‐related activity after it was evoked, but it also delayed the decline of this activity when the SE stage had already finished. While the first relationship included the entire EEG spectrum and each EEG band separately, the second relationship referred only to bands with frequencies higher than Delta, thus, constituted a much smaller part of the previous EEG power. In the case of CR+ or NPY+ neurons, no similar relationship between the EEG signal was found. These results seem to indicate a special role of PV+ neurons in the seizure reactivity of the cerebral cortex, at least in the pilocarpine model.
The increased density of NPY+ neurons after irradiation alone in E13 seems particularly, but its further increases in response to seizures induced in adult brains of E13s, E15s, and E17s may suggest neuroprotective influences.
From a methodological point of view, it was important not only to detect a significant correlation between changes in the density of PV+ neurons and changes in the EEG spectra, but also between changes in the intensity of seizure behavior. Taken together, they form a set of reciprocally confirming relations. However, the latter correlation positively verifies the scale used in our studies for the assessment of seizure behavioral symptoms.
Finally, it should be noted that an attempt to correlate changes in neuronal density with often arbitrarily selected functional parameters cannot always detect simple numerical relationships since different types of brain dysplasia present examples of neural systems which combine continua of variability in all neuronal types and their interactions. The “quadruple” model of dysplasia that was applied in this study differs considerably from the commonly used models of one‐stage interruption of prenatal neurogenesis since this model creates a wide range of changes which are more difficult to study. This model, however, reflects more adequately to variability of clinical cases and helps to indicate significant phenomena in this research area.
CONFLICT OF INTEREST
The authors declare no conflict of interest.
AUTHOR CONTRIBUTIONS
Zuzanna Setkowicz implanted EEG teletransmitters, supervised and partially participated in performance of laboratory works.
Kinga Gzielo participated in assessments of animal seizure behavior, histological procedures and microscopic observations.
Michal Kielbinski performed remote recordings of EEG signal and its preliminary analysis.
Krzysztof Janeczko planned the study, analyzed all the obtained data, prepared figures and wrote and edited the manuscript.
Setkowicz, Z. , Gzielo, K. , Kielbinski, M. , & Janeczko, K. (2022). Structural changes in the neocortex as correlates of variations in EEG spectra and seizure susceptibility in rat brains with different degrees of dysplasia. Journal of Comparative Neurology, 530(9), 1379–1398. 10.1002/cne.25282
The open‐access publication of this article was funded by the Priority Research Area BioS under the program “Excellence Initiative – Research University” at the Jagiellonian University in Krakow.
DATA AVAILABILITY STATEMENT
The data that support the findings of this study are available from the corresponding author upon reasonable request.
REFERENCES
- Ali, I. , Gandrathi, A. , Zheng, T. , Morris, M. J., O'Brien, T. J. , & French, C. (2018). Neuropeptide Y affects thalamic reticular nucleus neuronal firing and network synchronization associated with suppression of spike‐wave discharges. Epilepsia, 59, 1444‐1454. 10.1111/epi.14451 [DOI] [PubMed] [Google Scholar]
- Arkan, S. , Kasap, M. , Akman, O. , Akpinar, G. , Ateş, N. , & Karson, A. (2019). The lower expression of parvalbumin in the primary somatosensory cortex of WAG/Rij rats may facilitate the occurrence of absence seizures. Neuroscience Letters, 709, 134299. 10.1016/j.neulet.2019.134299 [DOI] [PubMed] [Google Scholar]
- Aronica, E. , Redeker, S. , Boer, K. , Spliet, W. G. , van Rijen, P. C. , Gorter, J. A. , & Troost, D. (2007). Inhibitory networks in epilepsy‐associated gangliogliomas and in the perilesional epileptic cortex. Epilepsy Research, 74, 33‐44. [DOI] [PubMed] [Google Scholar]
- Baraban, S. C. (2004). Neuropeptide Y and epilepsy: Recent progress, prospects and controversies. Neuropeptides, 38, 261‐265. [DOI] [PubMed] [Google Scholar]
- Baraban, S. C. , Wenzel, H. J. , Hochman, D. W. , & Schwartzkroin, P. A. (2000). Characterization of heterotopic cell clusters in the hippocampus of rats exposed to methylazoxymethanol in utero. Epilepsy Research, 39, 87‐102. [DOI] [PubMed] [Google Scholar]
- Barinka, F. , & Druga, R. (2010). Calretinin expression in the mammalian neocortex: A review. Physiological Research, 59, 665‐677. [DOI] [PubMed] [Google Scholar]
- Barinka, F. , Druga, R. , Marusic, P. , Krsek, P. , & Zamecnik, J. (2010). Calretinin immunoreactivity in focal cortical dysplasias and in non‐malformed epileptic cortex. Epilepsy Research, 88, 76‐86. [DOI] [PubMed] [Google Scholar]
- Barkovich, A. J. , Dobyns, W. B. , & Guerrini, R. (2015). Malformations of cortical development and epilepsy. Cold Spring Harbor Perspectives in Medicine, 5, a022392. [DOI] [PMC free article] [PubMed] [Google Scholar]
- Bartholome, O. , de la Brassinne Bonardeaux, O. , Neirinckx, V. , & Rogister, B. (2020). A composite sketch of fast‐spiking parvalbumin‐positive neurons. Cerebral Cortex Communications, 1, tgaa026. [DOI] [PMC free article] [PubMed] [Google Scholar]
- Battaglia, G. , Colciaghi, F. , Finardi, A. , & Nobili, P. (2013). Intrinsic epileptogenicity of dysplastic cortex: Converging data from experimental models and human patients. Epilepsia, 54(Suppl 6), 33‐36. [DOI] [PubMed] [Google Scholar]
- Battaglia, G. , Pagliardini, S. , Saglietti, L. , Cattabeni, F. , Di Luca, M. , Bassanini, S. , & Setola, V. (2003). Neurogenesis in cerebral heterotopia induced in rats by prenatal methylazoxymethanol treatment. Cerebral Cortex, 13, 736‐48. [DOI] [PubMed] [Google Scholar]
- Bayer, S. A. , Altman, J. , Russo, R. J. , & Zhang, X. (1993). Timetables of neurogenesis in the human brain based on experimentally determined patterns in the rat. Neurotoxicology, 14, 83‐144. [PubMed] [Google Scholar]
- Benardete, E. A. , & Kriegstein, A. R. (2002). Increased excitability and decreased sensitivity to GABA in an animal model of dysplastic cortex. Epilepsia, 43, 970‐982. [DOI] [PubMed] [Google Scholar]
- Blümcke, I. , Beck, H. , Suter, B. , Hoffmann, D. , Födisch, H. J. , Wolf, H. K. , Schramm, J. , Elger, C. E. , & Wiestler, O. D. (1999). An increase of hippocampal calretinin‐immunoreactive neurons correlates with early febrile seizures in temporal lobe epilepsy. Acta Neuropathologica, 97, 31‐39. [DOI] [PubMed] [Google Scholar]
- Blümcke, I. , Thom, M. , Aronica, E. , Armstrong, D. D. , Vinters, H. V. , Palmini, A. , Jacques, T. S. , Avanzini, G. , Barkovich, A. J. , Battaglia, G. , Becker, A. , Cepeda, C. , Cendes, F. , Colombo, N. , Crino, P. , Cross, J. H. , Delalande, O. , Dubeau, F. , Duncan, J. , … Spreafico, R. (2011). The clinicopathologic spectrum of focal cortical dysplasias: A consensus classification proposed by an ad hoc task force of the ILAE diagnostic methods commission. Epilepsia, 52, 158‐174. [DOI] [PMC free article] [PubMed] [Google Scholar]
- Cardin, J. A. (2018). Inhibitory interneurons regulate temporal precision and correlations in cortical circuits. Trends in Neuroscience, 41, 689‐700. [DOI] [PMC free article] [PubMed] [Google Scholar]
- Cataldi, M. , & Vigliotti, C. (2018). The evolving concept of the intrinsic hippocampal theta/gamma oscillator. Frontiers in Bioscience (Schol Ed), 10, 143‐165. [DOI] [PubMed] [Google Scholar]
- Cavanagh, M. E. , & Parnavelas, J. G. (1990). Development of neuropeptide Y (NPY) immunoreactive neurons in the rat occipital cortex: A combined immunohistochemical‐autoradiographic study. Journal of Comparative Neurology, 297, 553‐563. [DOI] [PubMed] [Google Scholar]
- Chen, H. X. , & Roper, S. N. (2003). Reduction of spontaneous inhibitory synaptic activity in experimental heterotopic gray matter. Journal of Neurophysiology, 89, 150‐158. [DOI] [PubMed] [Google Scholar]
- Clark, R. M. , Blizzard, C. A. , Young, K. M. , King, A. E. , & Dickson, T. C. (2017). Calretinin and Neuropeptide Y interneurons are differentially altered in the motor cortex of the SOD1G93A mouse model of ALS. Scientific Reports, 7, 44461. [DOI] [PMC free article] [PubMed] [Google Scholar]
- Cohen, M. X. (2017). Where does EEG come from and what does it mean? Trends in Neuroscience, 40, 208‐218. [DOI] [PubMed] [Google Scholar]
- Colciaghi, F. , Finardi, A. , Frasca, A. , Balosso, S. , Nobili, P. , Carriero, G. , Locatelli, D. , Vezzani, A. , & Battaglia, G. (2011). Status epilepticus‐induced pathologic plasticity in a rat model of focal cortical dysplasia. Brain, 134, 2828‐2843. [DOI] [PubMed] [Google Scholar]
- Covolan, L. , & Mello, L. E. A. M. (2000). Temporal profile of neuronal injury following pilocarpine or kainic acid‐induced status epilepticus. Epilepsy Research, 39, 133‐152. [DOI] [PubMed] [Google Scholar]
- Curia, G. , Longo, D. , Biagini, G. , Jones, R. S. , & Avoli, M. (2008). The pilocarpine model of temporal lobe epilepsy. Journal of Neuroscience Methods, 172, 143‐157. [DOI] [PMC free article] [PubMed] [Google Scholar]
- Decressac, M. , & Barker, R. A. (2012). Neuropeptide Y and its role in CNS disease and repair. Experimental Neurology, 238, 265‐272. [DOI] [PubMed] [Google Scholar]
- DeFelipe, J. (1999). Chandelier cells and epilepsy. Brain, 122, 1807‐1822. [DOI] [PubMed] [Google Scholar]
- de Quidt, M. E. , & Emson, P. C. (1986). Distribution of neuropeptide Y‐like immunoreactivity in the rat central nervous system–II. Immunohistochemical analysis. Neuroscience, 18, 545‐618. [DOI] [PubMed] [Google Scholar]
- Deukmedjian, A. J. , King, M. A. , Cuda, C. , & Roper, S. N. (2004). The GABAergic system of the developing neocortex has a reduced capacity to recover from in utero injury in experimental cortical dysplasia. Journal of Neuropathology and Experimental Neurology, 12, 1265‐1273. [DOI] [PubMed] [Google Scholar]
- Dobolyi, A. , Kékesi, K. A. , Juhász, G. , Székely, A. D. , Lovas, G. , & Kovács, Z. (2014). Neuropeptides in epilepsy. Current Medicinal Chemistry, 21, 1‐24. [DOI] [PubMed] [Google Scholar]
- Druga, R. (2009). Neocortical inhibitory system. Folia Biologica (Praha), 55, 201‐217. [PubMed] [Google Scholar]
- Fairén, A. , Cobas, A. , & Fonseca, M. (1986). Times of generation of glutamic acid decarboxylase immunoreactive neurons in mouse somatosensory cortex. Journal of Comparative Neurology, 251, 67‐83. [DOI] [PubMed] [Google Scholar]
- Fairless, R. , Williams, S. K. , & Diem, R. (2019). Calcium‐binding proteins as determinants of central nervous system neuronal vulnerability to disease. International Journal of Molecular Sciences, 20, E2146. [DOI] [PMC free article] [PubMed] [Google Scholar]
- Fazzari, P. , Mortimer, N. , Yabut, O. , Vogt, D. , & Pla, R. (2020). Cortical distribution of GABAergic interneurons is determined by migration time and brain size. Development (Cambridge, England), 147, dev185033. [DOI] [PMC free article] [PubMed] [Google Scholar]
- Feldmeyer, D. , Qi, G. , Emmenegger, V. , & Staiger, J. , & F. (2018). Inhibitory interneurons and their circuit motifs in the many layers of the barrel cortex. Neuroscience, 368, 132‐151. 10.1016/j.neuroscience.2017.05.027 [DOI] [PubMed] [Google Scholar]
- Filice, F. , Vorckel, K. J. , Sungur, A. O. , Wöhr, M. , & Schwaller, B. (2016). Reduction in parvalbumin expression not loss of the parvalbumin‐expressing GABA interneuron subpopulation in genetic parvalbumin and shank mouse models of autism. Molecular Brain, 9, 1‐17. 10.1186/s13041-016-0192-8 [DOI] [PMC free article] [PubMed] [Google Scholar]
- Fujisawa, S. , & Buzsáki, G. (2011). A 4 Hz oscillation adaptively synchronizes prefrontal, VTA, and hippocampal activities. Neuron, 72, 153‐165. [DOI] [PMC free article] [PubMed] [Google Scholar]
- Gall, D. , Roussel, C. , Susa, I. , D'Angelo, E. , Rossi, P. , Bearzatto, R. P. , Galas, M. C. , Blum, D. , Schurmans, S. , & Schiffmann, S. N. (2003). Altered neuronal excitability in cerebellar granule cells of mice lacking calretinin. Journal of Neuroscience, 23, 9320‐9327. [DOI] [PMC free article] [PubMed] [Google Scholar]
- Gelman, D. M. , Marin, O. , & Rubenstein, L. R. (2012). The generation of cortical interneurons. In Jasper's basic mechanisms of the epilepsies (4th edn., pp. 1171–1186). Bethesda: National Center for Biotechnology Information (US). ISBN‐13: 978‐0199746545. [PubMed] [Google Scholar]
- Hsieh, T.‐H. , Lee, H. H. C. , Hameed, M. Q. , Pascual‐Leone, A. , Hensch, T. K. , & Rotenberg, A. (2017). Trajectory of parvalbumin cell impairment and loss of cortical inhibition in traumatic brain injury. Cerebral Cortex, 27(12), 5509‐5524. 10.1093/cercor/bhw318 [DOI] [PMC free article] [PubMed] [Google Scholar]
- Hu, J. S. , Vogt, D. , Sandberg, M. , & Rubenstein, J. L. (2017). Cortical interneuron development a tale of time and space. Development (Cambridge, England), 144, 3867‐3878. [DOI] [PMC free article] [PubMed] [Google Scholar]
- Inouye, M. , Hayasaka, S. , Sun, X. Z. , & Yamamura, H. (1993). Disturbance of neuronal migration in mouse cerebral cortex by low‐dose gamma‐radiation. Journal of Radiation Research, 34, 204‐213. [DOI] [PubMed] [Google Scholar]
- Jensen, K. F. , & Killackey, H. P. (1984). Subcortical projections from ectopic neocortical neurons. Proceedings of National Acadademy of Science USA, 81, 964‐968. [DOI] [PMC free article] [PubMed] [Google Scholar]
- Jing, W. , Wang, Y. , Fang, G. , Chen, M. , Xue, M. , Guo, D. , Yao, D. , & Xia, Y. (2016). EEG bands of wakeful rest, slow‐wave and rapid‐eye‐movement sleep at different brain areas in rats. Frontiers in Computational Neuroscience, 10, 79. [DOI] [PMC free article] [PubMed] [Google Scholar]
- Kawaguchi, Y. , Otsuka, T. , Morishima, M. , Ushimaru, M. , & Kubota, Y. (2019). Control of excitatory hierarchical circuits by parvalbumin‐FS basket cells in layer 5 of the frontal cortex: Insights for cortical oscillations. Journal of Neurophysiology, 121, 2222‐2236. [DOI] [PMC free article] [PubMed] [Google Scholar]
- Kellinghaus, C. , Kunieda, T. , Ying, Z. , Pan, A. , Lüders, H. O. , & Najm, I. M. (2004). Severity of histopathologic abnormalities and in vivo epileptogenicity in the in utero radiation model of rats is dose dependent. Epilepsia, 45, 583‐591. [DOI] [PubMed] [Google Scholar]
- Kielbinski, M. , Setkowicz, Z. , Gzielo, K. , Węglarz, W. , & Janeczko, K. (2018). Altered electroencephalography spectral profiles in rats with different patterns of experimental brain dysplasia. Birth Defects Research, 110, 303‐316. [DOI] [PubMed] [Google Scholar]
- Kondo, S. , Najm, I. , Kunieda, T. , Perryman, S. , Yacubova, K. , & Lüders, H. O. (2001). Electroencephalographic characterization of an adult rat model of radiation‐induced cortical dysplasia. Epilepsia, 42, 1221‐1227. [DOI] [PubMed] [Google Scholar]
- Kubota, Y. , Shigematsu, N. , Karube, F. , Sekigawa, A. , Kato, S. , Yamaguchi, N. , Hirai, Y. , Morishima, M. , & Kawaguchi, Y. (2011). Selective coexpression of multiple chemical markers defines discrete populations of neocortical GABAergic neurons. Cerebral Cortex, 21, 1803‐1817. 10.1093/cercor/bhq252 [DOI] [PubMed] [Google Scholar]
- Kuchukhidze, G. , Koppelstaetter, F. , Unterberger, I. , Dobesberger, J. , Walser, G. , Höfler, J. , Zamarian, L. , Haberlandt, E. , Rostasy, K. , Ortler, M. , Czech, T. , Feucht, M. , Bauer, G. , Delazer, M. , Felber, S. , & Trinka, E. (2013). Midbrain‐hindbrain malformations in patients with malformations of cortical development and epilepsy: A series of 220 patients. Epilepsy Research, 106, 181‐190. [DOI] [PMC free article] [PubMed] [Google Scholar]
- Luhmann, H. J. (2015). Models of cortical malformation‐chemical and physical. Journal of Neuroscience Methods, 260, 62‐72. 10.1016/j.jneumeth.2015.03.034 [DOI] [PubMed] [Google Scholar]
- Machin, D. , Campbell, M. , Fayers, P. , & Pinol, A. (2009). Sample size tables for clinical studies (3rd edn.). Oxford Singapore: Wiley‐Blackwell. ISBN 978‐1‐4051‐4650‐0. [Google Scholar]
- MacMullin, P. , Hodgson, N. , Damar, U. , Lee, H. H. C. , Hameed, M. Q. , Dhamne, S. C. , Hyde, D. , Conley, G. M. , Morriss, N. , Qiu, J. , Mannix, R. , Hensch, T. K. , & Rotenberg, A. (2020). Increase in seizure susceptibility after repetitive concussion results from oxidative stress, parvalbumin‐positive interneuron dysfunction and biphasic Increases in glutamate/GABA Ratio. Cerebral Cortex, 30, 6108‐6120. [DOI] [PMC free article] [PubMed] [Google Scholar]
- Mann, E. O. , & Paulsen, O. (2007). Role of GABAergic inhibition in hippocampal network oscillations. Trends in Neuroscience, 30, 343‐349. [DOI] [PubMed] [Google Scholar]
- Marx, M. , Haas, C. A. , & Haussler, U. (2013). Differential vulnerability of interneurons in the epileptic hippocampus. Frontiers in Cellular Neuroscience, 7, 167. 10.3389/fncel.2013.00167 [DOI] [PMC free article] [PubMed] [Google Scholar]
- Marksteiner, J. , Sperk, G. , & Maas, D. (1989). Differential increases in brain levels of neuropeptide Y and vasoactive intestinal polypeptide after kainic acid‐induced seizures in the rat. Naunyn‐Schmiedeberg's Archives of Pharmacology, 339, 173‐177. [DOI] [PubMed] [Google Scholar]
- Miyoshi, G. , Butt, S. J. B. , Takebayashi, H. , & Fishell, G. (2007). Physiologically distinct temporal cohorts of cortical interneurons arise from telencephalic Olig2‐expressing precursors. Journal of Neuroscience, 27, 7786‐7798. [DOI] [PMC free article] [PubMed] [Google Scholar]
- Miyoshi, G. , & Fishell, G. (2011). GABAergic interneuron lineages selectively sort into specific cortical layers during early postnatal development. Cerebral Cortex, 21, 845‐852. [DOI] [PMC free article] [PubMed] [Google Scholar]
- Moroni, R. F. , Inverardi, F. , Regondi, M. C. , Panzica, F. , Spreafico, R. , & Frassoni, C. (2008). Altered spatial distribution of PV‐cortical cells and dysmorphic neurons in the somatosensory cortex of BCNU‐treated rat model of cortical dysplasia. Epilepsia, 49, 872‐887. [DOI] [PubMed] [Google Scholar]
- Neske, G. T. , Patrick, S. L. , & Connors, B. W. (2015). Contributions of diverse excitatory and inhibitory neurons to recurrent network activity in cerebral cortex. Journal of Neuroscience, 35(3), 1089‐1105. 10.1523/jneurosci.2279-14.2015 [DOI] [PMC free article] [PubMed] [Google Scholar]
- Neske, G. T. , & Connors, B. W. (2016). Synchronized gamma‐frequency inhibition in neocortex depends on excitatory‐inhibitory interactions but not electrical synapses. Journal of Neurophysiology, 116, 351‐368. [DOI] [PMC free article] [PubMed] [Google Scholar]
- Orzeł‐Gryglewska, J. , Matulewicz, P. , & Jurkowlaniec, E. (2015). Brainstem system of hippocampal theta induction: The role of the ventral tegmental area. Synapse, 69, 553‐575. [DOI] [PubMed] [Google Scholar]
- Papp, P. , Kovács, Z. , Szocsics, P. , Juhász, G. , & Maglóczky, Z. (2018). Alterations in hippocampal and cortical densities of functionally different interneurons in rat models of absence epilepsy. Epilepsy Research, 145, 40‐50. [DOI] [PubMed] [Google Scholar]
- Paxinos, G. , & Watson, C. (1998). The rat brain in stereotaxic coordinates (2nd edn.). London, San Diego: Academic Press, Inc. ISBN 0‐12‐547617‐5. [Google Scholar]
- Pfeffer, C. K. , Xue, M. , He, M. , Huang, Z. J. , & Scanziani, M. (2013). Inhibition of inhibition in visual cortex: The logic of connections between molecularly distinct interneurons. Nature Neuroscience, 16, 1068‐1076. [DOI] [PMC free article] [PubMed] [Google Scholar]
- Pignatelli, M. , Beyeler, A. , & Leinekugel, X. (2012). Neural circuits underlying the generation of theta oscillations. Journal of Physiology–Paris, 106, 81‐92. [DOI] [PubMed] [Google Scholar]
- Rankin‐Gee, E. K. , McRae, P. A. , Baranov, E. , Rogers, S. , Wandrey, L. , & Porter, B. E. (2015). Perineuronal net degradation in epilepsy. Epilepsia, 56, 1124‐1133. [DOI] [PubMed] [Google Scholar]
- Roper, S. N. , Eisenschenk, S. , & King, M. A. (1999). Reduced density of parvalbumin‐ and calbindin D28‐immunoreactive neurons in experimental cortical dysplasia. Epilepsy Research, 37, 63‐71. [DOI] [PubMed] [Google Scholar]
- Rymar, V. V. , & Sadikot, A. F. (2007). Laminar fate of cortical GABAergic interneurons is dependent on both birthdate and phenotype. Journal of Comparative Neurology, 501, 369‐380. 10.1002/cne.21250 [DOI] [PubMed] [Google Scholar]
- Rudy, B. , Fishell, G. , Lee, S. , & Hjerling‐Leffler, J. (2011). Three groups of interneurons account for nearly 100% of neocortical GABAergic neurons. Developmental Neurobiology, 71, 45‐61. [DOI] [PMC free article] [PubMed] [Google Scholar]
- Saito, S. , Sawada, K. , Hirose, M. , Mori, Y. , Yoshioka, Y. , & Murase, K. (2014). Diffusion tensor imaging of brain abnormalities induced by prenatal exposure to radiation in rodents. Plos One, 9, e107368. [DOI] [PMC free article] [PubMed] [Google Scholar]
- Schwaller, B. , Tetko, I. V. , Tandon, P. , Silveira, D. C. , Vreugdenhil, M. , Henzi, T. , Potier, M. C. , Celio, M. R. , & Villa, A. E. (2004). Parvalbumin deficiency affects network properties resulting in increased susceptibility to epileptic seizures. Molecular and Cellular Neuroscience, 25, 650‐663. [DOI] [PubMed] [Google Scholar]
- Setkowicz, Z. , Gzieło‐Jurek, K. , Uram, Ł. , Janicka, D. , & Janeczko, K. (2014). Brain dysplasia evoked by gamma irradiation at different stages of prenatal development leads to different tonic and clonic seizure reactivity. Epilepsy Research, 108, 66‐80. [DOI] [PubMed] [Google Scholar]
- Setkowicz, Z. , & Janeczko, K. (2003). Long‐term changes in susceptibility to pilocarpine‐induced status epilepticus following neocortical injuries in the rat at different developmental stages. Epilepsy Research, 53, 216‐224. [DOI] [PubMed] [Google Scholar]
- Setkowicz, Z. , & Janeczko, K. (2005). A strong epileptogenic effect of mechanical injury can be reduced in the dysplastic rat brain. Long‐term consequences of early prenatal gamma‐irradiation. Epilepsy Research, 66, 165‐172. [DOI] [PubMed] [Google Scholar]
- Setkowicz, Z. , Janicka, D. , Kowalczyk, A. , Turlej, A. , & Janeczko, K. (2005). Congenital brain dysplasias of different genesis can differently affect susceptibility to pilocarpine‐ or kainic acid‐induced seizures in the rat. Epilepsy Research, 67, 123‐131. [DOI] [PubMed] [Google Scholar]
- Setkowicz, Z. , Klak, K. , & Janeczko, K. (2003). Long‐term changes in postnatal susceptibility to pilocarpine‐induced seizures in rats exposed to gamma radiation at different stages of prenatal development. Epilepsia, 44, 1267‐1273. 10.1046/j.1528-1157.2003.08203.x [DOI] [PubMed] [Google Scholar]
- Setkowicz, Z. , Majcher, K. , Janicka, D. , Sułek, Z. , Skórka, T. , Jasiński, A. , & Janeczko, K. (2006). Brains with different degrees of dysplasia show different patterns of neurodegenerative changes following pilocarpine‐induced seizures. Histological evidence of tissue damage correlated with MRI data. Neurological Research, 28, 453‐460. 10.1179/016164106X115062 [DOI] [PubMed] [Google Scholar]
- Setkowicz, Z. , Kiełbinski, M. , Gzieło, K. , Węglarz, W. , & Janeczko, K. (2020). Changes of EEG spectra in rat brains with different patterns of dysplasia in response to pilocarpine‐induced seizures. Epilepsy and Behavior, 111, 107288. [DOI] [PubMed] [Google Scholar]
- Sohal, V. S. , Zhang, F. , Yizhar, O. , & Deisseroth, K. (2009). Parvalbumin neurons and gamma rhythms enhance cortical circuit performance. Nature, 459, 698‐702. [DOI] [PMC free article] [PubMed] [Google Scholar]
- Sun, X. Z. , Takahashi, S. , Fukui, Y. , Hisano, S. , Kuboda, Y. , Sato, H. , & Inouye, M. (1999). Different patterns of abnormal neuronal migration in the cerebral cortex of mice prenatally exposed to irradiation. Brain Research, Developmental Brain Research, 114, 99‐108. [DOI] [PubMed] [Google Scholar]
- Taniguchi, H. , Lu, J. , & Huang, Z. J. (2013). The spatial and temporal origin of chandelier cells in mouse neocortex. Science, 339, 70‐74. [DOI] [PMC free article] [PubMed] [Google Scholar]
- Tewari, B. P. , Chaunsali, L. , Campbell, S. L. , Patel, D. C. , Goode, A. E. , & Sontheimer, H. (2018). Perineuronal nets decrease membrane capacitance of peritumoral fast spiking interneurons in a model of epilepsy. Nature Communications, 9, 4724. [DOI] [PMC free article] [PubMed] [Google Scholar]
- Toth, K. , & Magloczky, Z. (2014). The vulnerability of calretinin‐containing hippocampal interneurons to temporal lobe epilepsy. Frontiers in Neuroanatomy, 8, 100. 10.3389/fnana.2014.00100 [DOI] [PMC free article] [PubMed] [Google Scholar]
- Tremblay, R. , Lee, S. , & Rudy, B. (2016). GABAergic interneurons in the neocortex: From cellular properties to circuits. Neuron, 91, 260‐292. [DOI] [PMC free article] [PubMed] [Google Scholar]
- Tschuluun, N. , Jürgen Wenzel, H. , Doisy, E. T. , & Schwartzkroin, P. A. (2011). Initiation of epileptiform activity in a rat model of periventricular nodular heterotopia. Epilepsia, 52, 2304‐2314. [DOI] [PMC free article] [PubMed] [Google Scholar]
- Turski, W. A. , Cavalheiro, E. A. , Schwarz, M. , Czuczwar, S. J. , Kleinrok, Z. , & Turski, L. (1983). Limbic seizures produced by pilocarpine in rats: Behavioural, electroencephalographic and neuropathological study. Behavioral Brain Research, 9, 315‐335. [DOI] [PubMed] [Google Scholar]
- Van Raay, L. , Jovanovska, V. , Morris, M. J. , & O'Brien, T. J. (2012). Focal administration of neuropeptide Y into the S2 somatosensory cortex maximally suppresses absence seizures in a genetic rat model. Epilepsia, 53, 477‐484. [DOI] [PubMed] [Google Scholar]
- Verreet, T. , Verslegers, M. , Quintens, R. , Baatout, S. , & Benotmane, M. A. (2016). Current evidence for developmental, structural, and functional brain defects following prenatal radiation exposure. Neural Plasticity, 2016, 1243527. [DOI] [PMC free article] [PubMed] [Google Scholar]
- Vezzani, A. , & Sperk, G. (2004) Overexpression of NPY and Y2 receptors in epileptic brain tissue: An endogenous neuroprotective mechanism in temporal lobe epilepsy? Neuropeptides, 38, 245‐252, [DOI] [PubMed] [Google Scholar]
- Wahlestedt, C. , Blendy, J. A. , Kellar, K. J. , Heilig, M. , Widerlöv, E. , & Ekman, R. (1990). Electroconvulsive shocks increase the concentration of neocortical and hippocampal neuropeptide Y (NPY)‐like immunoreactivity in the rat. Brain Research, 507, 65‐68. [DOI] [PubMed] [Google Scholar]
- West, M. J. , & Gundersen, H. J. G. (1990). Unbiased stereological estimation of the number of neurons in the human hippocampus. Journal of Comparative Neurology, 296, 1‐22. 10.1002/cne.902960102 [DOI] [PubMed] [Google Scholar]
- Whittington, M. A. , Cunningham, M. O. , LeBeau, F. E. , Racca, C. , & Traub, R. D. (2011). Multiple origins of the cortical? rhythm. Developmental Neurobiology, 71, 92‐106. 10.1002/dneu.20814 [DOI] [PubMed] [Google Scholar]
- Xapelli, S. , Silva, A. P. , Ferreira, R. , & Malva, J. O. (2007). Neuropeptide Y can rescue neurons from cell death following the application of an excitotoxic insult with kainate in rat organotypic hippocampal slice cultures. Peptides, 28, 288‐294. [DOI] [PubMed] [Google Scholar]
- Zamecnik, J. , Krsek, P. , Druga, R. , Marusic, P. , Benes, V. , Tichy, M. , & Komarek, V. (2006). Densities of parvalbumin‐immunoreactive neurons in non‐malformed hippocampal sclerosis‐temporal neocortex and in cortical dysplasias. Brain Research Bulletin, 68, 474‐481. [DOI] [PubMed] [Google Scholar]
- Zhou, F. W. , & Roper, S. N. (2010a). Densities of glutamatergic and GABAergic presynaptic terminals are altered in experimental cortical dysplasia. Epilepsia, 51, 1468‐1476. 10.1111/j.1528-1167.2010.02583.x [DOI] [PubMed] [Google Scholar]
- Zhou, F. W. , & Roper, S. N. (2010b). Altered firing rates and patterns in interneurons in experimental cortical dysplasia. Cerebral Cortex, 21, 1645‐1658. 10.1093/cercor/bhq234 [DOI] [PubMed] [Google Scholar]
Associated Data
This section collects any data citations, data availability statements, or supplementary materials included in this article.
Data Availability Statement
The data that support the findings of this study are available from the corresponding author upon reasonable request.