

Abstract
Global longitudinal strain and circumferential strain are found to be reduced in HFpEF, which some have interpreted that the global left ventricular (LV) contractility is impaired. This finding is, however, contradicted by a preserved ejection fraction (EF) and confounded by changes in LV geometry and afterload resistance that may also affect the global strains. To reconcile these issues, we used a validated computational framework consisting of a finite element LV model to isolate the effects of HFpEF features in affecting systolic function metrics. Simulations were performed to quantify the effects on myocardial strains due to changes in LV geometry, active tension developed by the tissue, and afterload. We found that only a reduction in myocardial contractility and an increase in afterload can simultaneously reproduce the blood pressures, EF and strains measured in HFpEF patients. This finding suggests that it is likely that the myocardial contractility is reduced in HFpEF patients.
Keywords: HFpEF, Global longitudinal strain, Myocardial contractility, Finite element modeling
Introduction
Heart failure with preserved ejection fraction (HFpEF) is a syndrome accounting for about one-half of all chronic heart failure (HF) patients [1, 2]. The incidence and prevalence of HFpEF are increasing at a rate of about 1%/year [2, 3], with mortality rates comparable to HF with reduced ejection fraction (HFrEF) [2, 4, 5]. Compared to HFrEF, patients diagnosed with HFpEF are older and have a higher prevalence rate of hypertension [2]. While new therapies have been proposed [6–10], no proven treatment option currently exists for HFpEF patients [11, 12].
Because of the presence of many pathological features impairing LV filling [13] (e.g., slow LV relaxation [14], cardiomyocyte stiffening [14], concentric hypertrophy [15]), diastolic dysfunction was initially believed to be the sole mechanism underlying HFpEF, which was previously referred to as diastolic HF [3, 16]. Mounting evidence, however, has suggested that myocardial contractility in HFpEF patients may also be impaired, thus calling into question the original notion that systolic myocardial function is preserved in this syndrome [17–20]. However, seemingly contradictory observations have been challenging to reconcile and are unable to resolve the question of myocardial contractility in HFpEF. On the one hand, studies have shown that LV ejection fraction (EF) is normal or increased in HFpEF (suggesting preserved or increased global ventricular contractility) [21, 22]. On the other hand, these hearts exhibit decreased global longitudinal strain (Ell) and circumferential strain (Ecc) [17] suggesting decreased myocardial contractility.
These seemingly conflicting observations (preserved chamber contractility but decreased myocardial deformation) are difficult to resolve purely through basic or clinical experimental studies. This difficulty arises because of the differing influences of increased vascular resistance (afterload), altered LV geometry and increased LV mass (all encountered in HFpEF patients) on longitudinal strain, which potentially confound the link between longitudinal and circumferential strains, as well as myocardial contractility.
Computational modeling has the inherent advantage to isolate factors affecting LV function and motion in HFpEF patients so as to clarify their individual role(s) and contribution(s). There are, however, only a few prior studies that have explored the use of computational modeling to understand ventricular mechanics in HFpEF [23–26]. However, the seemingly conflicting observations and multiple confounding factors as described above, to the best of our knowledge, have not been resolved in any of those studies.
Accordingly, the purpose of this study was to determine whether decreased longitudinal and circumferential strains encountered in HFpEF is truly a reflection of decreased myocardial contractility or is this simply due to the combined effects of altered LV mass, geometry and/or afterload resistance. To do so, we employed a computational modeling framework whose parameters were adjusted to replicate key characteristics of heart and vascular properties in HFpEF. Resolution of this question is important because of its implication for advancing understanding of HFpEF, which may also help guide the development of new therapies.
Methods
Computational Modeling Framework
A coupled left ventricle (LV)–closed-loop circulatory computational modeling framework (Fig. 1a) was used to simulate the hemodynamics and ventricular mechanics of HFpEF [27, 28]. In this framework, the LV was modeled using the finite element (FE) method with a realistic 3D ventricular geometry to simulate a beating LV. The mechanical behavior of the LV was described by an active stress formulation.
Fig. 1.
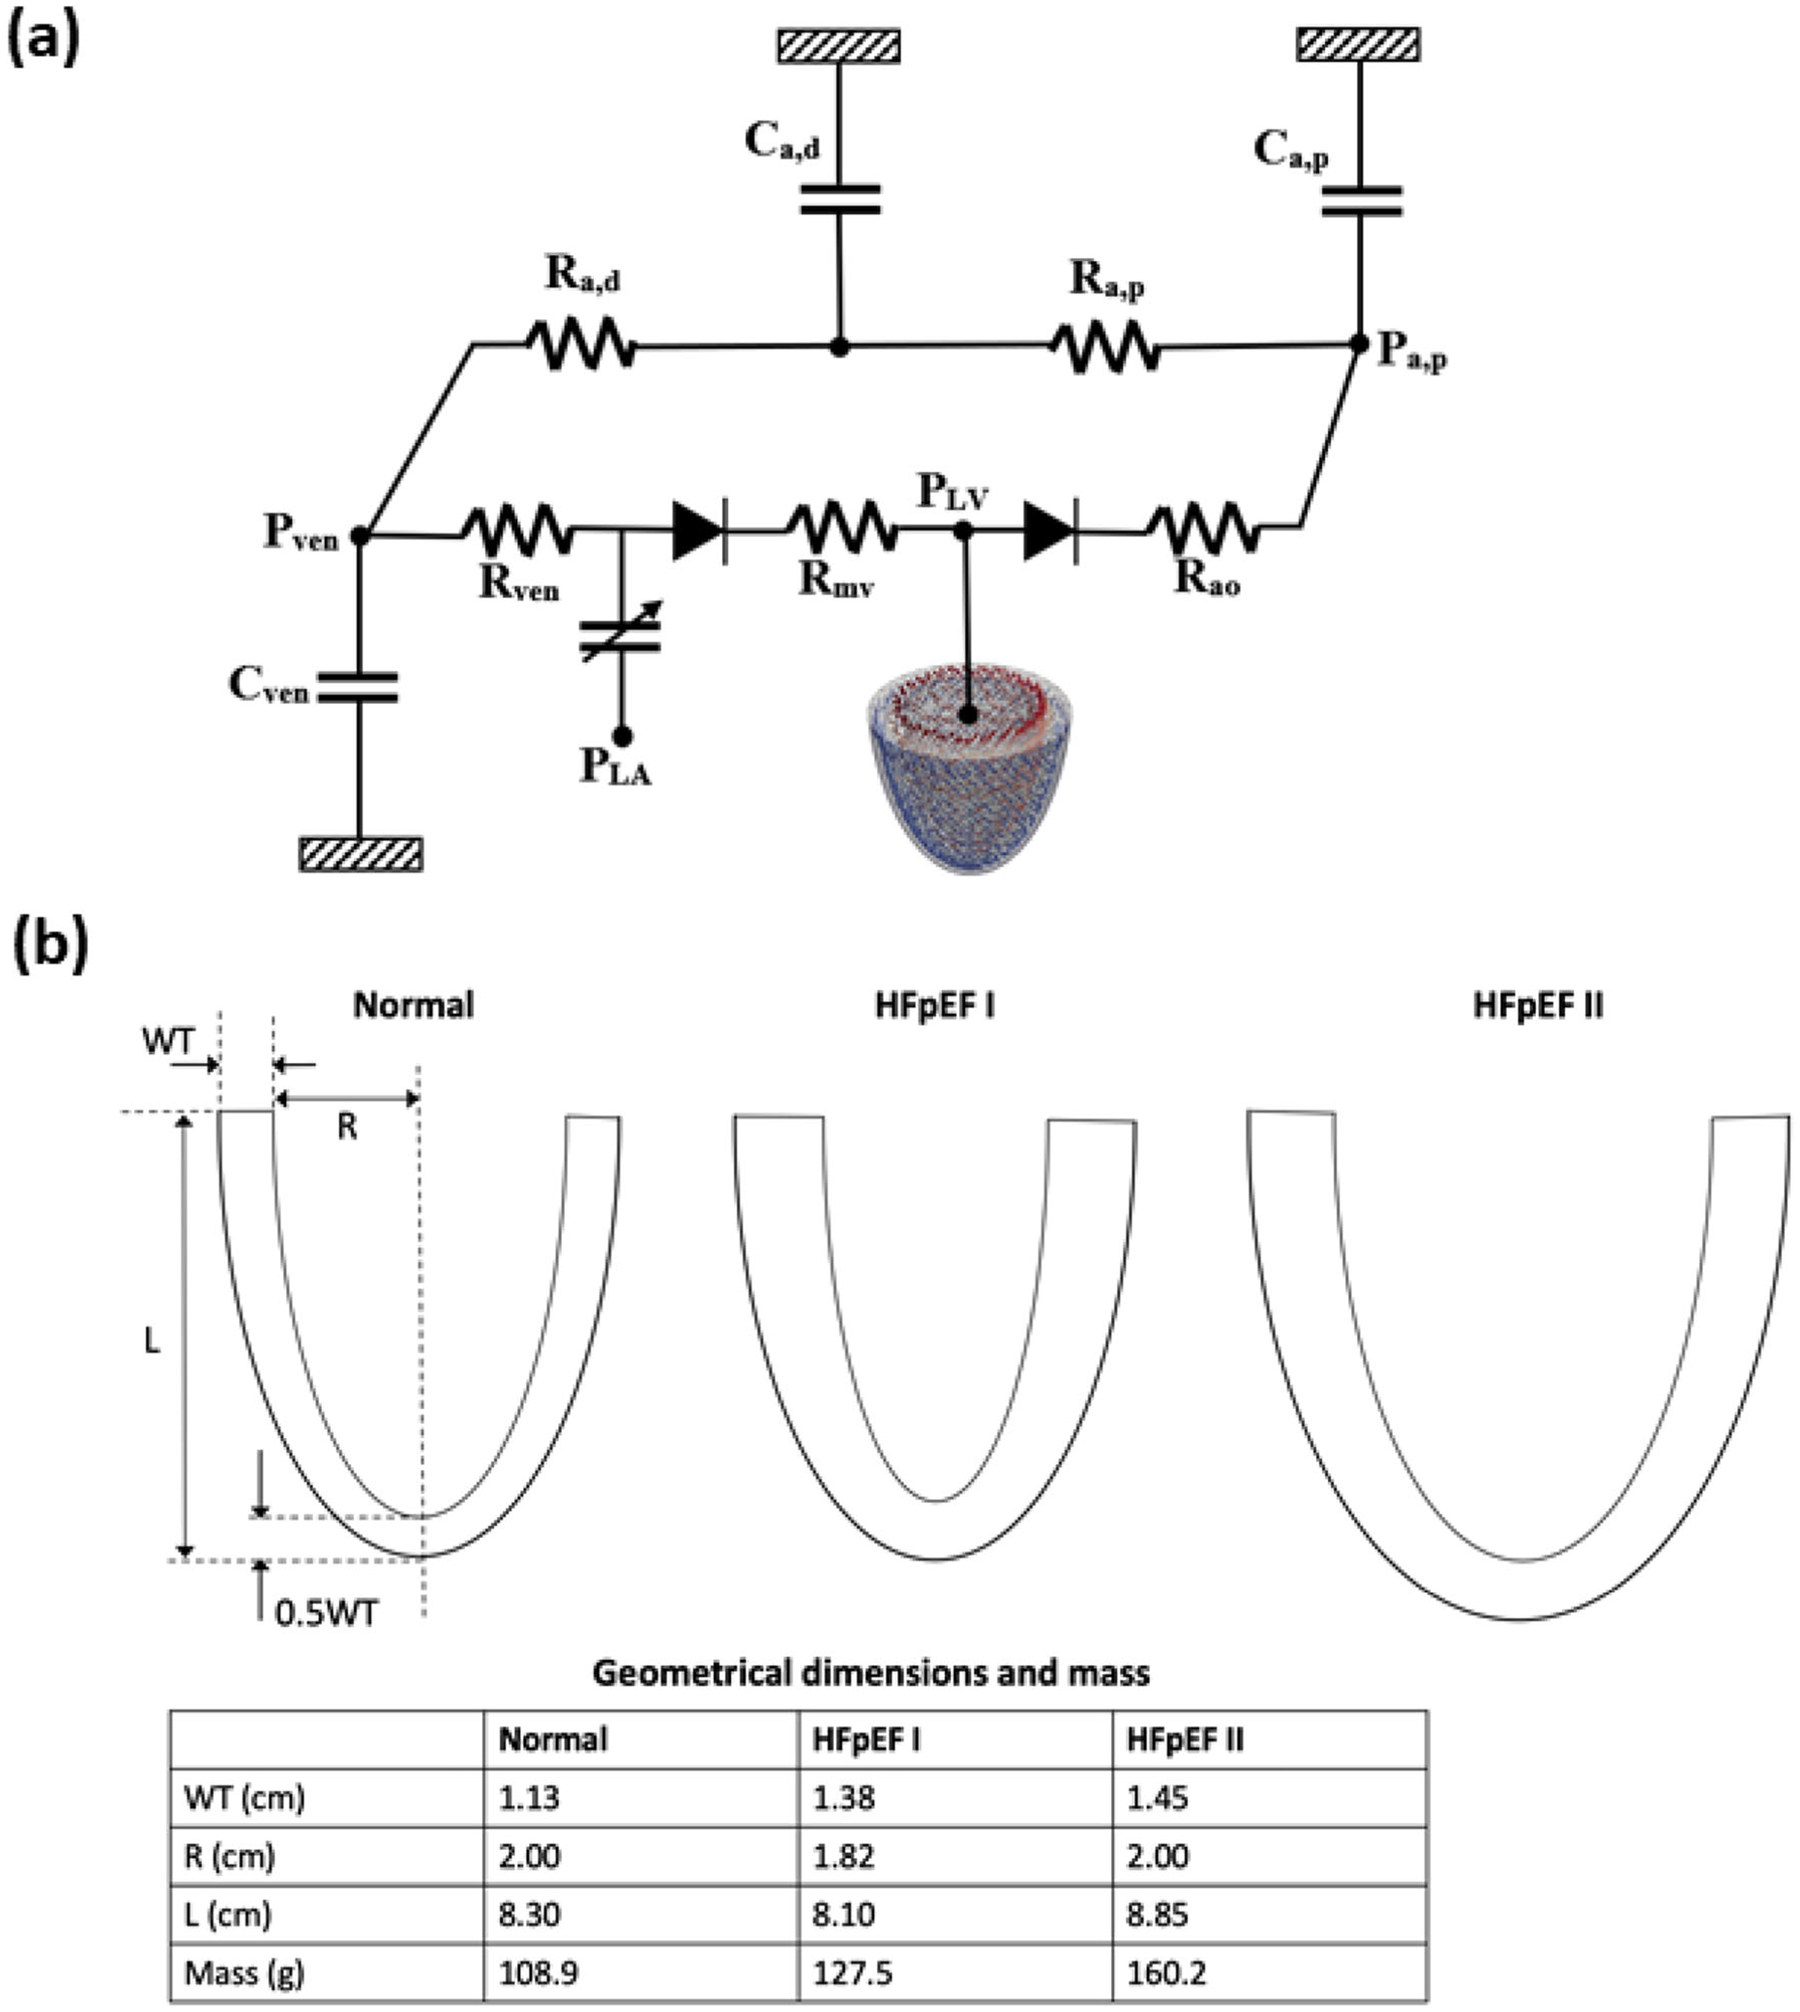
a Schematic of the computational framework showing the LV FE model coupled to a closed loop lumped parameter circulatory model. b LV geometries of normal, HFpEF I, and HFpEF II
In this formulation, the active force developed along the local myofiber direction was calculated using a modified time-varying elastance model that takes into account length-dependency of the muscle fiber [29], whereas the passive mechanical behavior was described using a Fung-type transversely isotropic hyperelastic constitutive model [30]. The LV FE model was coupled to closed-loop lumped parameter circulatory model describing the systemic circulation. The circuit consists of proximal and distal arterial and venous compliances (Ca, p, Ca, d and Cven) and resistances (Ra, p, Ra, d and Rven), mitral and aortic valves (with resistances Rao and Rmv) and left atrium (LA). Contraction of the LA was described using a time-varying elastance function. Details of the governing equations for the computational modeling framework are given in Appendix A. These governing equations were solved using the finite element method with the open-source library FEniCS [31]. The number of quadratic elements used is 1049, which has been shown is sufficient for convergence [27].
Left Ventricular Geometry and Boundary Conditions
An idealized prolate ellipsoid was used to model the LV typical of that found in normal humans and HFpEF patients. Clinical studies have shown that the LV in HFpEF patients has both increased wall thickness to cavity diameter (internal dimension) ratio and apex-to-base length compared to healthy subjects [32–34]. Some studies, however, have also found that the LV cavity diameter was either not significantly different or slightly decreased (but both with thicker ventricular wall) in HFpEF patients [35, 36]. To reflect the wide spectrum of LV geometry found in HFpEF patients, we applied 2 different LV geometries in the modeling framework to simulate HFpEF, namely, one with a smaller LV cavity (HFpEF I) and one with a slightly dilated LV cavity (HFpEF II) with respect to a normal LV geometry. Both HFpEF geometries had a thicker wall and increased mass compared to that in the normal case (Fig. 1b).
The same boundary conditions as in previous computational models [28, 37, 38] were applied in all simulations for the LV model. For the normal case, the myofiber direction (helix angle) was varied transmurally across the LV wall with a linear variation from 60° at the endocardium to −60° at the epicardium based on a previous experimental measurement [39]. The relaxation time constant τ was set at 25ms, which is within the normal range [14] (Eq. (14) in Appendix).
Analysis of Strains
Global longitudinal strain Ell and circumferential strain Ecc were calculated using the method described by Shavik et al [27] with end-diastole serving as the reference configuration. Myofiber stretch in the longitudinal and circumferential directions, denoted respectively by el and ec, were first computed by
| (1) |
In the above equation, C = FTF is the right Cauchy–Green deformation tensor, F is the deformation gradient tensor, and ei with i ∈ (l, c) are the unit vectors in the longitudinal l and circumferential c directions, respectively. The circumferential direction ec was defined to be orthogonal to the radial direction and the apex to base direction. The longitudinal direction el was then defined to be orthogonal to both radial direction and ec. The strain was calculated using [27]
| (2) |
Simulation Cases
A normal case was first simulated so that the LV geometrical features at end-diastole and end-systole and hemodynamics, as well as global Ecc and Ell (waveforms and peak values), were close (within 1 standard deviation) to the values reported in control subjects in clinical HFpEF studies [17, 32, 40]. Having established the parameters for the normal case, we then applied them to the 2 HFpEF geometries in cases G1 and G2. Preload was increased in these 2 cases by adjusting the resting venous volume (Vven0) and the passive stiffness was increased (in HFpEF I geometry) so that LV end-diastolic pressure (EDP) is in the range of 18–25 mmHg found in HFpEF patients [36, 41]. The relaxation time constant τ was set at 50ms (cf. 25ms in the normal case) to reflect the larger values found in HFpEF patients [42].
Using G1 and G2 as the reference cases, we then simulated a number of cases to isolate the effects of (1) active tension developed by the tissue (i.e., myocardial contractility) and (2) ventricular afterload as indexed by arterial resistance, which are factors deemed to affect Ell in HFpEF. The effect of afterload is considered here because a majority of HFpEF patients have hypertension [43]. Active tension and afterload were changed, respectively, by scaling the active stress (Tref) and the peripheral resistance (Ra, d) so that Ell fell within the range of values measured in the clinical study [17]. Based on the insights derived from these cases, we then systematically modified the parameter values (that reflect a combination of these factors) to arrive at a combination that simultaneously fit all the conditions (volume, EF, strains, blood pressures) encountered in HFpEF patients [17]. As explained later, the myofiber direction (helix angle) also had to be slightly adjusted to simulate the HFpEF conditions. Heart rate was set constant at 75 bpm for all simulations, consistent with data reported in prior studies measured under resting conditions [17, 32]. All simulation cases are summarized with labels in Table 1 and the model parameters are given in Tables 3, 4, 5 and 6 in the Appendix.
Table 1.
Simulation cases in this study
| Geometry | Myocardial contractility | Vascular resistance | Passive myocardial stiffness | Case | Fiber angles (endo/epi) |
|---|---|---|---|---|---|
| Normal | Normal | Normal | Normal | Normal | 60/−60° |
| HFpEF I | NC | NC | ↑ 10% | G1 | 60/−60° |
| ↓ 30% | NC | ↑ 10% | G1-C1 | 60/−60° | |
| ↓ 60% | NC | ↑ 10% | G1-C2 | 60/−60° | |
| NC | ↑ 50% | ↑ 10% | G1-A1 | 60/−60° | |
| NC | ↑ 200% | ↑ 10% | G1-A2 | 60/−60° | |
| ↓ 23% | ↑ 30% | ↑ 10% | G1-C-A | 60/−60° | |
| ↓ 16% | ↑ 20% | ↑ 10% | G1-C-A-55 | 55/−55° | |
| HFpEF - II | NC | NC | NC | G2 | 60/−60° |
| ↓ 23% | NC | NC | G2-C1 | 60/−60° | |
| ↓ 46% | NC | NC | G2-C2 | 60/−60° | |
| NC | ↑ 100% | NC | G2-A1 | 60/−60° | |
| NC | ↑ 200% | NC | G2-A2 | 60/−60° | |
| ↓ 30% | NC | NC | G2-C-55 | 55/−55° | |
| ↓ 30% | NC | NC | G2-C-50 | 50/−50° |
NC, no change with respect to normal
Results
Validation of Normal Case
Model predictions for the normal case are in agreement with clinical measurements (Fig. 2). Specifically, the LV end-diastolic volume (EDV) (109ml), ejection fraction (EF) (60%) and LV wall thickness at end-diastole (EDWT) (0.8cm) are all within the normal range found in healthy humans [34, 44]. Diastolic blood pressure (DBP) (77 mmHg), systolic blood pressure (SBP) (132 mmHg), peak absolute Ecc (29%), and Ell (21%) are all close to the values found in the clinical measurements of the control in a study on HFpEF patients (EF: 61 ± 3%; DBP: 74 (68, 84) mmHg; SBP: 130 (118, 138) mmHg; Ecc: 27.1 ± 3.1%; Ell: 20 ± 2.1%) [17]. The Ecc and Ell waveforms are also in agreement with echo measurements of healthy humans [45–47] (Fig. 2c and d). Internal diameter and EDWT are also in agreement with those measured in normal humans (Table 2).
Fig. 2.
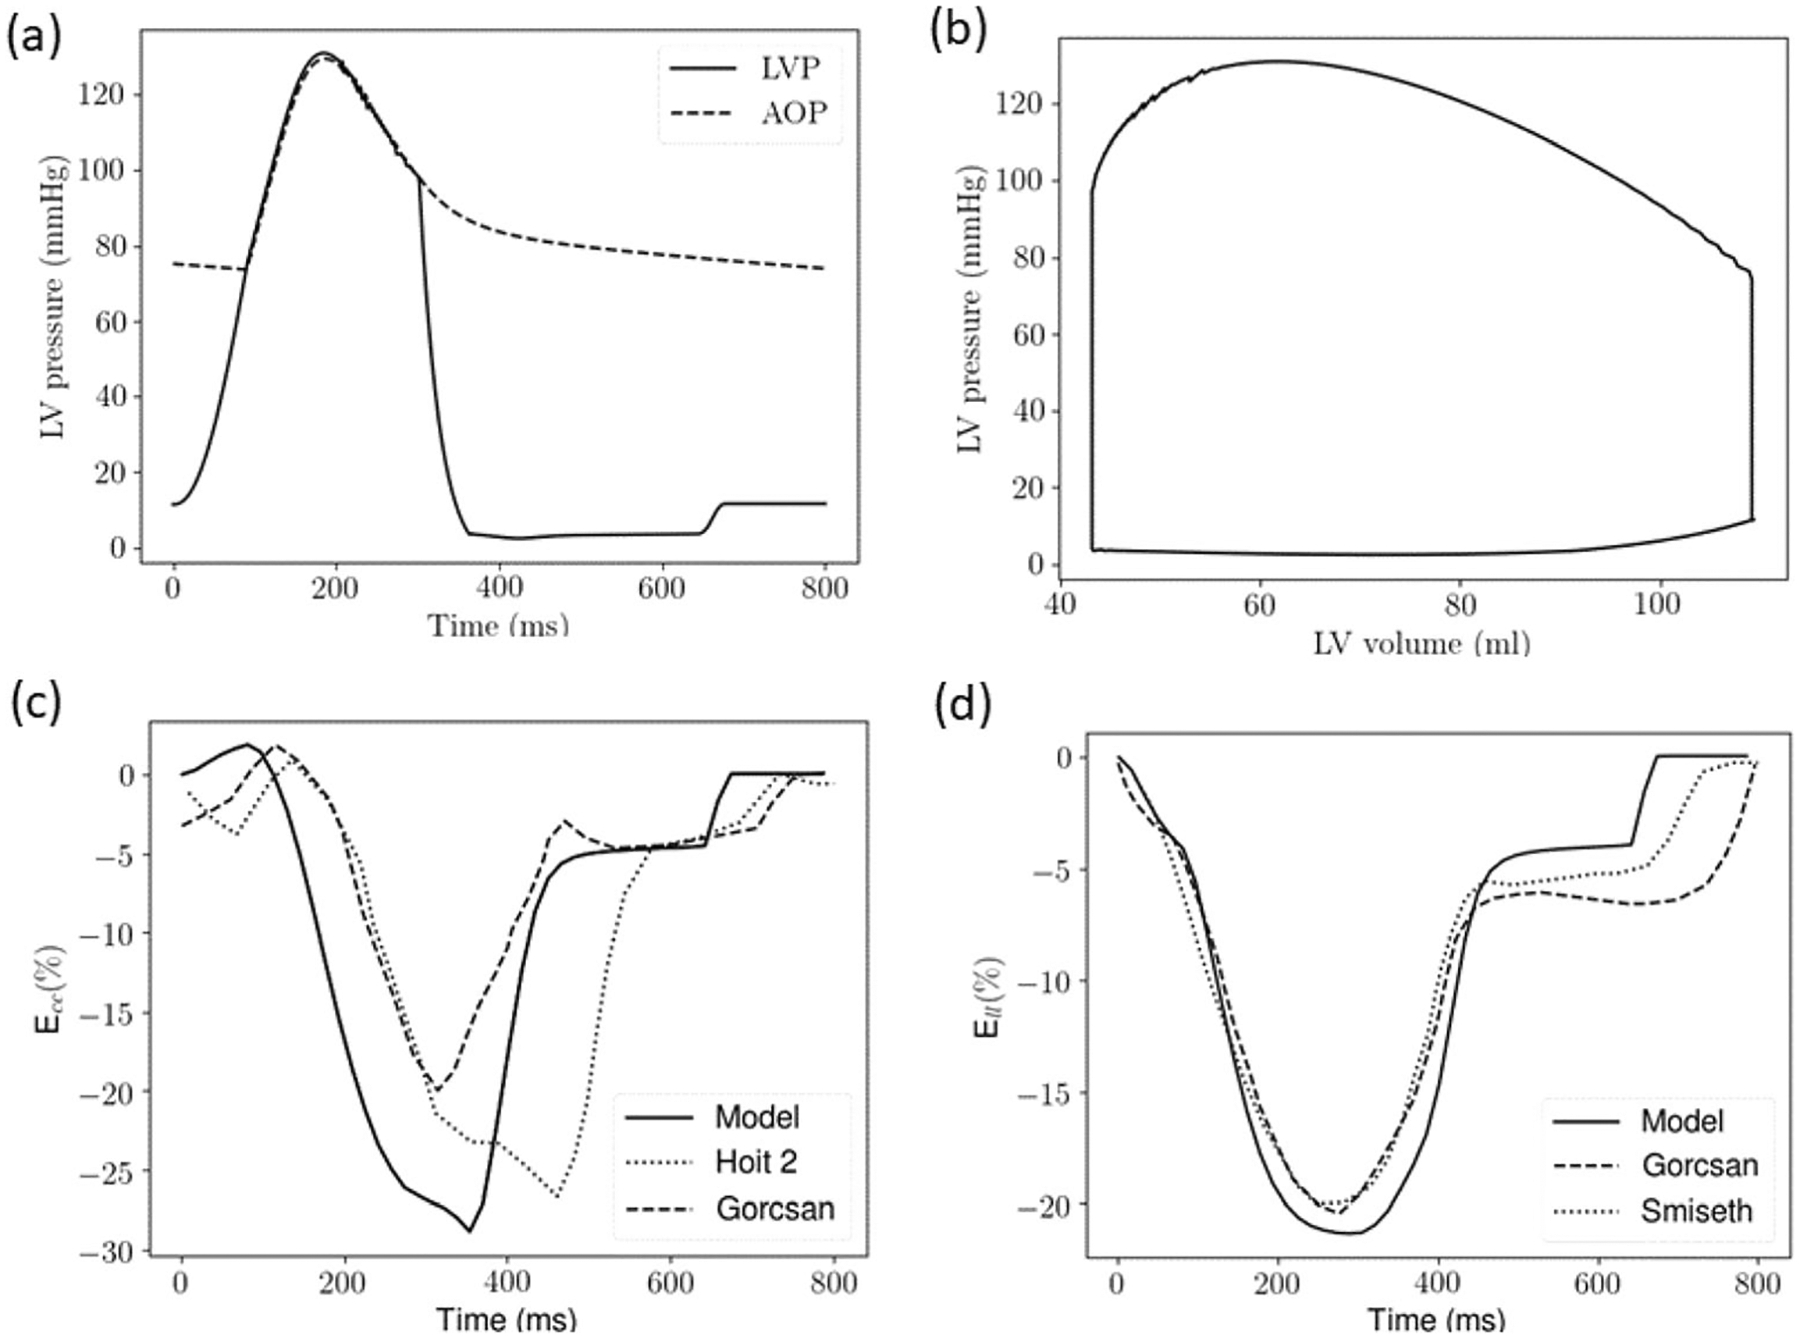
Normal case a Pressure waveforms of the LV (LVP) and proximal artery (AOP); b pressure–volume loop; c Ecc waveform compared with echo measurements (dotted [47] and dashed [45] lines); d Ell waveform compared with echo measurements (dotted [46] and dashed [45] lines)
Table 2.
Left ventricular geometry at end-diastole
| Parameter | Normal | Case G1 | Case G2 | |||
|---|---|---|---|---|---|---|
| Model | Clinical [34] | Model | Clinical [44] | Model | Clinical [34] | |
| Internal diameter (cm) | 5.0 | 4.8±0.6 | 4.7 | 4.6 (4–5) | 5.2 | 5.1±0.8 |
| Wall thickness (cm) | 0.8 | 0.8±0.1 * | 1.02 | 1.12 (1.02–1.29)* | 1.05 | 0.9±0.2* |
Posterior wall thickness
Effects of Changes in Geometry, Passive Stiffness, and Preload
Changing the LV geometry and elevation of the preload in cases G1 and G2 produced a larger LV wall thickness at ED (~1cm) and normal EF (~65%), which are within the measured range in HFpEF patients [34, 44] (Table 2, Fig. 3). Peak (absolute) Ecc was reduced to 24% in G1 and 20% in G2, which are also within the range measured in HFpEF patients [17]. Peak Ell, however, was relatively insensitive to these changes and was only slightly reduced (18.2% in G1 and 20% in G2), with values well above the measured values in HFpEF patients (~14.6%) [17]. We note that G2 (larger LV EDV) produced a higher SBP and DBP that were above the range measured in HFpEF patients. Conversely, SBP and DBP did not change substantially in G1 (smaller LV EDV). The changes associated with G1 and G2 also produced a larger EF compared to normal.
Fig. 3.
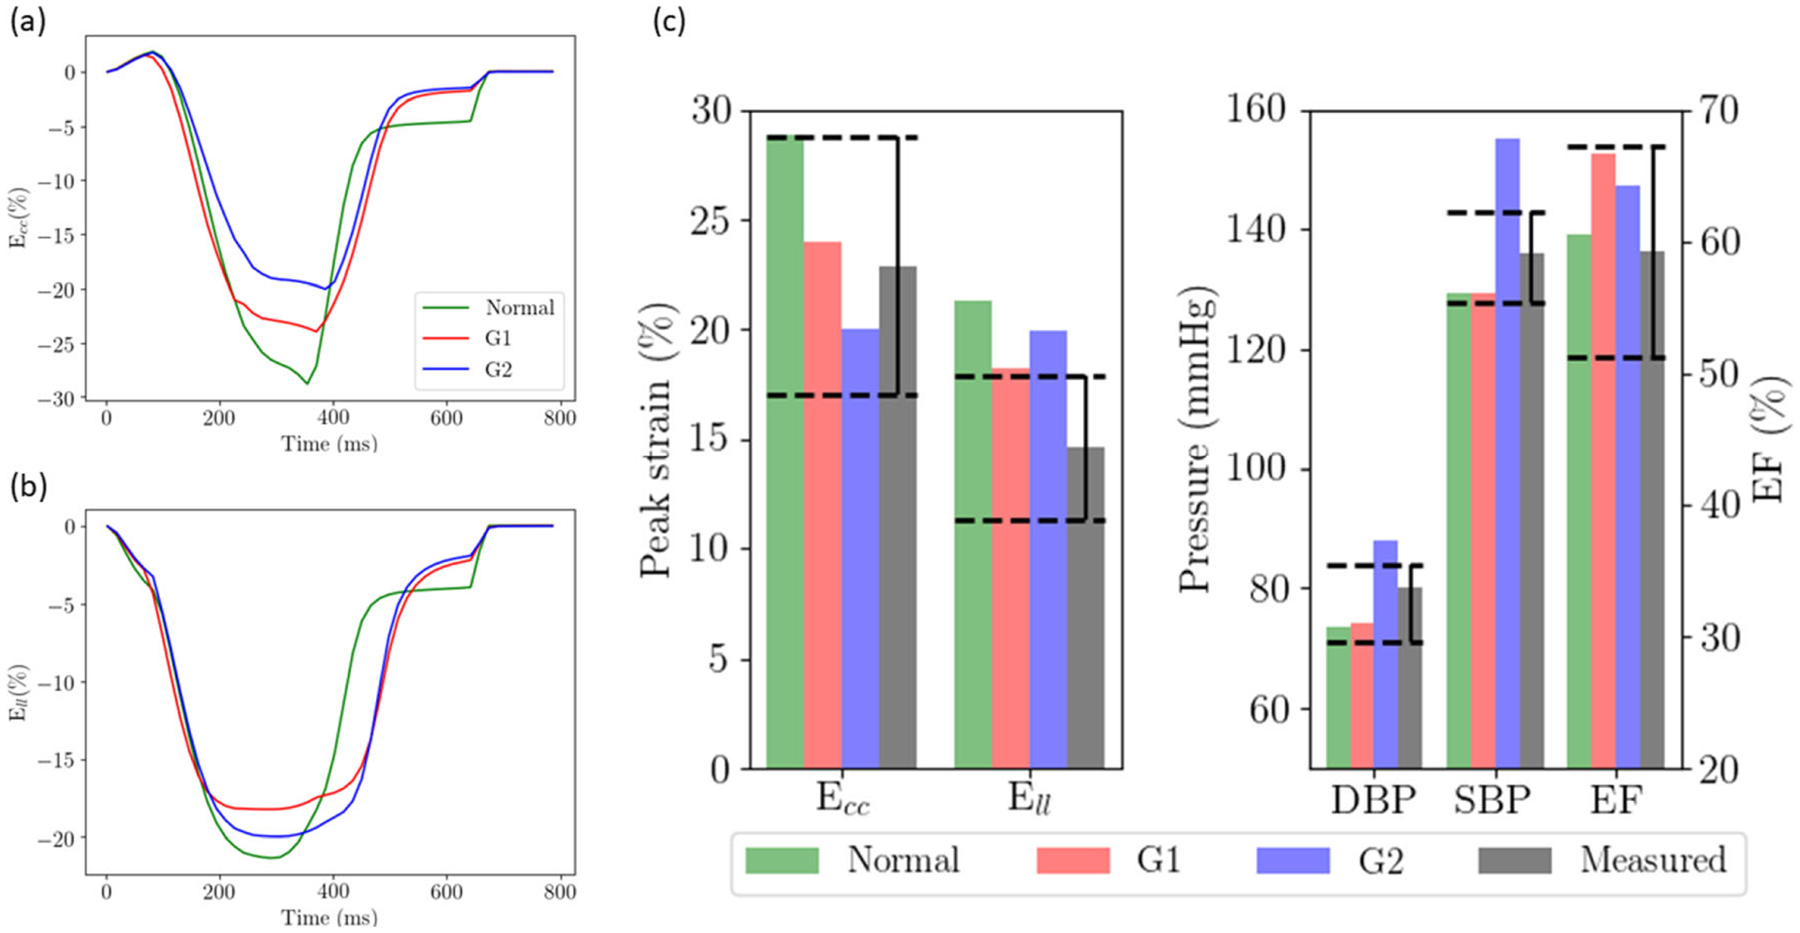
Effects of geometry, passive stiffness, and preload (case G1 and G2) on a Ecc waveform; b Ell waveform; c peak Ecc, Ell, SBP, DBP, and EF with respect to values measured in HFpEF patients (black bars). Dashed lines show the range of the measured values in HFpEF patients
Effects of Afterload
Increasing the afterload led to a decrease in peak Ecc and Ell (Fig. 4). For both HFpEF geometries, the decrease in peak Ecc was substantially more. An increase in SBP by 32 mmHg (from 129 in G1 to 161 mmHg in G1-A2) in HFpEF I geometry produced a decrease in peak Ecc by 4.7% (from 24 to 19.3%). Similarly, an increase in SBP by 47 mmHg (from 155 in G2 to 202 mmHg in G2-A2) in HFpEF II geometry produced a decrease in peak Ecc by 8.1% (from 20 to 11.9%). Corresponding to these increments in SBP, Ell was only reduced by 1.2% (from 18.2 to 17%) in HFpEF I and 2.5% (from 20 to 17.5%) in HFpEF II. Ejection fraction was reduced with increasing afterload, but remained above 50% for all these cases except for G2-A2 (with the highest afterload). We note while Ell fell within the clinical measurements of HFpEF patients [17] for these cases associated with increased afterload, their SBP and/or DBP were all outside the clinical measurements.
Fig. 4.
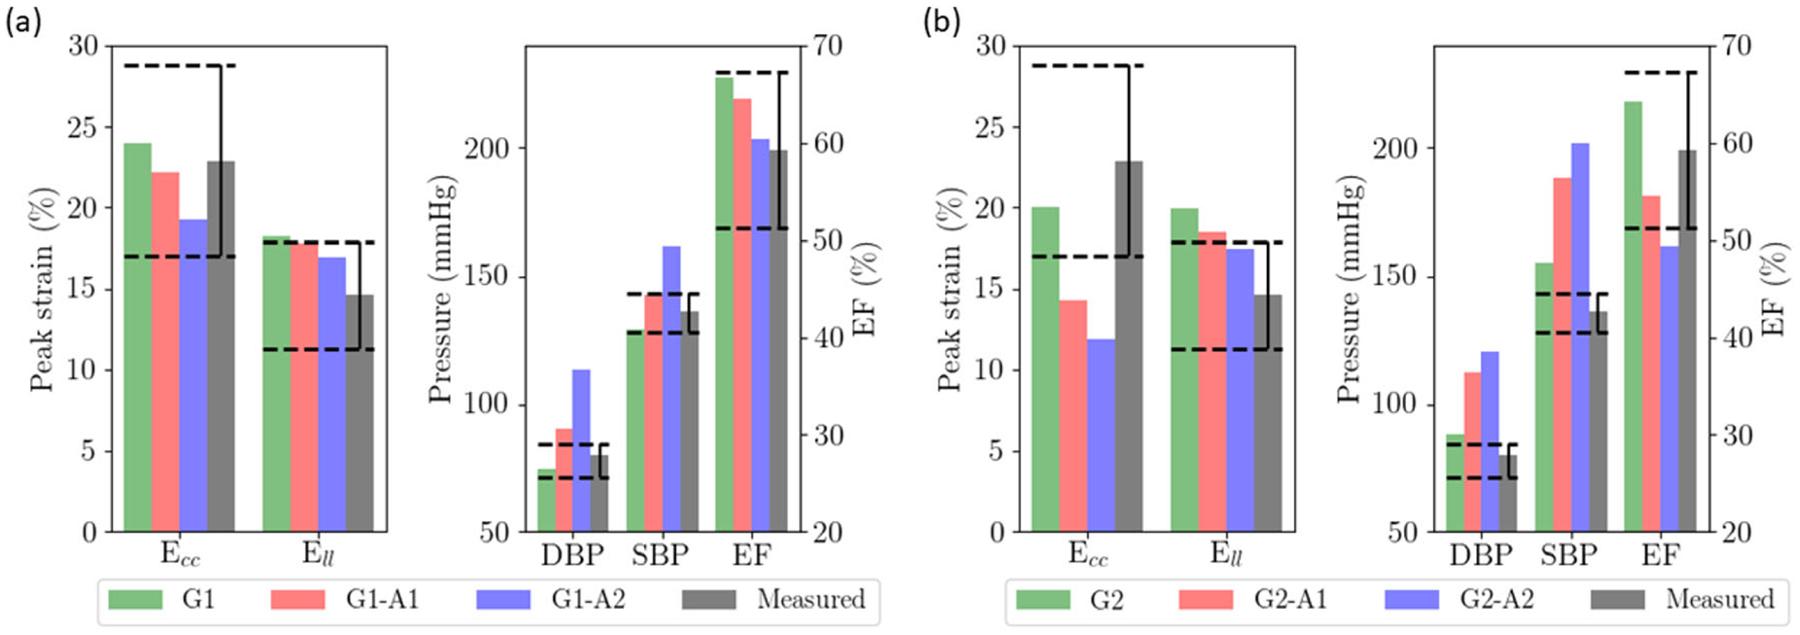
Effects of afterload on a HFpEF I geometry with a smaller LV cavity; b HFpEF II geometry with a dilated LV cavity. Dashed lines show the range of the measured values
Effects of Myocardial Contractility
Reducing myocardial contractility uniformly across the myocardial wall produced a decrease in SBP, DBP, peak Ecc and Ell in both HFpEF geometries (Fig. 5). Decreasing myocardial contractility by 60% in HFpEF I and 46% in HFpEF II produced a substantial reduction in peak Ecc by 12.7% (from 24 to 11.3%) and 8.9% (from 20 to 11.1%), respectively. Similar to afterload, peak Ell is less sensitive to myocardial contractility than peak Ecc. The same decrement in myocardial contractility produced only a 2.2% decrease in Ell (from 18.2 to 16.0%) in HFpEF I geometry and 2.1% decrease in Ell (from 20 to 17.9%) in HFpEF II geometry. These reductions were accompanied by a substantial reduction in SBP from 129 to 94 mmHg in HFpEF I and 155 to 121 mmHg in HFpEF II. Ejection fraction was decreased with myocardial contractility, and was below 50% in G1-C2 and G2-C2 associated with the largest reduction in myocardial contractility.
Fig. 5.
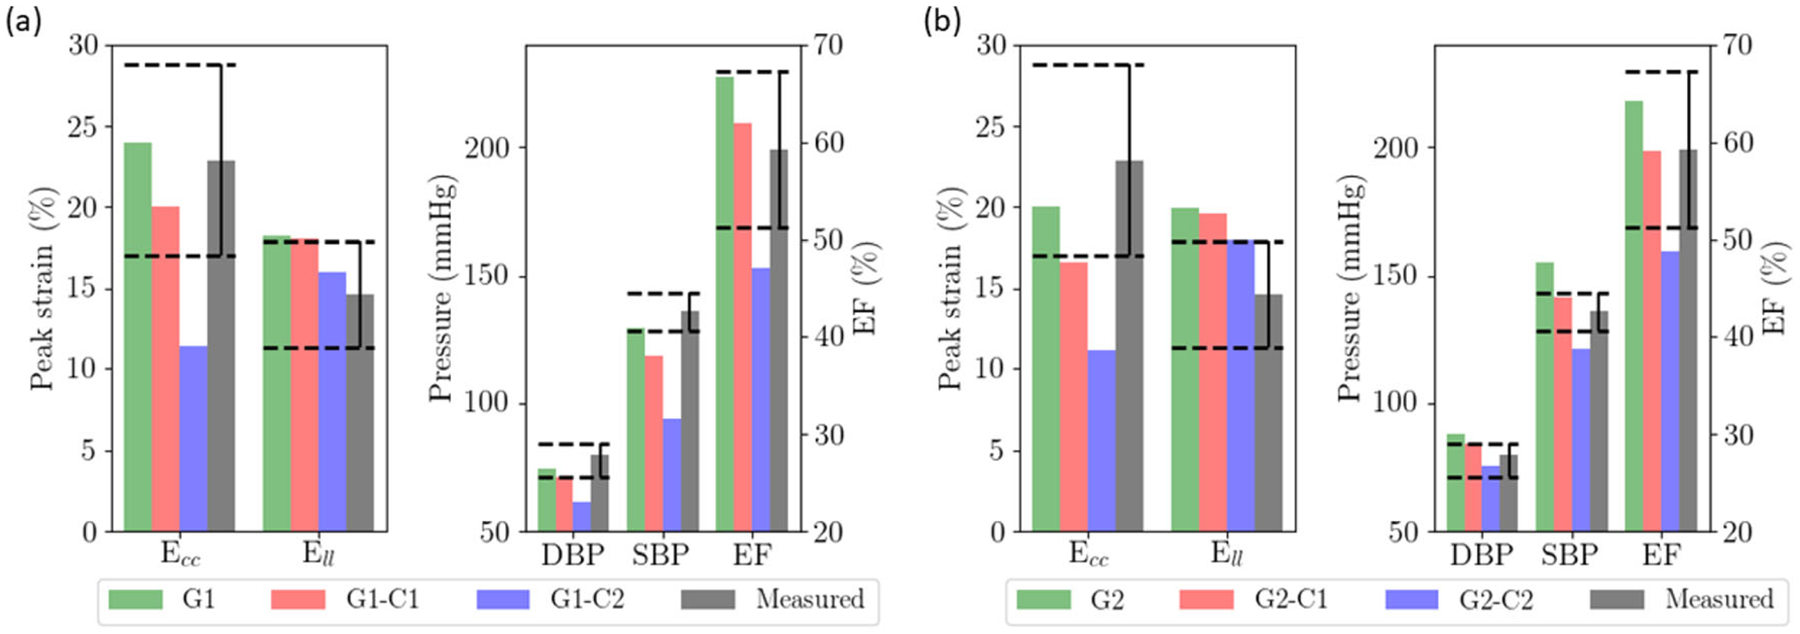
Effects of myocardial contractility on a HFpEF I geometry with a smaller LV cavity; b HFpEF II geometry with a dilated LV cavity. Dashed lines show the range of values measured in HFpEF patients
Effects of Simultaneous Changes of Both Afterload and Myocardial Contractility
As described thus far, none of the simulation cases associated with isolated changes in geometry, preload and passive stiffness, or these in combination with either an increase in afterload or a decrease in myocardial contractility, simultaneously reproduced the blood pressure, LV EF and strain measurements reported in HFpEF patients [17]. Accordingly, based on the results of these simulations, we varied the parameters to simultaneously reproduce the clinical measurements of HFpEF patients. For HFpEF I geometry, peak Ell was just within the range of measurements in G1-A1, but its DBP was above the measured values (Fig. 6a). Further increases or decreases in afterload would therefore cause DBP and Ell to be out of range, respectively. The same argument also applies for myocardial contractility, where further increases or decreases in G1-C1 will cause Ell and SBP/DBP to be out of range (Fig. 5a). As such, only a combination of increased afterload and reduced myocardial contractility can reproduce all the HFpEF measurements (G1-C-A). This combination, however, just replicates all the measurements. Inclusion of a small change of myofiber angle by 5° (i.e., linear variation from 55° at endocardium to −55° at the epicardium) (G1-C-A-55) provided a significantly better fit to peak Ell and Ecc in addition to all the other measurements (Fig. 6a).
Fig. 6.
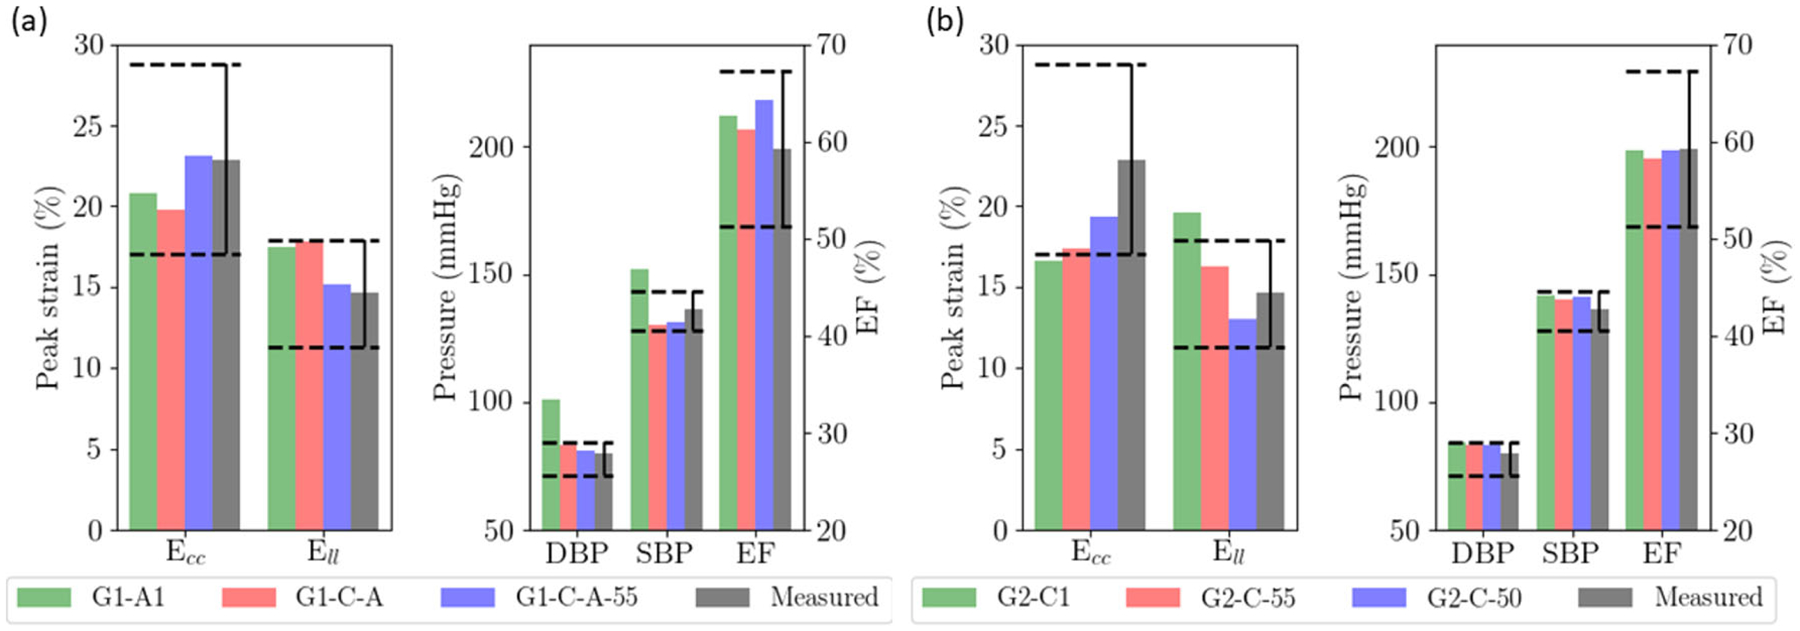
Combination of factors to reproduce clinical measurements. a HFpEF I geometry with a smaller LV cavity (G1-A1 as starting reference); b HFpEF II geometry with a dilated LV cavity (G2-C1 as starting reference). Dashed lines show the range of the measured values
For HFpEF II geometry, we note that changing the LV geometry to G2 already produces SBP and DBP that are higher than the clinical measurements with Ell still above the measured range. Thus, it is impossible to concurrently fit the clinical measurements of SBP, DBP, and Ell by purely adjusting the afterload. Similarly, we note that G2-C1’s EF, SBP, and DBP are all within the clinical range but Ecc and Ell are below and above the range of measured values, respectively (Fig. 5b). While further decrease in myocardial contractility or increase in afterload reduced Ell to within the clinical range, it caused Ecc to be much lower than the clinical range. Given this constraint, we find that the only alternative to simultaneously fit Ecc and Ell (as well as other conditions) is to slightly reduce the myofiber angle (by 5° and 10°) and make the muscle fiber more circumferential (Fig. 6b).
Discussion
We used a computational modeling framework to determine if reduced longitudinal strain observed in HFpEF patients was due to reduced myocardial contractility, an increase in afterload resistance and/or the accompanying altered geometry. Starting from a normal case that was validated against measurements of LV geometry (EDV, EDWT, mass), function (EF, Ecc, Ell, τ) and hemodynamics (DBP, SBP, EDP) in healthy humans (including the controls of several HFpEF studies [17, 32, 34]), we first show that a change in LV geometry, passive stiffness and preload to those found in HFpEF patients, without any other changes, decreases peak Ecc and Ell (Fig. 4). While the decrease in Ecc is within the clinical measurements, the decrease in Ell is, however, moderate (~2 to 3%, absolute) and is less than half of that measured in HFpEF patients [17]. This result is irrespective of the 2 HFpEF geometries (both with thicker LV wall and increased mass) that we considered here (i.e., HFpEF I with smaller LV cavity and HFpEF II with a slightly larger LV cavity compared to normal). Based on this, we conclude that the decrease in Ell (along with other changes) found in HFpEF patients cannot be explained solely by a mere change in LV geometry, pre-load, and passive stiffness.
Next, we tested the hypothesis that the reduction in Ell associated with HFpEF can be explained by either an increase in afterload (given that hypertension is present in 60% of HFpEF patients in the clinical study [17] and has a prevalence of 55–86% in HFpEF patients [43]) or a decrease in myocardial contractility. By superimposing these changes with a change in LV geometry, preload and/or passive stiffness in the simulations, we found that these changes, when imposed in isolation, could not simultaneously reproduce reported values of SBP, DBP, EF, Ecc, and Ell in HFpEF patients. In both HFpEF geometries considered here, increasing afterload reduced Ecc and Ell to the level found in HFpEF patients but produce SBPs and DBPs that are well above the measurements, and unphysiologically high (> 180 mmHg) for a slightly dilated HFpEF geometry (Fig. 4). Similarly, reducing myocardial contractility in the LV produced Ecc and Ell that agreed with the measurements, but caused SBPs and DBPs below the measured values (Fig. 5). As such, we conclude that the reduction in Ell in HFpEF cannot be produced by isolated changes in afterload or myocardial contractility.
Finally, we investigated the combined changes of myocardial contractility, afterload and myofiber angle changes that can simultaneously produce the conditions in SBP, DBP, EF, Ell, and Ecc all with magnitudes similar to those found in HFpEF patients [17]. As explained in the “Effects of Simultaneous Changes of Both Afterload and Myocardial Contractility” section, we found that a combination of reduced myocardial contractility (16%) and increase in afterload (20%) marginally reproduced all the above changes for HFpEF I geometry (smaller LV). A slight reduction in myofiber angle of 5° (i.e., more circumferential myofibers across the ventricular wall) provided a better fit to all target parameters. For HFpEF II geometry (dilated LV), a combination of reduced myocardial contractility (30%) and slight reduction in myofiber angle (5 to 10°) can reproduce all the conditions in HFpEF patients. We therefore conclude that the reduction in Ell in HFpEF can only be explained by a reduction in myocardial contractility and may be accompanied a small degree of myofiber reorientation.
Due in part to the heterogeneity of clinical characteristics encountered in HFpEF patients, the pathophysiology of HFpEF is likely to be multifactorial [11, 48]. It is essentially impossible to unravel the relative contributions of these multiple factors to changes in longitudinal strain purely from clinical observations or experiments. Computational modeling, on the other hand, is an important tool that can serve this purpose. While there are some computational modeling studies of HFpEF [23, 24, 49], the existing studies, to the best of our knowledge, have not comprehensively assessed the contributions of changes in afterload, tissue active tension and geometry to abnormalities in both hemodynamics (SBP and DBP) and functional indices (Ell and Ecc) found in HFpEF patients.
The key model prediction that the decrease in Ell in HFpEF patients must be accompanied by a reduction in myocardial contractility compares favorably with measurements of myocyte active tension from biopsy samples of hypertensive patients exhibiting diastolic dysfunction and concentric LV remodeling [50, 51]. Specifically in patients undergoing coronary bypass grafting, maximum developed isometric tension of isolated myocytes was found to be about 50% lower in those with hypertension, concentric remodeling but with normal EF compared to those without hypertension (10.67 ± 1.38 vs. 20.64 ± 3.29 mN/mm2) [50]; this is regardless of whether the patients had heart failure or not. Similarly, myocyte isometric tension was also found to be lower (though not statistically significant) in patients who had hypertension and diastolic heart failure compared to the recipients of heart transplants (20.3 ± 7.5 vs. 24.2 ± 12.4 kN/m2) [51]. This key model prediction is also largely consistent with previous modeling studies, with one suggesting that the active tension of myocytes is reduced at the subendocardial region but is increased at the subepicardial region in the LV of HFpEF patients [23], and the other suggesting the systolic contractile force is reduced in HFpEF due to abnormal calcium homeostasis [25]. We note that some clinical measurements, however, showed that epicardial (as well as endocardial) Ell is significantly reduced in HFpEF patients (cf. normal) by about 4% [52], 2.4% [53] and 5% (mid LV) [54]. These results suggest that contractility is likely to be reduced also in the epicardial region because an increase in contractility in that region would have locally produced an increase in peak myofiber strain [23].
Our simulations also suggest that the reduction in Ell in HFpEF patients may also be driven by a slight reorientation of the myofiber circumferentially. This result is consistent with a recent study that uses diffusion tensor magnetic resonance imaging to characterize the myocardial microstructure in patients with cardiac amyloidosis and exhibiting concentric hypertrophy with preserved EF [55]. The study found that these patients had reduced longitudinal orientation of the myofiber in the epicardial and endocardial layer, and these microstructural changes are strongly correlated with a reduction in global longitudinal strain. We also note that while a few histological studies have reported no change in the myofiber orientation [56] associated with concentric LV remodeling, the small change of 5 to 10° predicted by the model may not be detectable given that the standard deviation of typical histological studies is ~10° [57].
Our findings support the previously proposed interpretation that a reduction in Ell in HFpEF patients relates, in large part, to a reduction in myocardial contractility. While this conclusion does not a priori imply that inotropes are a potential treatment for HFpEF, it does contribute to the growing body of evidence documenting similarities of myocardial pathologies across the range of EFs [58]. Indeed, many of the abnormalities leading to systolic dysfunction also contribute to impaired diastolic function. For example, abnormalities of calcium metabolism by the sarcoplasmic reticulum contribute to both decreased contractility and decreased rate of relaxation [59]. Accordingly, based on such suppositions and detailed analyses, it has been suggested that despite failed studies, neurohormonal blockers may provide benefit at least in some segment of the chronic HFpEF population [58]. Furthermore, the prior clinical studies on which our analysis is based only examined LV function at rest; whether or not impaired resting systolic function at rest is also associated with impaired contractile reserve has not been assessed. Such an abnormality could contribute to exercise intolerance that is characteristic of HFpEF. The current findings highlight the need to determine whether and the degree to which reduced myocardial contractility contributes to symptoms or prognosis in HFpEF.
Model Limitations
The current findings need to be interpreted within the context of potential limitations. First, we have assumed the LV geometry to be an idealized truncated ellipsoid (for simplicity), and consequently, did not consider any asymmetrical geometrical differences (e.g., focal hypertrophy of the interventricular septum [60]), patient-specific variability (due to multifactorial nature of the disease) or possible effects of the right ventricle. Patient-specific geometrical (as well as hemodynamics and functional) variability can be considered in future studies by repeating the analysis on a sample of patient-specific data (with sufficient statistical power), which is substantially more involved and complex. Second, we do not consider regional or transmural changes in myocardial contractility in this study. Due to the transmural differences in metabolism [61] and perfusion [62], changes in myocardial contractility may be different across the LV wall as suggested in one study [23]. Future study will investigate the effects of any transmural changes in myocardial contractility in HFpEF. Third, we have confined our study to longitudinal and circumferential strains, and did not investigate ventricular torsion that has been found to be reduced in HFpEF [63]. Fourth, we have only considered ventricular properties under resting conditions as the clinical measurements were performed under those conditions. However, symptoms and hemodynamic abnormalities of many HFpEF patients are manifested and exaggerated even during mild exertion. Whether this reflects an alteration of intrinsic ventricular properties or a more complex interplay between peripheral and ventricular properties is currently unknown and not addressed in the present analysis. Fifth, we did not consider the effects of left atrial (LA) dysfunction, which may be present (e.g., lower LA peak strain) given that the LA is exposed to an elevated LV filling pressure in HFpEF [64]. Finally, we have focused largely on modeling features from the data acquired in a number of clinical studies [17, 19, 32] that do not distinguish between the time course over which HFpEF has developed. As such, the findings here reproduce the observations in a cross-section of HFpEF patients, and do not correspond to any specific etiology and/or time point during disease progression. Given that the clinical data that this study was based on show a reduction in both circumferential and longitudinal strains, the findings here may correspond to a more advanced phenotype of HFpEF as suggested in a study [65]. Future studies with longitudinal data will be able to help characterize the time course of the alteration of ventricular properties in HFpEF patients.
Summary and Conclusion
Based on a validated FE computational model, we replicated key aspects of ventricular geometry, chamber size, blood pressure, LV EF, and circumferential and longitudinal strain reported in HFpEF patients. Optimal matching of model prediction to all these features was achieved only through simultaneous reduction of myocardial contractility with a moderate reduction in the myofiber helix angle and an increase in afterload. Thus, we conclude that the reduction of longitudinal strain reflects a reduction of myocardial contractility in HFpEF and is not simply a reflection of increased afterload or altered geometry. In view of the fact that reduced longitudinal strain has been associated with worse survival in HFpEF patients [66], the current results provide an important clarification of the mechanisms by which strain is reduced.
Funding
This study was funded by the American Heart Association (AHA) grant 17SDG33370110 and the National Institutes of Health (NIH) R01 HL134841.
Abbreviations
- DBP
Diastolic blood pressure
- EF
Ejection fraction
- EDV
End-diastolic volume
- Ell
Global longitudinal strain
- Ecc
Global circumferential strain
- HFpEF
Heart failure with preserved ejection fraction
- HFrEF
Heart failure with reduced ejection fraction
- HF
Heart failure
- FE
Finite element
- LV
Left ventricle
- Ra, d
Peripheral resistance parameter
- SBP
Systolic blood pressure
- T ref
Active tension parameter
Appendix
Closed Loop Systemic Circulatory Model
The LV FE model was coupled to a closed loop lumped-parameter circulatory model that describes the systemic circulation (Fig. 1), which is similar to our previous work [27]. The modeling framework consists of five compartments of the systemic circulation namely, LV, LA, proximal artery, distal artery, and vein. The total mass of blood needs to be conserved in the circulatory model, which requires that the rate of volume change in each storage compartment of the circulatory system to the inflow and outflow rates by the following relations,
| (1a) |
| (1b) |
| (1c) |
| (1d) |
| (1e) |
where VLA, VLV, Va, p, Va, d, and Vven are volumes of LV, LA, proximal artery, distal artery, and vein, respectively, and qven, qmv, qao, qa, p, and qa, d are flow rates at different segments. Flowrate at different segments of the circulatory model depends on their resistance to flow (Rao, Ra, p, Ra, d, Rven, and Rmv) and the pressure difference between the connecting storage compartments (i.e., pressure gradient). The flow rates are given by
| (2a) |
| (2b) |
| (2c) |
| (2d) |
| (2e) |
Pressure in each storage compartment is a function of its volume. A simplified pressure–volume relationship
| (3a) |
| (3b) |
| (3c) |
was prescribed for the proximal artery, distal artery, and veins, where Vap, 0, Vad, 0, and Vven, 0 are constant resting volumes of the proximal artery, distal artery, and veins. Ca, p, Ca, d, and Cven are the total compliance of the proximal artery, distal artery, and venous system. On the other hand, pressure in the left atrium PLA(t) was prescribed to be a function of its volume VLA(t) by the following equations that describe its contraction using a time-varying elastance function [67]
| (4) |
where
| (5a) |
| (5b) |
and,
| (5c) |
In Eqs. (5a–b), Ees, LA is the end-systolic elastance of the left atrium, V0, LA is the volume axis intercept of the end-systolic pressure–volume relationship (ESPVR), and both ALA and BLA are parameters of the end-diastolic pressure–volume relationship (EDPVR) of the left atrium. The driving function e(t) is given in Eq. (5c) in which tmax is the point of maximal chamber elastance and τ is the time constant of relaxation. The values of Ees, LA, V0, LA, ALA, BLA, tmax, and τLA are listed in Table 3.
Finally, pressure in the LV depends on its corresponding volume through nonclosed form function
| (6) |
The functional relationship between pressure and volume in the LV was obtained using the FE method as described in the next section. Parameter values associated with the closed loop circulatory model are tabulated in Table 4.
Table 3.
Fixed parameters of LA time varying elastance model for all cases
| Parameter | Unit | Values |
|---|---|---|
| End-systolic elastance, Ees, LA | Pa/ml | 60 |
| Volume axis intercept, V0, LA | ml | 10 |
| Scaling factor for EDPVR, ALA | Pa | 2.67 |
| Exponent for EDPVR, BLA | ml−1 | 0.019 |
| Time to end-systole, Tmax | msec | 120 |
| Time constant of relaxation, τ | msec | 25 |
Table 4.
Fixed parameter values of the circulatory model for all simulation cases
| Parameter | Unit | Values |
|---|---|---|
| Aortic valve resistance, Rao | Pa ms ml−1 | 500 |
| Proximal aorta resistance, Ra, p | Pa ms ml−1 | 18,000 |
| Venous resistance, Rven | Pa ms ml−1 | 100 |
| Mitral valve resistance, Rmv | Pa ms ml−1 | 200 |
| Proximal aorta compliance, Ca, p | ml Pa | 0.0032 |
| Distal aorta compliance, Ca, d | ml Pa | 0.033 |
| Venous compliance, Cven | ml Pa | 0.28 |
| Resting volume for proximal aorta, Vap, 0 | ml | 360 |
| Resting volume for distal aorta, Vad, 0 | ml | 40 |
Finite Element Formulation of the LV
The weak form associated with finite element formulation of the LV was derived based on the minimization of the following Lagrangian functional [28, 37],
| (7) |
where, u is the displacement field, Pcav is the Lagrange multiplier to constrain the LV cavity volume Vcav(u) to a prescribed value V [68], p is a Lagrange multiplier to enforce incompressibility of the tissue (i.e., Jacobian of the deformation gradient tensor J = 1), and both c1 and c2 are Lagrange multipliers to constrain rigid body translation (i.e., zero mean translation) and rotation (i.e., zero mean rotation) [[69]]. The LV cavity volume Vcav is a function of the displacement u and is defined by
| (8) |
where Ωinner is the volume enclosed by the inner surface Γinner and the basal surface at z = 0, and n is the outward unit normal vector.
Pressure–volume relationship of the LV required in the lumped parameter circulatory model (i.e., Eqs. (6)) was defined by the solution obtained from minimizing the functional [27]. Taking the first variation of the functional in Eq. (7) leads to the following expression:
| (9) |
In Eq. (9), P is the first Piola Kirchhoff stress tensor, F is the deformation gradient tensor, δu, δp, δPcav, δc1, δc2 are the variation of the displacement field, Lagrange multipliers for enforcing incompressibility and volume constraint, zero mean translation and rotation, respectively. The Euler-Lagrange problem then becomes finding u ∈ H1(Ω0), p ∈ L2(Ω0), , , that satisfies
| (10) |
and u(x, y, 0).n|base = 0 (for constraining the basal deformation to be in-plane) ∀δu(Ω0), δp ∈ L2(Ω0), , , .
Constitutive Law of the LV
An active stress formulation was used to describe the LV’s mechanical behavior in the cardiac cycle. In this formulation, the stress tensor P can be decomposed additively into a passive component Pp and an active component Pa (i.e., P = Pa + Pp). The passive stress tensor was defined by Pp = dW/dF, where W is a strain energy function of a Fung-type transversely isotropic hyperelastic material [30] given by
| (11a) |
where,
| (11b) |
In Eq. (11), Eij with (i, j) ∈ (f, s, n) are components of the Green–Lagrange strain tensor E with f, s, n denoting the myocardial fiber, sheet, and sheet normal directions, respectively. Material parameters of the passive constitutive model are denoted by C, bff, bxx, and bfx.
The active stress Pa was calculated along the local fiber direction using a modified time varying elastance model,
| (12) |
In the above equation, ef and are, respectively, the local vectors defining the muscle fiber direction in the current and reference configuration, Tref is the reference tension and Ca0 denotes the peak intracellular calcium concentration. The length dependent calcium sensitivity ECa50 and the variable Ct are given by [29]
| (13) |
| (14) |
In Eq. (13), B is a constant, is the maximum peak intracellular calcium concentration and l0 is the sarcomere length at which no active tension develops. In Eq. (14), t0 is the time taken to reach the peak tension, tt is the time at which isovolumic relaxation of LV starts and τ is the time constant of the isovolumic relaxation. Parameter values associated with the LV model are tabulated in Table 5.
Table 5.
Fixed parameter values of the LV FE model
| Parameter | Unit | Values |
|---|---|---|
| Exponent of strain energy function, bff | Unitless | 29 |
| Exponent of strain energy function, bxx | Unitless | 26.6 |
| Exponent of strain energy function, bfx | Unitless | 13.3 |
| Maximum peak intracellular Ca concentration, (Ca0)max | μM | 4.35 |
| Peak intracellular Ca concentration,Ca0 | μM | 4.35 |
| Parameter for isometric tension-sarcomere relationship, B | μm−1 | 4.75 |
| Sarcomere length at zero-active tension, l0 | μm | 1.58 |
| Time to peak tension, t0 | msec | 275 |
| Time to beginning of relaxation, tt | msec | 300 |
Parameters for each simulation cases are tabulated in Table 6.
Table 6.
Parameters for simulation cases
| Passive stiffness C (Pa) | Active tension Tref (kPa) | Distal arterial resistance, Ra, d (kPa ms ml−1) | Resting venous volumeVven0 (ml) | Relaxation time constant τ (ms) | |
|---|---|---|---|---|---|
| Normal | 130 | 130 | 106 | 3370 | 25 |
| G1 | 145 | 130 | 106 | 3100 | 50 |
| G1-C1 | 145 | 91 | 106 | 3100 | 50 |
| G1-C2 | 145 | 52 | 106 | 3100 | 50 |
| G1-A1 | 145 | 130 | 212 | 3100 | 50 |
| G1-A2 | 145 | 130 | 318 | 3100 | 50 |
| G1-C-A | 145 | 100 | 139.2 | 3100 | 50 |
| G1-C-A-55 | 145 | 109 | 128 | 3100 | 50 |
| G2 | 130 | 130 | 106 | 2950 | 50 |
| G2-C1 | 130 | 100 | 106 | 2950 | 50 |
| G2-C2 | 130 | 70 | 106 | 2950 | 50 |
| G2-A1 | 130 | 130 | 212 | 2950 | 50 |
| G2-A2 | 130 | 130 | 318 | 2950 | 50 |
| G2-C-55 | 130 | 91 | 106 | 2950 | 50 |
| G2-C-50 | 130 | 91 | 106 | 2950 | 50 |
Footnotes
Conflict of Interest All the authors declare that they have no conflict of interest.
Ethical Approval This article does not contain any studies with human participants or animals performed by any of the authors.
References
- 1.Bhatia RS, Tu JV, Lee DS, et al. (2006). Outcome of heart failure with preserved ejection fraction in a population-based study. The New England Journal of Medicine, 355(3), 260–269. 10.1056/NEJMoa051530. [DOI] [PubMed] [Google Scholar]
- 2.Owan TE, Hodge DO, Herges RM, Jacobsen SJ, Roger VL, & Redfield MM (2006). Trends in prevalence and outcome of heart failure with preserved ejection fraction. The New England Journal of Medicine, 355(3), 251–259. 10.1056/NEJMoa052256. [DOI] [PubMed] [Google Scholar]
- 3.Borlaug BA, & Paulus WJ (2011). Heart failure with preserved ejection fraction: pathophysiology, diagnosis, and treatment. European Heart Journal, 32(6), 670–679. 10.1093/eurheartj/ehq426. [DOI] [PMC free article] [PubMed] [Google Scholar]
- 4.Somaratne JB, Berry C, McMurray JJV, Poppe KK, Doughty RN, & Whalley GA (2009). The prognostic significance of heart failure with preserved left ventricular ejection fraction: a literature-based meta-analysis. European Journal of Heart Failure, 11(9), 855–862. 10.1093/eurjhf/hfp103. [DOI] [PubMed] [Google Scholar]
- 5.Tribouilloy C, Rusinaru D, Mahjoub H, et al. (2008). Prognosis of heart failure with preserved ejection fraction: a 5 year prospective population-based study. European Heart Journal, 29(3), 339–347. 10.1093/eurheartj/ehm554. [DOI] [PubMed] [Google Scholar]
- 6.Asif M, Egan J, Vasan S, et al. (2000). An advanced glycation endproduct cross-link breaker can reverse age-related increases in myocardial stiffness. Proceedings of the National Academy of Sciences. 10.1073/pnas.040558497. [DOI] [PMC free article] [PubMed] [Google Scholar]
- 7.Liu J, Masurekar MR, Vatner DE, et al. (2003). Glycation end-product cross-link breaker reduces collagen and improves cardiac function in aging diabetic heart. American Journal of Physiology. Heart and Circulatory Physiology 10.1152/ajpheart.00516.2003. [DOI] [PubMed] [Google Scholar]
- 8.Solomon SD, Zile M, Pieske B, et al. (2012). The angiotensin receptor neprilysin inhibitor LCZ696 in heart failure with preserved ejection fraction: a phase 2 double-blind randomised controlled trial. Lancet. 10.1016/S0140-6736(12)61227-6. [DOI] [PubMed] [Google Scholar]
- 9.Van Tassell BW, Arena R, Biondi-Zoccai G, et al. (2014). Effects of interleukin-1 blockade with anakinra on aerobic exercise capacity in patients with heart failure and preserved ejection fraction (from the D-HART Pilot Study). The American Journal of Cardiology. 10.1016/j.amjcard.2013.08.047. [DOI] [PMC free article] [PubMed] [Google Scholar]
- 10.Yamagami K, Oka T, Wang Q, et al. (2015). Pirfenidone exhibits cardioprotective effects by regulating myocardial fibrosis and vascular permeability in pressure overloaded hearts. American Journal of Physiology. Heart and Circulatory Physiology 10.1152/ajpheart.00137.2015. [DOI] [PubMed] [Google Scholar]
- 11.Roh J, Houstis N, & Rosenzweig A (2017). Why don’t we have proven treatments for HFpEF? Circulation Research, 120(8), 1243–1245. 10.1161/CIRCRESAHA.116.310119. [DOI] [PMC free article] [PubMed] [Google Scholar]
- 12.Ponikowski P, Voors AA, Anker SD, et al. (2016). ESC Guidelines for the diagnosis and treatment of acute and chronic heart failure. European Heart Journal, 37(27), 2129–2200m. 10.1093/eurheartj/ehw128. [DOI] [PubMed] [Google Scholar]
- 13.Sengupta PP, & Marwick TH (2018). The many dimensions of diastolic function: a curse or a blessing? JACC: Cardiovascular Imaging. 10.1016/j.jcmg.2017.05.015. [DOI] [PubMed] [Google Scholar]
- 14.Zile MR, Baicu CF, & Gaasch WH (2004). Diastolic heart failure—abnormalities in active relaxation and passive stiffness of the left ventricle. The New England Journal of Medicine, 350(19), 1953–1959. 10.1056/NEJMoa032566. [DOI] [PubMed] [Google Scholar]
- 15.Velagaleti RS, Gona P, Pencina MJ, et al. (2014). Left ventricular hypertrophy patterns and incidence of heart failure with preserved versus reduced ejection fraction. The American Journal of Cardiology, 113(1), 117–122. 10.1016/j.amjcard.2013.09.028. [DOI] [PMC free article] [PubMed] [Google Scholar]
- 16.Zile MR, Gaasch WH, Carroll JD, et al. (2001). Heart failure with a normal ejection fraction: is measurement of diastolic function necessary to make the diagnosis of diastolic heart failure? Circulation, 104, 779–782. 10.1161/hc3201.094226. [DOI] [PubMed] [Google Scholar]
- 17.Kraigher-Krainer E, Shah AM, Gupta DK, et al. (2014). Impaired systolic function by strain imaging in heart failure with preserved ejection fraction. Journal of the American College of Cardiology, 63(5), 447–455. 10.1016/j.jacc.2013.09.052. [DOI] [PMC free article] [PubMed] [Google Scholar]
- 18.Zou H, Xi C, Zhao X, et al. (2018). Quantification of biventricular strains in heart failure with preserved ejection fraction patient using hyperelastic warping method. Frontiers in Physiology, 9, 1295. 10.3389/fphys.2018.01295. [DOI] [PMC free article] [PubMed] [Google Scholar]
- 19.Morris DA, Ma X-X, Belyavskiy E, et al. (2017). Left ventricular longitudinal systolic function analysed by 2D speckle-tracking echocardiography in heart failure with preserved ejection fraction: a meta-analysis. Open Hear, 4(2). 10.1136/openhrt-2017-000630. [DOI] [PMC free article] [PubMed] [Google Scholar]
- 20.Shah AM, Claggett B, Sweitzer NK, et al. (2015). Prognostic importance of changes in cardiac structure and function in heart failure with preserved ejection fraction and the impact of spironolactone. Circulation. Heart Failure 10.1161/CIRCHEARTFAILURE.115.002249. [DOI] [PMC free article] [PubMed] [Google Scholar]
- 21.Kawaguchi M, Hay I, Fetics B, & Kass DA (2003). Combined ventricular systolic and arterial stiffening in patients with heart failure and preserved ejection fraction: Implications for systolic and diastolic reserve limitations. Circulation, 107(5), 714–720. 10.1161/01.CIR.0000048123.22359.A0. [DOI] [PubMed] [Google Scholar]
- 22.Borlaug BA, Lam CSP, Roger VL, Rodeheffer RJ, & Redfield MM (2009). Contractility and ventricular systolic stiffening in hypertensive heart disease insights into the pathogenesis of heart failure with preserved ejection fraction. Journal of the American College of Cardiology, 54(5), 410–418. 10.1016/j.jacc.2009.05.013. [DOI] [PMC free article] [PubMed] [Google Scholar]
- 23.Dabiri Y, Sack KL, Shaul S, Sengupta PP, & Guccione JM (2018). Relationship of transmural variations in myofiber contractility to left ventricular ejection fraction: Implications for modeling heart failure phenotype with preserved ejection fraction. Frontiers in Physiology. 10.3389/fphys.2018.01003. [DOI] [PMC free article] [PubMed] [Google Scholar]
- 24.Genet M, Lee LC, Baillargeon B, Guccione JM, & Kuhl E (2016). Modeling pathologies of diastolic and systolic heart failure. Annals of Biomedical Engineering, 44(1), 112–127. 10.1007/s10439-015-1351-2. [DOI] [PMC free article] [PubMed] [Google Scholar]
- 25.Adeniran I, MacIver DH, Hancox JC, & Zhang H (2015). Abnormal calcium homeostasis in heart failure with preserved ejection fraction is related to both reduced contractile function and incomplete relaxation: An electromechanically detailed biophysical modeling study. Frontiers in Physiology. 10.3389/fphys.2015.00078. [DOI] [PMC free article] [PubMed] [Google Scholar]
- 26.MacIver DH, & Townsend M (2008). A novel mechanism of heart failure with normal ejection fraction. Heart. 10.1136/hrt.2006.114082. [DOI] [PubMed] [Google Scholar]
- 27.Shavik SM, Wall ST, Sundnes J, Burkhoff D, & Lee LC (2017). Organ-level validation of a cross-bridge cycling descriptor in a left ventricular finite element model: effects of ventricular loading on myocardial strains. Physics Reports, 5(21), e13392. 10.14814/phy2.13392. [DOI] [PMC free article] [PubMed] [Google Scholar]
- 28.Shavik S-M, Zhong L, Zhao X, & Lee LC (2019). In-silico assessment of the effects of right ventricular assist device on pulmonary arterial hypertension using an image based biventricular modeling framework. Mechanics Research Communications, 97, 101–111. [DOI] [PMC free article] [PubMed] [Google Scholar]
- 29.Guccione JM, Waldman LK, & McCulloch AD (1993). Mechanics of active contraction in cardiac muscle : Part II—cylindrical models of the systolic left ventricle. Journal of Biomechanical Engineering, 115(February), 82–90. [DOI] [PubMed] [Google Scholar]
- 30.Guccione JM, Mcculloch AD, & Waldman LK (1991). Passive material properties of intact ventricular myocardium determined from a cylindrical model. Journal of Biomechanical Engineering, 113(1), 42–55. [DOI] [PubMed] [Google Scholar]
- 31.Logg A, Wells GN, & Mardel KA (2012). Automated solution of differential equations by the finite element method, 84. 10.1007/978-3-642-23099-8. [DOI] [Google Scholar]
- 32.Maurer MS, King DL, El-Khoury Rumbarger L, Packer M, & Burkhoff D (2005). Left heart failure with a normal ejection fraction: Identification of different pathophysiologic mechanisms. Journal of Cardiac Failure, 11(3), 177–187. 10.1016/j.cardfail.2004.10.006. [DOI] [PubMed] [Google Scholar]
- 33.Shah AM (2013). Ventricular remodeling in heart failure with preserved ejection fraction. Current Heart Failure Reports, 10(4), 341–349. 10.1007/s11897-013-0166-4. [DOI] [PMC free article] [PubMed] [Google Scholar]
- 34.Maurer MS, Burkhoff D, Fried LP, Gottdiener J, King DL, & Kitzman DW (2007). Ventricular structure and function in hypertensive participants with heart failure and a normal ejection fraction. The Cardiovascular Health Study. Journal of the American College of Cardiology. 10.1016/j.jacc.2006.10.061. [DOI] [PubMed] [Google Scholar]
- 35.Prasad A, Hastings JL, Shibata S, et al. (2010). Characterization of static and dynamic left ventricular diastolic function in patients with heart failure with a preserved ejection fraction. Circulation. Heart Failure, 3(5), 617–626. 10.1161/CIRCHEARTFAILURE.109.867044. [DOI] [PMC free article] [PubMed] [Google Scholar]
- 36.Zile MR, Baicu CF, Ikonomidis JS, et al. (2015). Myocardial stiffness in patients with heart failure and a preserved ejection fraction contributions of collagen and titin. Circulation. 10.1161/CIRCULATIONAHA.114.013215. [DOI] [PMC free article] [PubMed] [Google Scholar]
- 37.Shavik SM, Jiang Z, Baek S, & Lee LC (2018). High spatial resolution multi-organ finite element modeling of ventricular-arterial coupling. Frontiers in Physiology, 9(MAR). 10.3389/fphys.2018.00119. [DOI] [PMC free article] [PubMed] [Google Scholar]
- 38.Shavik SM, Tossas-Betancourt C, Figueroa CA, Baek S, & Lee LC (2020). Multiscale modeling framework of ventricular-arterial bi-directional interactions in the cardiopulmonary circulation. Frontiers in Physiology, 11, 2. 10.3389/fphys.2020.00002. [DOI] [PMC free article] [PubMed] [Google Scholar]
- 39.Streeter DD, Spotnitz HM, Patel DP, Ross J, & Sonnenblick EH (1969). Fiber orientation in the canine left ventricle during diastole and systole. Circulation Research, 24(3), 339–347. 10.1161/01.RES.24.3.339. [DOI] [PubMed] [Google Scholar]
- 40.He K-L, Burkhoff D, Leng W-X, et al. (2009). Comparison of ventricular structure and function in Chinese patients with heart failure and ejection fractions >55% versus 40% to 55% versus. The American Journal of Cardiology, 103(6), 845–851. 10.1016/j.amjcard.2008.11.050. [DOI] [PMC free article] [PubMed] [Google Scholar]
- 41.Mascherbauer J, Zotter-Tufaro C, Duca F, et al. (2017). Wedge pressure rather than left ventricular end-diastolic pressure predicts outcome in heart failure with preserved ejection fraction. JACC Hear Fail. 10.1016/j.jchf.2017.08.005. [DOI] [PMC free article] [PubMed] [Google Scholar]
- 42.Borlaug BA, Jaber WA, Ommen SR, Lam CSP, Redfield MM, & Nishimura RA (2011). Diastolic relaxation and compliance reserve during dynamic exercise in heart failure with preserved ejection fraction. Heart. 10.1136/hrt.2010.212787. [DOI] [PMC free article] [PubMed] [Google Scholar]
- 43.Lam CSP, Donal E, Kraigher-Krainer E, & Vasan RS (2011). Epidemiology and clinical course of heart failure with preserved ejection fraction. European Journal of Heart Failure, 13(1), 18–28. 10.1093/eurjhf/hfq121. [DOI] [PMC free article] [PubMed] [Google Scholar]
- 44.Westermann D, Kasner M, Steendijk P, et al. (2008). Role of left ventricular stiffness in heart failure with normal ejection fraction. Circulation. 10.1161/CIRCULATIONAHA.107.716886. [DOI] [PubMed] [Google Scholar]
- 45.Gorcsan J, & Tanaka H (2011). Echocardiographic assessment of myocardial strain. Journal of the American College of Cardiology, 58(14), 1401–1413. 10.1016/j.jacc.2011.06.038. [DOI] [PubMed] [Google Scholar]
- 46.Smiseth OA, Torp H, Opdahl A, Haugaa KH, & Urheim S (2015). Myocardial strain imaging: how useful is it in clinical decision making? European Heart Journal, 37(15), 1196–1207. 10.1093/eurheartj/ehv529. [DOI] [PMC free article] [PubMed] [Google Scholar]
- 47.Hoit BD (2011). Strain and strain rate echocardiography and coronary artery disease. Circulation. Cardiovascular Imaging, 4(2), 179–190. 10.1161/CIRCIMAGING.110.959817. [DOI] [PubMed] [Google Scholar]
- 48.Butler J, Hamo CE, Udelson JE, et al. (2016). Exploring new endpoints for patients with heart failure with preserved ejection fraction. Circulation. Heart Failure 10.1161/CIRCHEARTFAILURE.116.003358. [DOI] [PubMed] [Google Scholar]
- 49.Luo C, Ramachandran D, Ware DL, Ma TS, & Clark JW (2011). Modeling left ventricular diastolic dysfunction: classification and key indicators. Theoretical Biology & Medical Modelling. 10.1186/1742-4682-8-14. [DOI] [PMC free article] [PubMed] [Google Scholar]
- 50.Donaldson C, Palmer BM, Zile M, et al. (2012). Myosin cross-bridge dynamics in patients with hypertension and concentric left ventricular remodeling. Circulation. Heart Failure, 5(6), 803–811. 10.1161/CIRCHEARTFAILURE.112.968925. [DOI] [PMC free article] [PubMed] [Google Scholar]
- 51.Borbély A, Van Der Velden J, Papp Z, et al. (2005). Cardiomyocyte stiffness in diastolic heart failure. Circulation, 111(6), 774–781. 10.1161/01.CIR.0000155257.33485.6D. [DOI] [PubMed] [Google Scholar]
- 52.Tanacli R, Hashemi D, Neye M, et al. (2020). Multilayer myocardial strain improves the diagnosis of heart failure with preserved ejection fraction. ESC Hear Fail. 10.1002/ehf2.12826. [DOI] [PMC free article] [PubMed] [Google Scholar]
- 53.Xu L, Pagano JJ, Haykowksy MJ, et al. (2020). Layer-specific strain in patients with heart failure using cardiovascular magnetic resonance: not all layers are the same. Journal of Cardiovascular Magnetic Resonance. 10.1186/s12968-020-00680-6. [DOI] [PMC free article] [PubMed] [Google Scholar]
- 54.Smith SP, Secomb TW, Hong BD, & Moulton MJ (2016). Time-dependent regional myocardial strains in patients with heart failure with a preserved ejection fraction. BioMed Research International. 10.1155/2016/8957307. [DOI] [PMC free article] [PubMed] [Google Scholar]
- 55.Gotschy A, Von Deuster C, Van Gorkum RJH, et al. (2019). Characterizing cardiac involvement in amyloidosis using cardiovascular magnetic resonance diffusion tensor imaging. Journal of Cardiovascular Magnetic Resonance. 10.1186/s12968-019-0563-2. [DOI] [PMC free article] [PubMed] [Google Scholar]
- 56.Pearlman ES, Weber KT, Janicki JS, Pietra GG, & Fishman AP (1982). Muscle fiber orientation and connective tissue content in the hypertrophied human heart. Laboratory Investigation. [PubMed] [Google Scholar]
- 57.Ennis DB, Nguyen TC, Riboh JC, et al. (2008). Myofiber angle distributions in the ovine left ventricle do not conform to computationally optimized predictions. Journal of Biomechanics. 10.1016/j.jbiomech.2008.08.007. [DOI] [PMC free article] [PubMed] [Google Scholar]
- 58.Triposkiadis F, Butler J, Abboud FM, et al. (2019). The continuous heart failure spectrum: Moving beyond an ejection fraction classification. European Heart Journal. 10.1093/eurheartj/ehz158. [DOI] [PMC free article] [PubMed] [Google Scholar]
- 59.Bers DM (2002). Cardiac excitation-contraction coupling. Nature. 10.1038/415198a. [DOI] [PubMed] [Google Scholar]
- 60.Kelshiker M, Mayet J, Unsworth B, & Okonko D (2014). Basal septal hypertrophy. Current Cardiology Reviews. 10.2174/1573403X09666131202125424. [DOI] [PMC free article] [PubMed] [Google Scholar]
- 61.Weiss HR, Neubauer JA, Lipp JA, & Sinha AK (1978). Quantitative determination of regional oxygen consumption in the dog heart. Circulatory Shock, 42(3), 394–401. 10.1161/01.res.42.3.394. [DOI] [PubMed] [Google Scholar]
- 62.Duncker DJ, Ishibashi Y, & Bache RJ (1998). Effect of treadmill exercise on transmural distribution of blood flow in hypertrophied left ventricle. American Journal of Physiology. Heart and Circulatory Physiology, 275(4 44–4), 1274–1282. 10.1152/ajpheart.1998.275.4.h1274. [DOI] [PubMed] [Google Scholar]
- 63.Tan YT, Wenzelburger F, Lee E, et al. (2009). The pathophysiology of heart failure with normal ejection fraction. Exercise echocardiography reveals complex abnormalities of both systolic and diastolic ventricular function involving torsion, untwist, and longitudinal motion. Journal of the American College of Cardiology. 10.1016/j.jacc.2009.03.037. [DOI] [PubMed] [Google Scholar]
- 64.Santos ABS, Roca GQ, Claggett B, et al. (2016). Prognostic relevance of left atrial dysfunction in heart failure with preserved ejection fraction. Circulation. Heart Failure 10.1161/CIRCHEARTFAILURE.115.002763. [DOI] [PMC free article] [PubMed] [Google Scholar]
- 65.Bianco CM, Farjo PD, Ghaffar YA, & Sengupta PP (2020). Myocardial mechanics in patients with normal LVEF and diastolic dysfunction. JACC: Cardiovascular Imaging. 10.1016/j.jcmg.2018.12.035. [DOI] [PubMed] [Google Scholar]
- 66.Park JJ, Park JB, Park JH, & Cho GY (2018). Global longitudinal strain to predict mortality in patients with acute heart failure. Journal of the American College of Cardiology. 10.1016/j.jacc.2018.02.064. [DOI] [PubMed] [Google Scholar]
- 67.Punnoose L, Burkhoff D, Rich S, & Horn EM (2012). Right ventricular assist device in end-stage pulmonary arterial hypertension: insights from a computational model of the cardiovascular system. Progress in Cardiovascular Diseases, 55(2), 234–243.e2. 10.1016/j.pcad.2012.07.008. [DOI] [PubMed] [Google Scholar]
- 68.Pezzuto S, & Ambrosi D (2014). Active contraction of the cardiac ventricle and distortion of the microstructural architecture. International Journal of Numerical Methods in Biomedical Engineering, 30(12), 1578–1596. 10.1002/cnm.2690. [DOI] [PubMed] [Google Scholar]
- 69.Pezzuto S, Ambrosi D, & Quarteroni A (2014). An orthotropic active-strain model for the myocardium mechanics and its numerical approximation. European Journal of Mechanics - A/Solids, 48(1), 83–96. 10.1016/j.euromechsol.2014.03.006. [DOI] [Google Scholar]