

I was very interested to read the recent report from NASCOLA (North American Specialized Coagulation Laboratory Association) containing external quality assessment (EQA) data related to laboratory testing practice for von Willebrand disease (VWD). 1 These data evaluated findings from laboratories in the United States of America (USA; ∼75% of participants) and Canada (∼25%), from years 2010 to 2019, for a total of 34 samples (10 normal, 13 type 1, 11 type 2 VWD). In this brief correspondence, I would like to compare and contrast these findings with those recently published by the Royal College of Pathologists of Australasia (RCPA) Quality Assurance Program (QAP), whose participants mainly derive from Australia (∼55%) and various international localities (including New Zealand, Malaysia, South Africa, Hong Kong, Europe). 2 This study assessed a similar number of samples (total n = 27; normal = 8, type 1 = 7, type 2 = 10), as distributed to participants, with a partially overlapping period of analysis of 2014–2021. 2 Nevertheless, it is recognised that the Royal College of Pathologists of Australasia Quality Assurance Program (RCPAQAP) data do represent a more recent overall date range.
Some other specific similarities and differences are noted in Table 1. The different reports, as reflective of differing geographic localities, also identified a markedly different composite von Willebrand factor (VWF) test profile for participants, despite having similar overall participant numbers. The two reports also differed somewhat on findings around specific assay variability (reported as coefficient of variation; CV), in part potentially due to method of data analysis, reporting format and specific plasma sample properties. NASCOLA reported the lowest CV for VWF:Ag, followed in turn by VWF:GPIbM (gain of function, mutant glycoprotein Ib [GPIb]), VWF:GPIbR (recombinant GPIb), VWF:Ab (monoclonal antibody based assay), VWF:RCo (ristocetin cofactor), and VWF:CB (collagen binding). Imprecision grew worse from normal to type 1 to type 2 VWD samples. 1 RCPAQAP also reported that assay imprecision grew worse from normal to type 1 to type 2 VWD samples, and that the lowest CVs were evident for VWF:Ag. 2 However, for VWF activity assays, and in some relative disagreement with NASCOLA findings, CVs were best for VWF:GPIbR and VWF:CB, and relatively worse for VWF:RCo and VWF:GPIbM (some summary data shown in Figure 1). These relative discrepancies can be explained in part by the type of tests utilised by participants. NASCOLA participants predominantly used VWF:RCo, VWF:Ab and VWF:GPIbM assays to assess ‘platelet binding activity’, whereas RCPAQAP participants predominantly used VWF:GPIbM, VWF:RCo, and VWF:GPIbR assays. In addition, for VWF:GPIbR, NASCOLA participants exclusively utilised LIA (latex immunoassay), whereas for RCPAQAP, participants utilised both LIA and CLIA (chemiluminescence immunoassay), with the latter increasing in usage over recent years. For VWF:CB, NASCOLA participants exclusively utilised ELISA (enzyme linked immunosorbent assay), whereas for RCPAQAP, participants utilised both ELISA and CLIA, again with CLIA methodology increasing in usage over recent years. As reported, 2 and as summarised in Figure 1, the CLIA methodology leads to substantially lower CVs for all assays (VWF:Ag, VWF:GPIbR, VWF:CB) for VWD samples, but especially for VWF:CB, and especially for type 2 VWD samples.
TABLE 1.
Summary of study comparisons
| Comparison | NASCOLA report 1 | RCPAQAP report 2 | |
|---|---|---|---|
| Date range of analysis | 2010–2019 | 2014–2021 | |
| Number of participants (range) | 55–72 | 55–76 | |
| Locality of participants | USA (∼75%) and Canada (∼25%) | Australia (∼55%), New Zealand (∼8%), Malaysia (∼12%), South Africa (∼8%), Hong Kong (∼8%), other (∼10%) | |
| Number and type of samples | N = 34: normal (10), type 1 (13), type 2 (11) | N = 27: normal (8), type 1 (7), type 2 (10), other (2) | |
| Total number of results assessed | 6035 | 4621 | |
| Main VWF tests utilised by participants (%) a | 2019 test data | 2019 test data | 2021 test data |
| 1a. VWF:Ag (LIA) | 97 (97) | 88 (88) | 91 (91) |
| 1b. VWF:Ag (ELISA) | 3 (3) | 4 (4) | 1 (1) |
| 1c. VWF:Ag (CLIA) | 0 (0) | 8 (8) | 8 (8) |
| 2a. VWF:RCo | 38 (39) | 33 (35) | 27 (28) |
| 2b. VWF:GPIbR (LIA) | 4 (4) | 11 (12) | 14 (15) |
| 2c. VWF:GPIbR (CLIA) | 0 (0) | 15 (16) | 14 (15) |
| 2c. VWF:GPIbM (LIA) | 17 (17) | 30 (32) | 39 (41) |
| 2d. VWF:Ab | 31 (32) | 4 (4) | 1 (1) |
| 3a. VWF:CB (ELISA) | 14 (100) | 25 (64) | 26 (65) |
| 3b. VWF:CB (CLIA) | 0 | 14 (36) | 14 (35) |
Abbreviations: Ab, antibody; Ag, antigen; CB, collagen binding; CLIA, chemiluminescence immunoassay; ELISA, enzyme linked immunosorbent assay; GPIbM, mutant (recombinant) GPIb; GPIbR, recombinant glycoprotein Ib; LIA, latex immunoassay; NASCOLA, North American Specialized Coagulation Laboratory Association; RCo, ristocetin cofactor; RCPAQAP, Royal College of Pathologists of Australasia Quality Assurance Program; VWF, von Willebrand factor.
Using latest available and comparative years data as comparison (2019 for NASCOLA; both 2019 and 2021 for RCPAQAP); % is shown both as estimate of entire participant group as well as for separate test type groups of antigen (group 1), ‘platelet binding’ (group 2), and collagen binding (group 3); for example, only 14% of NASCOLA participants performed VWF:CB, but all (100%) did so by ELISA; in contrast, around 40% of RCPAQAP participants performed VWF:CB, with ∼65% performing ELISA, and ∼35% performing CLIA. Bold type indicates predominant methods used by participants of respective program. For VWF:RCo, most RCPAQAP data is reflective of automated assays. In 2019 and 2021, only a single RCPAQAP participant reported to using an aggregometer (i.e., semi‐automated method).
FIGURE 1.
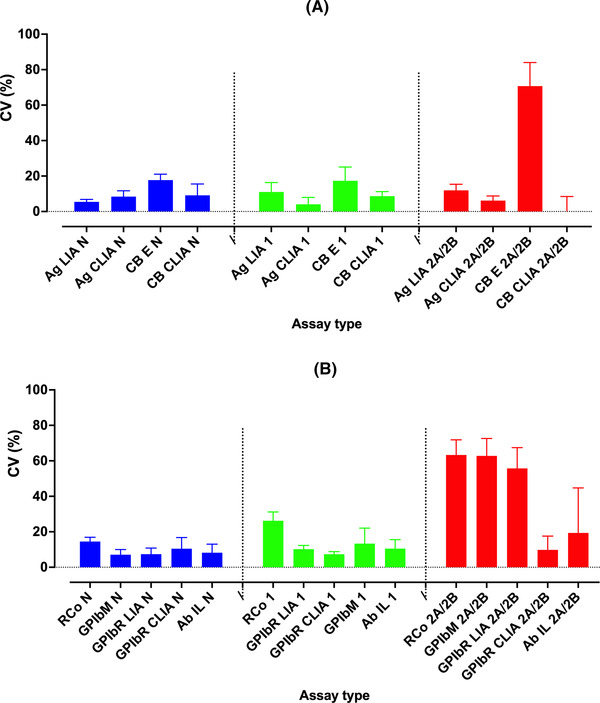
Comparative VWF assay variability, summarizing data from the RCPAQAP. 2 Data shown as coefficient of variation (CV; percent; left y‐axis), as bars of median and upper error bar showing upper third quartile range, for main assay types used by RCPAQAP participants. (A) VWF:Ag and VWF:CB assays; (B) Platelet glycoprotein Ib (GPIb) binding assays (VWF:RCo, VWF:GPIbR, VWF:GPIbM) and VWF:Ab. In brief, assay variation increases for testing of normal (blue) to type 1 (green) to type 2 (red) VWD samples. CVs were highest for type 2 VWD and for VWF:CB by ELISA, and for VWF:RCo, and VWF:GPIbM and VWF:GPIbR by LIA. In type 2 VWD, high CVs are partially due to higher variation per se, and also partially explained by the reporting of many values very close to 0 U/dl, thereby mathematically affecting the calculation of CVs. CLIA based methods tended towards the lowest CVs for all available methods. For VWF:RCo, most data is reflective of automated assays. In 2021, only a single participant reported to using an aggregometer (i.e., semi‐automated method). Even in 2014, most participants (72%) had already moved to an automated VWF:RCo assay. Ab, antibody; Ag, antigen; CB, collagen binding; GPIbR, recombinant glycoprotein Ib; GPIbM, mutant (recombinant) GPIb; RCo, ristocetin cofactor; VWF, von Willebrand factor; CLIA, chemiluminescence immunoassay; ELISA, enzyme linked immunosorbent assay; LIA, latex immunoassay
The method of data analysis between the NASCOLA 1 and RCPAQAP 2 studies also differed somewhat, with NASCOLA omitting from the imprecision calculations results below the respective laboratory's lower limit of detection (e.g., < .10 IU/ml); in contrast, the RCPAQAP essentially used a value one below the reported limit as the de facto value (e.g., a value reported as <10 U/dl was taken as 9 U/dl for imprecision calculations). The RCPAQAP would defend this practice, as such values essentially reflect the default reportable value, and exclusion of such data may artefactually improve the calculated CVs of assays with relatively poor limits of detection. Lower limit of detection limits were not generally reported by NASCOLA, 1 but for RCPAQAP data, this was comparatively worse for VWF:RCo and VWF:GPIbM assays. Poor lower limit of detection is particularly problematic for type 2 VWD samples, since this also affects the ability of VWF activity assays to effectively identify the loss of high molecular weight (HMW) VWF in type 2A/2B samples, as well as compromising the detection of loss of VWF activity in type 2A/2B/2M samples. 3 For example, the RCPAQAP data set included nine samples with loss of HMW VWF, 2 for a total of 184 test results reported by participants for VWF:RCo and 185 test results reported for VWF:GPIbM. Of these, test results were reported as ‘ < ’ a value in 35/184 (19%) for VWF:RCo, and 56/185 (30.3%) for VWF:GPIbM, effectively identifying the laboratory's limit of detection. For VWF:RCo, this included laboratories reporting as <16U/dl (n = 3), <12 U/dl (n = 2), <10 U/dl (n = 17), and <8 U/dl (n = 7). For VWF:GPIbM, this included laboratories reporting as <15U/dl (n = 7) and <10 U/dl (n = 2); however, the majority of such events for VWF:GPIbM were where laboratories reported <4 U/dl (n = 37), which essentially identifies the lower limit of detection for this assay from the manufacturer's product information. It is not clear why laboratories report VWF:GPIbM as ‘<15 U/dl’ or ‘<10 U/dl’, when they should be able to achieve reporting values of <4 U/dl, as per the manufacturer product information, and as per most laboratories participating in the RCPQAP, and as also confirmed in our local evaluations. In contrast, there were very few such events for laboratories using VWF:GPIbR and VWF:CB, especially for CLIA based methods, for which the effective lower limit of detection is close to 0 U/dl of VWF, similar to one stage factor assays used for haemophilia investigation. According to the manufacturer's product information, detection limits for CLIA based methods are, respectively (U/dl): VWF:Ag .13, VWF:GPIbR .17, VWF:CB .2. We have confirmed detection limits close to these in our own evaluations. 4
As a summary conclusion:
whereas NASCOLA identified relative high variability for VWF:CB, it needs to be clarified that this was exclusively using ELISA based methods. 1 RCPAQAP data 2 largely confirms relative high variability for VWF:CB by ELISA, but conversely identifies relative low variability for VWF:CB by CLIA (Figure 1), which is increasing in usage in our geographic locality, 2 but which is unavailable in North America. 5 , 6 In addition, a higher number of RCPAQAP participants (40% overall) report VWF:CB data, whereas only 14% of NASCOLA participants do so (Table 1).
whereas NASCOLA identified relative better reproducibility for VWF:GPIbM compared to VWF:GPIbR, it needs to be clarified that this comparison was exclusively using LIA based methods, and it is unclear if exclusion of data related to lower limits of detection affected these conclusions. Also, the NASCOLA data set for VWF:GPIbM was substantially larger (17% of participants) than that for VWF:GPIbR (4% of participants; Table 1). In contrast, the RCPAQAP dataset essentially found VWF:GPIbR methodology, in particular when performed by CLIA, 2 to provide better utility than VWF:GPIbM, inclusive of lower CV (Figure 1) and better discrimination of type 1 versus type 2 VWD samples. 2 Moreover, the RCPAQAP data set was more evenly distributed between VWF:GPIbM (39% participants) and VWF:GPIbR (28%; Table 1). In summary, the reasons that the studies come to different conclusions here is perhaps less based upon the imbalance of tests performed by VWF:GPIbM versus VWF:GPIbR, but due to the use of LIA versus CLIA, and since the NASCOLA VWF:GPIbR data set is considerably smaller than the RCPAQAP, one could have lower confidence in the conclusion of the NASCOLA project around these matters.
Thirdly, a high proportion of NASCOLA participants (32%) utilise the VWF:Ab assay, this being one of only two FDA‐cleared VWF activity assays (the other being VWF:RCo), 6 whereas very few RCPAQAP participants (1%) do so (Table 1).
Finally, such differences may also have an impact on ‘accuracy of VWD diagnosis’. The NASCOLA study reported a “good consensus for Type 1 VWD samples (median 59%, IQR 9%), and fair for Type 2 VWD samples (median 44%, IQR 21%)’, reaching ‘90% (IQR 9%) and 67% (IQR 17%)’ for Type 1 VWD, and Type 2 VWD samples, respectively, after removal of all ‘no conclusion’ response.” Accordingly, even after removal of all ‘no conclusion’ responses, the potential error rate for Type 1 VWD, and Type 2 VWD samples could be taken as averaging around 10% and 33%, respectively. In contrast, the RCPAQAP analyses reported an error rate of 7.5% and 14.3% for Type 1 VWD and Type 2 VWD samples, respectively. Thus, there is potential for improvement in VWD diagnosis in North America by adoption of more modern diagnostic tests.
This comparative data reflects on differing experiences in differing geographic localities, according to availability and usage of different VWF tests and methodologies, as available in these localities. The USA has a particularly restrictive regulatory process for ‘approval’ (‘clearance’) of in vitro diagnostics (IVDs), inclusive of those for VWF testing, and requiring extensive validation. 5 Whereas most VWF assays and methodologies are available to laboratories in Australia, Europe and Asia, relatively few are cleared for use in the USA. The current restriction of VWF platelet‐binding assays in USA to primarily VWF:RCo and VWF:Ab (Table 1), both of which show poor performance against the more recently developed VWF:GPIbR and VWF:GPIbM assays (especially in view of the excellent precision and lower limit of detection of the CLIA‐based methods), compromises VWD diagnostics in USA. 1 , 2 , 4 , 5 , 6 , 7 , 8 , 9 It is therefore hoped that these findings will promote adoption of better diagnostic tests in North America and also positively inform future guidelines for diagnosis of VWD. 5 , 10
CONFLICT OF INTEREST
The author declares no conflict of interest.
ACKNOWLEDGEMENTS
The author thanks various current and past employees of NSW Health Pathology and the Royal College of Pathologists of Australasia (RCPA) Quality Assurance Program (QAP) for past contributions, thereby permitting evaluation of some data for educational purposes in the current manuscript. The views expressed herein are those of the author and are not necessarily those of NSW Health Pathology or the RCPAQAP. There was no specific funding for this work. NSW Health Pathology, as an employer of the author, is acknowledged for in kind support that permits some allocation of time for completion of such works.
Open access publishing facilitated by Charles Sturt University, as part of the Wiley ‐ Charles Sturt University agreement via the Council of Australian University Librarians.
Favaloro EJ. Comparing the quality of testing for von Willebrand disease in different geographic localities. Haemophilia. 2022;28:193–196. 10.1111/hae.14499
DATA AVAILABILITY STATEMENT
Please contact the author.
REFERENCES
- 1. Abdulrehman J, Ziemba YC, Hsu P, et al. Diagnosis of von Willebrand disease: an assessment of the quality of testing in North American laboratories. Haemophilia. 2021;27(6):e713‐e720. [DOI] [PubMed] [Google Scholar]
- 2. Favaloro EJ, Dean E, Arunachalam S, Vong R, Mohammed S. Evaluating errors in the laboratory identification of von Willebrand disease using contemporary von Willebrand factor assays. Pathology. 2021;S0031‐3025(21):00433‐00435. [DOI] [PubMed] [Google Scholar]
- 3. Favaloro EJ, Bonar R, Marsden K. on behalf of the RCPA QAP Haemostasis Committee. Clin Lab Sci. 2008;21:178‐185. [PubMed] [Google Scholar]
- 4. Favaloro EJ, Mohammed S. Evaluation of a von Willebrand factor three test panel and chemiluminescent‐based assay system for identification of, and therapy monitoring in, von Willebrand disease. Thromb Res. 2016;141:202‐211. [DOI] [PubMed] [Google Scholar]
- 5. Favaloro EJ. Commentary on “ASH ISTH NHF WFH 2021 guidelines on the diagnosis of VWD”: reflections based on recent contemporary test data. Blood Adv. 2022;6(2):416‐419. [DOI] [PMC free article] [PubMed] [Google Scholar]
- 6. Favaloro EJ, Lippi G. Recent advances in mainstream hemostasis diagnostics and coagulation testing. Semin Thromb Hemost. 2019;45(3):228‐246. [DOI] [PubMed] [Google Scholar]
- 7. Favaloro EJ, Bonar RA, Meiring M, et al. Evaluating errors in the laboratory identification of von Willebrand disease in the real world. Thromb Res. 2014;134(2):393‐403. [DOI] [PubMed] [Google Scholar]
- 8. Favaloro EJ, Bonar RA, Mohammed S, et al. Type 2M von Willebrand disease—more often misidentified than correctly identified. Haemophilia. 2016;22(3):e145‐e155. [DOI] [PubMed] [Google Scholar]
- 9. Favaloro EJ, Bonar R, Hollestelle MJ, et al. Differential sensitivity of von Willebrand factor activity assays to reduced VWF molecular weight forms: a large international cross‐laboratory study. Thromb Res. 2018;166:96‐105. [DOI] [PubMed] [Google Scholar]
- 10. James PD, Connell NT, Ameer B, et al. ASH ISTH NHF WFH 2021 guidelines on the diagnosis of von Willebrand disease. Blood Adv. 2021;5(1):280‐300. [DOI] [PMC free article] [PubMed] [Google Scholar]
Associated Data
This section collects any data citations, data availability statements, or supplementary materials included in this article.
Data Availability Statement
Please contact the author.