

Abstract
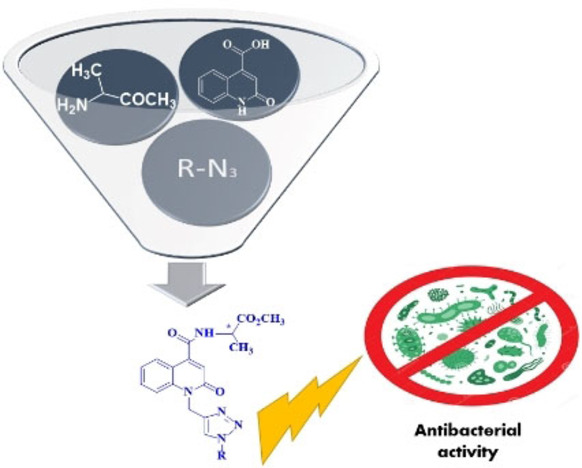
Due to the ever‐increasing antimicrobial resistance there is an urgent need to continuously design and develop novel antimicrobial agents. Inspired by the broad antibacterial activities of various heterocyclic compounds such as 2‐quinolone derivatives, we designed and synthesized new methyl‐(2‐oxo‐1,2‐dihydroquinolin‐4‐yl)‐L‐alaninate‐1,2,3‐triazole derivatives via 1,3‐dipolar cycloaddition reaction of 1‐propargyl‐2‐quinolone‐L‐alaninate with appropriate azide groups. The synthesized compounds were obtained in good yield ranging from 75 to 80 %. The chemical structures of these novel hybrid molecules were determined by spectroscopic methods and the antimicrobial activity of the compounds was investigated against both bacterial and fungal strains. The tested compounds showed significant antimicrobial activity and weak to moderate antifungal activity. Despite the evident similarity of the quinolone moiety of our compounds with fluoroquinolones, our compounds do not function by inhibiting DNA gyrase. Computational characterization of the compounds shows that they have attractive physicochemical and pharmacokinetic properties and could serve as templates for developing potential antimicrobial agents for clinical use.
Keywords: 2-quinolone derivatives; 1,2,3-triazole; 1,3 dipolar cycloaddition; antibacterial activity; DNA gyrase; molecular modeling
Antibiotics that click: Inspired by the broad antibacterial activities of various heterocyclic compounds such as 2‐quinolone derivatives, we designed and synthesized new methyl‐(2‐oxo‐1,2‐dihydroquinolin‐4‐yl)‐L‐alaninate‐1,2,3‐triazole derivatives via 1,3‐dipolar cycloaddition reaction of 1‐propargyl‐2‐quinolone‐L‐alaninate with appropriate azide groups.
Introduction
In the face of the continuous increase of antimicrobial resistance (AMR), we are on the verge of losing a whole arsenal of antimicrobial compounds that are still effective in the clinic. [1] For example, quinolone antibiotics represent one of the compound classes whose use has been compromised by the increasing emergence of resistant strains. [2] Currently many research groups are working on the design of new antimicrobial drugs and, namely, design of molecules containing heterocyclic rings, which is encouraged by the fact that such molecules have been shown to exhibit a wide range of biological activities.[ 3 , 4 , 5 , 6 , 7 , 8 , 9 , 10 ]
In this context, the antimicrobial importance of polyheterocyclic systems such as 2‐quinolones is well established. The 2‐quinolone moiety is among the most widely used synthetic scaffolds that researchers have used for successful design of new antimicrobial agents.[ 11 , 12 , 13 , 14 , 15 , 16 , 17 , 18 , 19 , 20 , 21 , 22 , 23 , 24 , 25 ] One useful strategy has been to create hybrid molecules [26] using two different pharmacophoric moieties with antimicrobial effects. 2‐Quinolones could be combined with, for example, the privileged scaffolds of 1,2,3‐ or 1,2,4‐triazoles[ 27 , 28 , 29 ] that have both been widely applied not only in medicinal chemistry[ 30 , 31 , 32 , 33 , 34 , 35 , 36 , 37 , 38 ] but also in material science.[ 39 , 40 ]
For instance, Ghosh and coworkers [41] reported the synthesis of novel hybrids of 1,2,4‐triazolo[3,4‐b][1,3,4]thiadiazines and substituted phenylquinolin‐2‐one moieties. The synthesized compounds exhibited moderate to good antibacterial activities against gram‐positive and gram‐negative bacteria. Compound I (Figure 1) showed the highest activity at the minimum inhibitory concentration (MIC) values of 1 μg/mL against Staphylococcus aureus, 2 μg/mL against Escherichia coli and 4 μg/mL against Pseudomonas aeruginosa.
Figure 1.
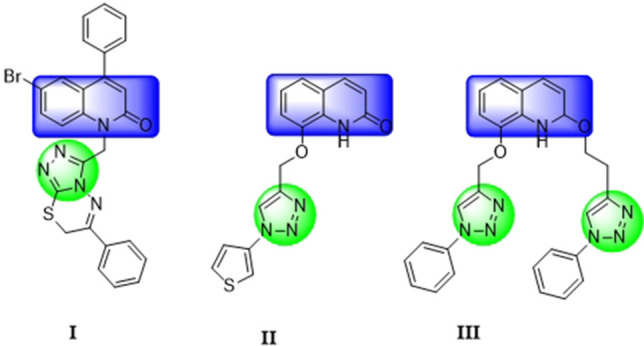
Some antibacterial agents based on 2‐quinolone‐1,2,3‐triazoles.
Also, Gümüş and Okumuş [42] synthesized quinolone‐substituted 1,2,3‐triazoles. They used an efficient, alternative method for the classical copper(I)‐catalyzed azide‐alkyne cycloaddition reaction (CuAAC) of the mono and bis O‐/N‐propargylated 2‐quinolone derivatives with substituted azides. The one‐pot synthesis included two steps of which the first step converted the Lewis base l‐proline to its catalytic salt form and the second step produced the quinolone‐substituted 1,2,3‐triazole derivatives resulting from the reaction of sodium azide with various aromatic and benzylic halides. The synthesized products were evaluated for their antibacterial activity against both gram‐negative and gram‐positive bacteria using the disk diffusion method. Compounds II and III (Figure 1) showed weak (7‐mm inhibition zone) antibacterial activity against Bacillus cereus whereas the other compounds did not exhibit any activity against the studied bacterial strains.
The goal of the present work was to prepare novel heterocyclic hybrid antimicrobials that contain both the 2‐quinolone and the 1,2,3‐triazole moiety. Moreover, based on our previous work on quinoline‐carboxamide derivatives of amino acids, [11] we also incorporated L‐alanine, a natural amino acid into these novel compounds. Specifically, quinoline‐carboxamide‐L‐alanine (1 a, 1 b) was selected as a nucleus for the synthesis of the new compounds because it was produced with good yield and, most importantly, it showed the best antibacterial activity compared to the other studied amino acid derivatives. [11]
We have previously applied the well‐known Huisgen 1,3‐dipolar cycloaddition reaction[ 43 , 44 , 45 ] using azides as dipoles across the triple bonds of dipolarophiles for the synthesis of new hybrid triazoles.[ 46 , 47 , 48 ] The metal‐catalyzed version of this reaction has been characterized as one of the most important tools in click chemistry[ 49 , 50 ] due to its “orthogonal character vs. the reactivity of most functional groups, complete regioselectivity in favor of the 1,4‐disubstitued‐1,2,3‐triazole product, mild reaction conditions, and easy installation of the required azide and terminal alkyne moieties in the reactive partners.” [51] Here, we employed the copper‐catalyzed 1,3‐dipolar cycloaddition reaction using propargyl‐2‐quinolone‐L‐alaninate as the dipolarophile and azides as the dipoles to synthesize novel hybrids of the two privileged scaffolds. In addition, due to the close similarity of 2‐quinolones to 4‐quinolones, we investigated whether these hybrid compounds could inhibit bacterial DNA gyrase to get insight into the mode of their antibacterial activity.
Results and Discussion
Synthesis of the dipolarophiles: 1‐propargyl‐2‐oxo‐1,2‐dihydroquinoline‐4‐carboxamides 2 a/b
The reaction of the 2‐quinolone derivatives with propargyl bromide under phase transfer catalysis (PTC)[ 52 , 53 , 54 , 55 ] conditions (liquid‐solid) in dimethylformamide in the presence of potassium carbonate and tetra‐n‐butylammonium bromide (TBAB) led to 1‐propargyl‐2‐quinolone (2 a, 2 b) with good yields. The synthesis of the target compounds 2 a and 2 b was achieved by first preparing the quinolone‐carboxamides 1 a and 1 b using the coupling reaction between 2‐quinolone carboxylic acids (a, b) and L‐alanine‐OMe in the presence of HBTU as an activating agent and triethylamine (TEA) and chloroform (CHCl3) as solvents for 12 hours at room temperature. Thereafter, an N−C bond was formed between methyl (2‐oxo‐1,2‐dihydroquinolin‐4‐yl)‐L‐alaninate (1 a, 1 b) and propargyl bromide by an N‐alkylation reaction using TBAB as a catalyst and potassium carbonate (K3CO3) as a base in dimethylformamide (DMF) (Scheme 1).
Scheme 1.
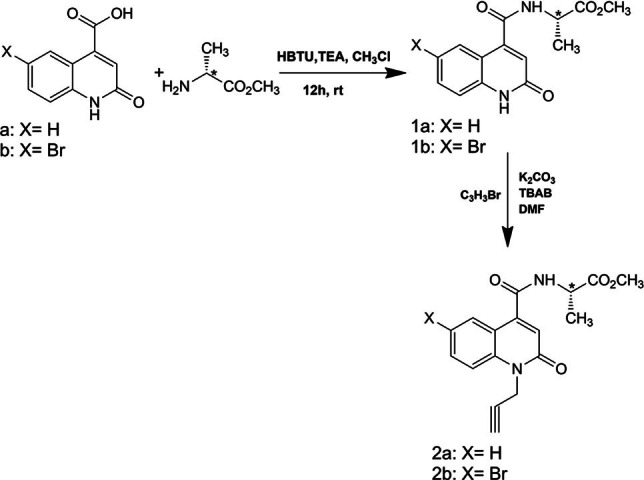
Alkylation of compounds 1 a and 1 b with propargyl bromide.
Compounds 2 a and 2 b were characterized by 1H, 13C NMR spectroscopy and ESI‐TOF mass‐spectrometry. The 1H NMR spectrum of 2a revealed the presence of a doublet assigned to alkyne proton CH at δ=2.23 ppm with a coupling constant 4J=2.4 Hz, while two doublet of doublets signals at δ=5.07 ppm and δ=4.96 ppm illustrate the presence of the non‐isochronous protons of CH2−N with coupling constants 4J=2.4 Hz and 2J=17.4 Hz. In addition, the protons of the methyl group of alanine CH3 appear in a form of a doublet at δ=1.60 ppm with a coupling constant 3J=7.2 Hz. The 13C NMR spectra indicate the signals of carbonyl groups of quinoline, peptide amide and the ester group at δ=172.16 ppm, δ=165.66 ppm and δ=160.49, respectively, while the quaternary carbon C−CH appears at 77.26 ppm. A signal of alkyne carbon CH resonated at δ=72.70 ppm, whereas the signal of carbon CH2−N appears at δ=31.69 ppm, confirming the presence of the propargyl group. ESI‐TOF mass spectrum of compound 2 a showed [M+Na]+ peak at m/z=365.0998, which is in agreement with its molecular formula C17H16N2O4. All spectroscopic techniques used confirm the synthesis of the target compounds.
Synthesis of hybrid quinolone‐aminoester‐triazoles 3a1–3a6 and 3b3–3b4
We then synthesized new quinolone‐triazole derivatives via 1,3‐dipolar cycloaddition of various azides and 1‐propargyl‐2‐oxo‐1,2‐dihydroquinoline‐4‐carboxamides using non‐catalyzed thermal activation in ethanol and a simple and inexpensive catalyst, CuSO4 during 48 hours at room temperature (Scheme 2).
Scheme 2.
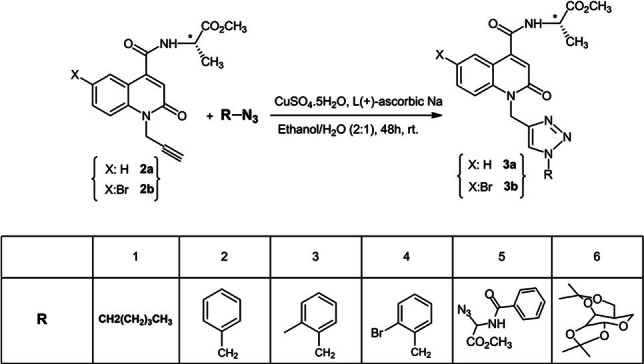
Synthesis of new 1,2,3‐triazole‐quinolone‐L‐alaninate hybrids.
All newly synthesized compounds (3a1 –3a6 and 3b3 –3b4 ; Figure 2) were purified on liquid chromatography columns using silica gel as a stationary phase. Good yields (80 %) were obtained for all other compounds except for compounds 3a1 and 3a5 that had a bit lower yield (75 %). All compounds were characterized by 1H, 13C, DEPT, or COSY 1H−1H NMR and ESI‐TOF mass‐spectrometry.
Figure 2.
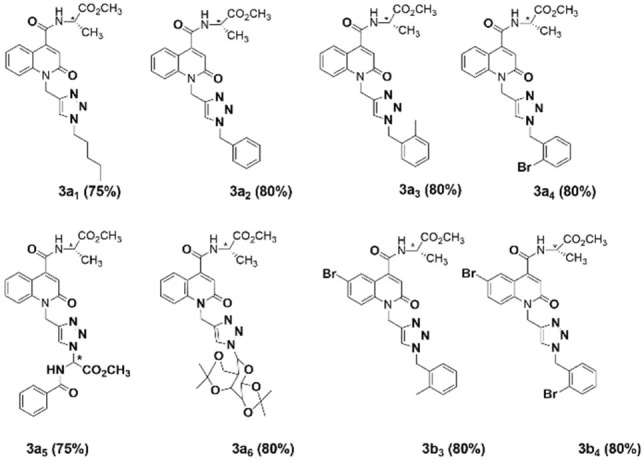
Structures of novel 2‐quinolone‐L‐alaninate‐1,2,3‐triazoles. In all cases, the yields presented are the isolated yields after the purification.
Structural characterization of compound 3a2
The 1H NMR spectrum of compound 3a2 (Supporting Information, p. S4) shows the presence of a doublet at δ=1.57 ppm, corresponding to the CH3 group of the alanine with a coupling constant 3J=7.2 Hz. An intense singlet signal assigned to the methoxy ester group (CH3−O) appears at δ=3.78 ppm, while a doublet of quadruplet illustrates the presence of a proton related to the asymmetric carbon at δ=4.8 ppm with both corresponding coupling constants 3J=7.5 Hz and 3J=7.2 Hz. The non‐isochronous protons of CH2−Nquinoline are manifested in a form of two doublets at δ=5.29 ppm and δ=5.43 ppm, while the singlet at δ=6.77 ppm is correlated to the ethylenic proton (=C−H) of the quinolone ring. The spectral region between δ=7.21–7.93 ppm is assigned to aromatic protons including the singlet signal of triazole protons at δ=7.48 ppm.
According to 2D NMR spectrum (COSY 1H−1H) of compound 3a2 (Supporting Information, p. S5), the asymmetric *CH proton of the alanine moiety presents two different coupling constants (3J=7.5 Hz and 3J=7.2 Hz) confirmed by the presence of contours generally related to the neighboring N−H amide as well as the CH3 protons of the alanine. Concerning the two non‐isochronous CH2−Nquinoline protons, each one appears as a doublet with different chemical shifts at δ=5.29 ppm and δ=5.43 ppm. On the other hand, the presence of two isochronous CH2−Ntriazole protons is revealed by the singlet signal at δ=5.37 ppm. Moreover, the proton of CH is clearly manifested by an intense and resolved singlet peak arising in the aromatic proton area at δ=7.48 ppm.
In addition, the 13C NMR spectrum of compound 3a2 (Supporting Information, p. S4) presents a signal related to CH3 of the alanine group at δ=18.03 ppm, whereas the CH2−Nquinoline resonates at δ=38.18 ppm. The arising peak at δ=48.53 ppm is ascribed to the carbon of the methoxy group (CH3−O), while the two deshielded signals at δ=52.72 ppm and 53.5 ppm are attributed to asymmetric carbon (*C) and −CH2−N of the triazole, respectively. The spectral region between δ=117–134 ppm is assigned to both aromatic and triazolic carbons, of which the latter appears at δ=123.13 ppm. The three quaternary carbons of the amide, quinoline amide and ester functional groups are confirmed by the presence of the chemical shifts at δ=172.82 ppm, δ=165.87 ppm and δ=161.25 ppm, respectively. The chemical shifts of the proton and the tertiary carbon of the 1,2,3‐triazole group are affected by the nature of the substituent on the triazole ring and thus exhibit variable values (Supporting Information, Table S1).
ESI‐TOF mass spectrum of compound 3a2 showed [M+Na]+ peak at m/z=468.1642, which is in agreement with its molecular formula C25H24N4O4. The structural characterization of all the other target compounds is presented in the experimental section (the NMR spectra are provided in Supporting Information, pp. S2‐S17).
Antibacterial activity
The newly synthesized compounds were screened for their potential antibacterial activity against Escherichia coli ATCC 25922, Staphylococcus aureus ATCC 29213, Pseudomonas aeruginosa ATCC 27853 and Bacillus subtilis ATCC 3366. Compounds were also screened for their potential antifungal activity against Candida albicans and Aspergillus niger.
The preliminary antimicrobial screening of the synthesized compounds was carried out using the disc diffusion method. [56] The diameters of the inhibition zones for the tested compounds are shown in Figure 3. Compound 3a4 showed the largest diameter of the inhibition zones (d=18 mm) against Bacillus subtilis. Compound 3a6 formed at least a 10‐mm inhibition zone against all the four bacterial strains and the two fungi, of which the largest diameters (15–16 mm) were against Pseudomonas aeruginosa, Bacillus subtilis and Aspergillus niger. Compounds 3a1 , 3a4 , 3b3 and 3b4 did not show any antifungal activity in this screening assay.
Figure 3.
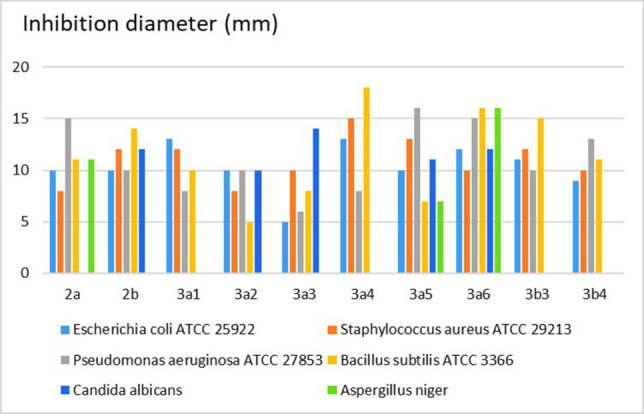
Results of the disc diffusion method for compounds 2 a–2 b, 3a1 –3a6 and 3b3 –3b4 .
Thereafter the MIC values were determined with the broth microdilution method. [57] Table 1 summarizes the antibacterial and antifungal activities of the tested compounds.
Table 1.
Antibacterial and antifungal activities as minimum inhibitory concentration (MIC, mg/mL) of compounds 2a, 2b, 3a1–3a6 and 3b3–3b4.
|
Compound |
Escherichia coli ATCC 25922 |
Staphylococcus aureus ATCC 29213 |
Pseudomonas aeruginosa ATCC 27853 |
Bacillus subtilis ATCC 3366 |
Candida albicans |
Aspergillus niger. |
|---|---|---|---|---|---|---|
|
2 a |
0.62 |
2.5 |
0.62 |
5 |
NA |
10 |
|
2 b |
0.62 |
2.5 |
2.5 |
2.5 |
10 |
NA |
|
3a1 |
0.078 |
1.25 |
2.5 |
0.31 |
NA |
NA |
|
3a2 |
0.31 |
2.5 |
2.5 |
2.5 |
10 |
NA |
|
3a3 |
0.039 |
1.25 |
1.25 |
2.5 |
10 |
NA |
|
3a4 |
2.5 |
0.31 |
2.5 |
0.078 |
NA |
NA |
|
3a5 |
0.0195 |
0.039 |
0.078 |
0.31 |
5 |
10 |
|
3a6 |
0.00975 |
0.078 |
0.62 |
0.039 |
10 |
5 |
|
3b3 |
0.62 |
2.5 |
0.62 |
0.31 |
NA |
NA |
|
3b4 |
0.31 |
2.5 |
1.25 |
0.00975 |
NA |
NA |
Many of the compounds showed a good to moderate antibacterial and antifungal activity. Compounds 3a6 , 3a4 and 3b4 acted as very good antibacterial agents against B. subtilis ATCC 3366 with MIC values of 0.039 mg/mL, 0.078 mg/mL and 0.00975 mg/mL, respectively. Likewise, compounds 3a3 , 3a5 and 3a6 exhibited very good activity against E. coli ATCC 25922 with MIC values of 0.039 mg/mL, 0.0195 mg/mL and 0.00975 mg/mL, respectively. Compound 3a5 showed also good activity against S. aureus ATCC 29213 and P. aeruginosa ATCC 27853 with MIC values of 0.039 mg/mL and 0.078 mg/mL, respectively. Compounds 3a5 and 3a6 showed altogether better antifungal activity than the rest of the compounds, although with a relatively weak effect (MIC values against C. albicans and A. niger, respectively, were as high as 5 mg/mL).
Table 1 indicates that the substituents may also affect the biological activity of the synthesized compounds 3a1 –3a6 and 3b1 –3b6 . Comparison of the antibacterial activities of the tested compounds suggests that the substituents R/X=C7H6Br/Br convey potent antibacterial activity against B. subtilis. The substituents R/X=galactose/H cause a higher antibacterial activity against E. coli than what the other compounds have, perhaps due to the presence of the glucide group that may have a role in the bactericidal mechanism. Also, the groups R/X=glycinate/H convey potent antibacterial activity against S. aureus and P. aeruginosa, possibly due to the asymmetric group. Moreover, the substituents R/X=galactose/H and glycinate/H have positional interference, as can be observed from the antifungal activity results of the corresponding compounds against A. niger and C. albicans, respectively.
DNA gyrase inhibition
Since 2‐quinolones resemble 4‐quinolones such as the fluoroquinolone ciprofloxacin and aminocoumarins such as novobiocin, we wanted to investigate whether our hybrid compounds could inhibit the same target as ciprofloxacin and novobiocin, i. e., DNA gyrase, the bacterial type II topoisomerase.[ 58 , 59 ] We first carried out molecular docking studies of the synthesized hybrid compounds at the crystal structures of E. coli and S. aureus DNA gyrase. We hypothesized that these compounds might preferably bind into the fluoroquinolone site in the gyrase A subunit (GyrA) or the coumarin binding site in the gyrase B subunit (GyrB). However, we also investigated their binding at the so‐called novel bacterial topoisomerase inhibitor (NBTI) binding site formed between the two GyrA subunits. [60] The docking results clearly suggest that our novel compounds would not have a good binding affinity or interactions at any of these binding sites, compared to the reference inhibitors obtained from their respective DNA gyrase crystal complexes (for the detailed analysis, please see Supporting Information, pp. S18–S23, Tables S2, S3 and Figures S1–S5).
We then determined the inhibitory activities of our compounds against E. coli DNA gyrase in supercoiling/relaxation assays. The assay results confirmed our prediction: no compound showed DNA gyrase inhibition at 100 μM concentration.
In silico characterization of the novel hybrid compounds
We further characterized the novel quinolone‐triazole derivatives using different computational tools. We employed quantum mechanics (QM) to calculate the compounds’ pK a values and possible tautomers in water. The pK a prediction was performed for the C=O group of the 2‐quinolone moiety, the N−N=N and C−N=N groups of the triazole ring, and NH of the amide groups of the synthesized compounds (Table 2). The pK a values are very low for the ‘basic’ groups (carbonyl oxygen/triazole nitrogens) (Table 2), which means that they either do not get protonated at all at pH range 1–14 (those with negative pK a values) or it protonates only (partially) at very low pH (the nitrogen atoms with positive pK a values). The C−N=N nitrogen of 3a1 has the highest pK a, suggesting that of all the compounds it is the most protonated at pH 1–2. Furthermore, the amide NH is so weakly acidic (i. e., has high pK a values) that it will not be able to donate its proton in the physiological pH range. Consequently, if taken orally, absorption of these novel compounds (in the unprotonated form) could start slowly already in the stomach and would then continue in the small intestine where the compounds are completely unprotonated and, thus, can penetrate the epithelial cell membrane well. The tautomer prediction suggests that none of the novel compounds has tautomers in water (Supporting Information, Table S5).
Table 2.
Predicted pK a values of the synthesized compounds.
|
Compound |
pK a |
|||
|---|---|---|---|---|
|
C=O[a] (basic) |
N−N=N (basic) |
C−N=N (basic) |
NH[b] (acidic) |
|
|
3a1s |
−2.2 |
−1.05 |
2.31 |
15.62 |
|
3a2 |
−3.41 |
−2.76 |
0.94 |
15.38 |
|
3a3 |
−2.58 |
−1.78 |
1.16 |
14.84 |
|
3a4 |
–[c] |
−1.79 |
1.04 |
15.44 |
|
3a5 |
−2.28 |
−2.59 |
1.05 |
19.94/12.78[d] |
|
3a6 |
−2.3 |
−3.62 |
0.97 |
16.01 |
|
3b3 |
−2.91 |
−1.59 |
1.88 |
14.81 |
|
3b4 |
−2.91 |
−1.62 |
1.23 |
15.11 |
Colour scheme: green for higher and yellow for lower values. Notes: [a] C=O in the 2‐quinolone ring; [b] amide NH of the L‐alaninate moiety; [c] not possible to determine; [d] NH of the benzamide moiety.
In addition, during the QM geometry optimization, the highest occupied (HOMO) and the lowest unoccupied (LUMO) molecular orbitals were calculated to evaluate the stability of the compounds. As electrons are constantly shuttling between the molecular orbitals, the smaller the gap between these orbitals is, the more easily they can jump between the different states. These molecular orbitals are concentrated on the pi‐electron‐rich quinolone ring system, indicating a good conjugation network in this region (Supporting Information, Figure S6). This conveys the compounds the ability to absorb light at longer wavelengths, which provides additional stability to the molecules upon exposure to UV radiation. Thus, the smaller the gap between HOMO and LUMO energies is the more stable the compound is. In general, the molecular orbital energies are relatively similar between the compounds. Compound 3a5 had the smallest HOMO‐LUMO energy gap, while compound 3a1 had the largest energy gap (Supporting Information, Table S5).
We also predicted a range of pharmacokinetic and toxicity properties (ADMET properties; absorption, distribution, metabolism, excretion, and toxicity) of the novel compounds. Overall, the ADMET predictions suggest no apparent toxicity to host cells. The predicted values of various selected properties are shown in Table 3. None of the compounds is predicted to be CNS (central nervous system) active although compound 3a3 is predicted to greatly penetrate the blood‐brain barrier (BBB) as suggested by the highest value for the model cell (MDCK, Madin‐Darby Canine Kidney) permeability. On the other hand, compound 3a5 is predicted to have the poorest BBB penetration. All of these compounds are predicted to inhibit hERG (human ether‐à‐go‐go‐related gene) potassium channels of the heart, which could render them as cardiotoxic. All compounds are predicted to be absorbed from the intestine, compounds 3a4 and 3b3 having the best predicted apparent Caco‐2 cell permeability. Compound 3a5 , however, has a significantly lower predicted Caco‐2 permeability than the other compounds in this series.
Table 3.
Various ADMET properties of the synthesized compounds predicted by QikProp.
|
Compound |
CNS activity[a] |
hERG blockage (log IC50)[b] |
Apparent Caco‐2 permeability (nm/s)[c] |
Apparent MDCK permeability (nm/s)[d] |
Skin permeability (log Kp)[e] |
Aqueous solubility (log S)[f] |
Number of reactive functional groups[g] |
Number of likely metabolic reactions[h] |
|---|---|---|---|---|---|---|---|---|
|
3a1 |
−2 |
−6.085 |
294 |
132 |
−3.026 |
−5.348 |
1 |
2 |
|
3a2 |
−2 |
−7.098 |
257 |
114 |
−2.642 |
−5.831 |
1 |
3 |
|
3a3 |
−2 |
−6.232 |
206 |
90 |
−3.048 |
−5.269 |
1 |
4 |
|
3a4 |
−2 |
−6.619 |
340 |
320 |
−2.588 |
−5.966 |
1 |
3 |
|
3a5 |
−2 |
−7.705 |
50 |
19 |
−3.831 |
−6.631 |
2 |
3 |
|
3a6 |
−2 |
−6.234 |
269 |
120 |
−3.513 |
−6.193 |
4 |
2 |
|
3b3 |
−2 |
−6.484 |
344 |
812 |
−2.735 |
−6.992 |
1 |
4 |
|
3b4 |
−2 |
−6.691 |
179 |
205 |
−3.32 |
−6.708 |
1 |
3 |
[a] Predicted central nervous system activity; scale: –2 (inactive) to +2 (active); [b] hERG: Gene encoding protein of the alpha subunit of a potassium ion channel; hERG blockers are cardiotoxic (concern below −5); [c] Caco‐2: human colon carcinoma cell line used to model intestinal absorption (<25 poor; >500 great); [d] MDCK: Madin‐Darby Canine Kidney cell line used to model the blood‐brain barrier (<25 poor; >500 great); [e] Range for 95 % of known drugs −8.0–(−1.0); [f] Aqueous solubility (S) in mol/dm3 is the concentration of the solute in a saturated solution that is in equilibrium with the crystalline solid. Log S range for 95 % of known drugs: −6.5 to 0.5; [g] The presence of reactive functional groups can lead to false positives in High‐Throughput Screening assays and to decomposition, reactivity, or toxicity problems in vivo (95 % of known drugs have 0–2 reactive groups); [h] For 95 % of known drugs the number of metabolic reactions varies between 1 and 8.
All compounds are predicted to have a relatively good skin permeability. Their aqueous solubility is predicted to be low and especially compounds 3b3 and 3b4 with the halogen substituted quinolone ring show the lowest predicted water solubility. As a reactive group, all compounds have an unhindered ester (3a5 has two of them) and 3a6 has also 3 acetal‐type of groups. Furthermore, one of the likely metabolic pathways for the compounds could be e. g., the oxidation of the benzylic carbon.
Conclusions
In this work, we present the synthesis of new quinolone‐aminoester‐triazole hybrid molecules 3a1 –3a6 and 3b3 –3b4 with good yields. The triple bond of two types of quinolone‐carboxamides was reacted with different types of substituted azides (including sugar, amino ester, aromatic and alkyl groups) using click chemistry and Cu(I) as a catalyst. All compounds were obtained with excellent purity and have been characterized by 1H and 13C, DEPT, or COSY 1H−1H NMR and ESI‐TOF mass spectrometry.
The potential antibacterial activity of the compounds was tested against Escherichia coli ATCC 25922, Staphylococcus aureus ATCC 29213, Pseudomonas aeruginosa ATCC 27853 and Bacillus subtilis ATCC 3366, and their antifungal activity was tested against Candida albicans and Aspergillus niger. Many of the compounds showed moderate to good activities against one or more of the bacterial strains whereas only some of the compounds showed weak to moderate antifungal activity. The most potent and broad‐spectrum compounds were 3a5 and 3a6 , exhibiting antimicrobial activity against all these organisms.
The presence of 1,2‐dihydroquinoline moiety led us to explore the bacterial DNA gyrase as the primary target for these compounds. Unfortunately, none of these compounds inhibited DNA gyrase, suggesting that they have a different mechanism of bacterial inhibition. Finally, computational prediction of the pharmacokinetic and toxicity properties of the compounds suggests that they have potential to be optimized and used as new pharmacophores for development of antibacterial and antifungal therapeutic agents.
Experimental Section
Chemistry
Materials and instruments . The following reagents used for the synthesis were purchased from Sigma‐Aldrich: triethylamine 99.5 %, hexafluorophosphate benzotriazole tetramethyl uronium (HBTU) 98 % and L‐alanine 99 %, tetra‐n‐butylammonium bromide (BTBA) 90 %, propargyl bromide 80 % in toluene, potassium carbonate (K2CO3) 99 %, copper sulfate pentahydrate (CuSO4.5H2O) 99 % and L(+)‐ascorbic acid sodium salt and analytical solvents such as ethanol 99.5 %, anhydrous dimethylformamide 99.8 %, ethyl acetate (HPLC‐grade) and hexane (HPLC‐grade). Column liquid chromatography was performed on 60 Merck silica gel (230–400 mesh ASTM). Thin layer chromatography (TLC) was performed on Merck aluminum plates coated with 60 F254 Merck silica gel (thickness 0.2 mm). The synthesized components were revealed by an ultra‐violet lamp set at 254 nm and their melting points were determined by Electrothermal IA 9000 Series digital fusiometer using capillary tubes. NMR spectra and ESI‐TOF mass spectroscopy were recorded at the Department of Chemistry, University of Helsinki, Finland. NMR spectra were performed on Bruker Ascend 400 MHz‐Avance III HD NMR spectrometer (Bruker Corporation, Billerica, MA, USA). 1H NMR spectra were recorded at 400 MHz, and 13C NMR spectra at 100 MHz using DMSO‐d6 or CDCl3 as the solvent. The chemical shift (δ) of different peaks was expressed in ppm and the coupling constants (nJ) in Hz. For describing the multiplicity of signals, the following abbreviations have been used: singlet (s), doublet (d), doublet of doublet (dd), doublet of doublet of doublet (ddd), multiplet (m), triplet (t) and quadruplet (q). The high‐resolution mass spectra were measured by the micro TOF‐MS instrument (Bruker Daltonics GmbH, Bremen, Germany) in positive electrospray ionization mode. During the pre‐measurement, the instrument was calibrated with the 5 mM sodium formate solution.
Procedure for the preparation of 2 a and 2 b
A mixture of methyl (2‐oxo‐1.2‐dihydroquinolin‐4‐yl)‐L‐alaninate 1 (1.5 mmol) and of potassium carbonate (K2CO3) (3 mmol) is dissolved in 25 ml of dimethylformamide (DMF). The solution is magnetically stirred for 5 minutes, then 0.01 equivalent of tetra‐n‐butylammonium bromide (TBAB) and 3 mmol of propargyl bromide are added. The mixture is magnetically stirred for 6 hours. After filtration of the salts, DMF is evaporated under reduced pressure. The residue obtained is dissolved in dichloromethane and washed with water. The organic phase is dried on Na2SO4 and then concentrated under vacuum. The residue obtained is purified by chromatography on a silica gel column.
General procedure for the preparation of 3a1–3a6 and 3b3–3b4
1 mmol of compound 2 is added to 2 mmol of azide in a mixture of ethanol/water (2/1: v/v) at room temperature. 0.1 mmol of copper sulphate pentahydrate (CuSO4.5H2O) and 1 mmol of sodium ascorbate are added to the flask. The reaction is stirred for 48 hours. After evaporation of ethanol, the mixture is extracted with dichloromethane and dried with Na2SO4, followed by evaporation of the dichloromethane. The product is purified by chromatography on a silica gel column with a hexane/ethyl (2/1: v/v) acetate eluent.
Methyl (S)‐2‐[2‐oxo‐1‐(prop‐2‐yn‐1‐yl)‐1,2‐dihydroquinoline‐4‐carbox amido]propanoate (2 a): Yield: 80 %; white solid; mp=166–168 °C; Rf=0.4 (hexane/ethyl acetate 1/1: v/v). 1 H NMR (400 MHz, CDCl3): 8.00 (dd, 1H, 3J=8.1 Hz, 4J=1.2 Hz, Har), 7.66 (td, 1H, 3J=7.2 Hz, 4J=1.5 Hz, Har), 7.52 (dd, 1H, 3J=8.1 Hz, 4J=1.5 Hz, Har), 7.33 (td, 1H, 3JH−H=7.2 Hz, 4JH−H=1.2 Hz, Har), 7.88 (d, 1H, 3JH−H=7.2 Hz, NH), 6.82 (s, 1H, CHethylenic), 5.07(dd, 1H, 2JH−H=17.4 Hz, 4JH−H=2.4 Hz, CH2−Nquinoline), 4.96 (dd, 1H, 2JH−H=17.4 Hz, 4JH−H=2.4 Hz, CH2−Nquinoline), 4.84 (qd, 1H, 3JH−H=7.2 Hz, 3JH−H=7.2 Hz, *CH−N), 3.84 (s, 3H, CH3−O), 2.23 (t, 1H, 4JH−H=2.4 Hz, CH), 1.60 (d, 3H, 3JH−H=7.2 Hz, CH3). 13 C NMR (100 MHz, CDCl3): 172.16 (C=Oester), 165.66 (C=Oamide) (C=Oamide quinoline), 160.49, 145.35–138.94 (C4a and C8a), 131.59 (Ct5), 127.36 (Ct7), 123.16 (=Ctethylenic), 119.38 (Ct6), 117.73 (Cqethylenic),115.03 (Ct8), 77.26(Cqalkyne), 72.70 (CHAlkyne), 52.75 (*CH−N), 48.55 (CH3−O), 31.69 (CH2−Nquinoline), 18.6 (CH3). Mass spectrometry (ESI‐TOF‐MS) : m/z calculated for [C17H16 N2O4+Na]+35.1002, found 335.0998, m/z calculated for [(C17H16 N2O4)2+Na]+647.2112, found 647.2112.
Methyl (S)‐6‐bromo‐2‐[2‐oxo‐1‐(prop‐2‐yn‐1‐yl)‐1,2‐dihydroquinoline‐4‐carboxamido]propanoate (2 b): Yield: 80 %; white solid; mp=178–180 °C; Rf=0.4 (hexane/ethyl acetate 1/1: v/v). 1 H NMR (400 MHz, CDCl3): 8.1 (d, 1H, 2J=2.1 Hz, Har), 7.76 (td, 1H, 3J=7.2 Hz, 4J=2.1 Hz, Har), 7.62 (d, 1H, 3J=7.2 Hz, Har), 7.14 (d, 1H, 3JH−H=7.2 Hz, NH), 6.9 (s, 1H, CHethylenic), 5.07(d, 1H, 2JH−H=17.4 Hz, 4JH−H=2.4 Hz, CH2−Nquinoline), 4.96 (d, 1H, 2JH−H=17.4 Hz, 4JH−H=2.4 Hz, CH2−Nquinoline), 4.84 (qd, 1H, 3JH−H=7.2 Hz, 3JH−H=7.2 Hz, *CH−N), 3.84 (s, 3H, CH3−O), 2.23 (t, 1H, 4JH−H=2.4 Hz, CH), 1.60 (d, 3H, 3JH−H=7.2 Hz, CH3). 13 C NMR (100 MHz, CDCl3): 174.2 (C=Oester), 167.66 (C=Oamide), 161.49 (C=Oamide), 145.85–138.74 (C4a and C8a), 131.59 (Ct5), 127.36 (Ct7), 123.16 (=Ctethylenic), 119.38 (Ct6), 117.73 (Cqethylenic), 117.65 (Cqar ), 115.03 (Ct8), 77.70 (Cqalkyne)72.70 (CHalkyne), 52.75 (*CH−N), 48.55 (CH3−O), 31.69(CH2−Nquinoline), 18.6 (CH3). Mass spectrometry (ESI‐TOF‐MS) : m/z calculated for [C17H15BrN2O4+Na]+413.0125, found 413.0138, m/z calculated for [(C17H15N2O4)2+Na]+805.0358, found 805.0312.
Methyl (S)‐2‐{2‐oxo‐1‐[(1‐pentyl‐1H‐1,2,3‐triazol‐4‐yl)methyl]‐1,2‐dihy droquinoline‐4‐carboxamido}propanoate (3a1): Yield: 75 %; white solid; mp=180–12 °C; Rf=0.2 (hexane/ethyl acetate 1/2: v/v). 1 H NMR (400 MHz, CDCl3): 7.94 (dt, 1H, 3J=8.1 Hz, 4J=1.8 Hz, Har), 7.64 (m, 2H, Har), 7.59 (s, 1H, Htriazole), 7.28 (m, 1H, Har), 6.85 (s, 1H, CHethylenic), 6.76 (d, 1H, 3JH−H=7.5 Hz, NH), 5.58 (d, 1H, 2JH−H=20.5 Hz, CH2−Nquinoline), 5.57 (d, 1H, 2JH−H=20.5 Hz, CH2−Nquinoline), 4.85 (qd, 1H, 3JH−H=7.5 Hz, 3JH−H=7.2 Hz, *CH−N), 4.85 (t, 2H, 3JH−H=7.4 Hz, CH2−Ntriazole), 3.84 (s, 3H, CH3−O), 1.86 (tt, 2H, 3JH−H=8.27 Hz, 3JH−H=7.4 Hz, CH2−Nquinoline), 1.86 (m, 2H, CH2), 1.59 (d, 3H, 3JH−H=7.2 Hz, CH3), 0.86 (t, 3H, 3JH−H=6.2 Hz, CH3). 13 C NMR (100 MHz, CDCl3): 172.82 (C=Oester), 165.78 (C=Oamide quinoline), 161.32 (C=Oamide), 145.39–138.52 (C4a,C8a and Cqtriazole), 131.91 (Ct5), 127.00 (Ct7), 123.16 (=Ctethylenic), 122.80 (Cttriazole), 119.28 (Ct6), 117.51 (Cqethylenic),115.69 (Ct8), 52.75 (*CH−N), 50.50 (CH2−N), 48.55 (CH3−O), 38.43 (CH2‐triazole), 29.71 (CH2), 28.56 (CH2), 22.03 (CH2), 18.6 (CH3), 13.80 (CH3). Mass spectrometry (ESI‐TOF‐MS): m/z calculated for [C22H27N5O4+Na]+48.1955, found 448,1950, m/z calculated for [(C22H27BrN5O4)2+Na]+873.4024, found 873.3999.
Methyl (S)‐2‐{2‐oxo‐1‐[(1‐benzyl‐1H‐1,2,3‐triazol‐4‐yl)methyl]‐1,2‐dih ydroquinoline‐4‐carboxamido}propanoate (3a2): Yield: 80 %; white solid; mp=168–170 °C; Rf=0.15 (hexane/ethyl acetate 1/2: v/v). 1 H NMR (400 MHz, CDCl3): 7.92 (dt, 1H, 3J=8.1 Hz, 4J=1.5 Hz, Har), 7.86(d, 1H, 3J=8.62 Hz, Har), 7.60 (td, 1H, 3J=8.7, 3J=7.2, 4J=1.5 Hz, Har), 7.48 (s, 1H, Htriazole), 7.36–7.21 (m, 6H, Har), 7.11 (d, 1H, 3JH−H=7.5 Hz, NH), 6.76 (s, 1H, CHethylenic), 5.57–5.28 (m, 4H, CH2−N), 4.85 (qd, 1H, 3JH−H=7.5 Hz, 3JH−H=7.2 Hz, *CH−N), 3.78 (s, 3H, CH3−O), 2.19 (s, 3H, CH3‐Ar), 1.56 (d, 3H, 3JH−H=7.2 Hz, CH3). 13 C NMR (100 MHz, CDCl3): 172.82 (C=Oester), 165.87 (C=Oamide), 161.25 (C=Oamide), 145.49–138.52 (C4a,C8a and Cqtriazole), 134 (Ctbenz), 131.84 (Ct5), 129.12 (Ctbenz), 128.81 (Ctbenz), 128.20 (Ctbenz), 127.07 (Ct7), 123.25 (=Ctethylenic), 123.13 (Cttriazole), 119.12 (Ct6), 117.57 (Cqethylenic),115.69 (Ct8), 53.5 (CH2−Ntriazole), 52.72 (*CH−N), 48.53 (CH3−O), 38.18 (CH2−N), 18.03 (CH3). Mass spectrometry (ESI‐TOF‐MS) : m/z calculated for [C24H23N5O4+Na]+468.1642, found 468.1642, m/z calculated for [(C24H23N5O4)2+Na]+913.3392, found 913.3392.
Methyl (S)‐2‐{2‐oxo‐1‐[(1‐(2‐methylbenzyl)‐1H‐1,2,3‐triazol‐4‐yl)meth yl]‐1,2‐dihydroquinoline‐4‐carboxamido}propanoate (3a3): Yield: 80 %; white solid; mp=215–217 °C; Rf=0.15 (hexane/ethyl acetate 1/2: v/v). 1 H NMR (400 MHz, CDCl3): 8.08 (m, 1H, Har), 7.85 (d, 1H, 3J=9 Hz, Har), 7.71 (td, 1H, 3J=9 Hz, 2J=2.2 Hz, Har), 7.64 (s, 1H, Htriazole), 7.43–7.38 (m, 2H, Har), 6.83 (s, 1H, CHethylenic), 6.74 (d, 1H, 3JH−H=7.4 Hz, NH), 5.57–5.50 (m, 4H, CH2−N), 4.82 (qd, 1H, 3JH−H=7.5 Hz, 3JH−H=7.2 Hz, *CH−N), 3.85 (s, 3H, CH3−O), 1.67 (s, 3H, CH3‐Ar), 1.59 (d, 3H, 3JH−H=7.2 Hz, CH3). 13 C NMR DEPT 135° (100 MHz, CDCl3): 134.72 (Ctbenz), 129.49 (Ct5), 128.86 (Ct7), 124.39 (=Ctethylenic), 123.76 (Cttriazole), 120.33 (Ctbenz), 117.12 (Ct6), 112.63 (Ct8), 53.28 (CH2−Ntriazole), 52.40 (*CH−N), 46.6 (CH3−O), 38.46 (CH2−N), 18.23 (CH3), 18.24 (CH3). Mass spectrometry (ESI‐TOF‐MS) : m/z calculated for [C25H25N5O4+Na]+482.1799, found 482.1799, m/z calculated for [(C25H25N5O4)2+Na]+941.3705, found 941.3705.
Methyl (S)‐2‐{2‐oxo‐1‐[(1‐(2‐bromobenzyl)‐1H‐1,2,3‐triazol‐4‐yl)meth yl]‐1,2‐dihydroquinoline‐4‐carboxamido}propanoate (3a4): Yield: 80 %; white solid; mp=166–168 °C; Rf=0.1 (hexane/ethyl acetate 1/2: v/v). 1 H NMR (400 MHz, CDCl3): 7.94 (m, 2H, Har), 7.61–7.19 (m, 8H, Htriazole and Har), 7.12 (d, 1H, 3JH−H=7.5 Hz, NH), 6.82 (s, 1H, CHethylenic), 5.61 (s, 2H, CH2‐Ar), 5.51 (d, 1H, J=18 Hz, CH2−Nquinoline), 5.34 (d, 1H, J=18 Hz, CH2−Nquinoline), 4.85 (qd, 1H, 3JH−H=7.5 Hz, 3JH−H=7.2 Hz, *CH−N), 3.84 (s, 3H, CH3−O), 1.6 (d, 3H, 3JH−H=7.2 Hz, CH3). 13 C NMR (100 MHz, CDCl3): 172.79 (C=Oester), 165.9 (C=Oamide), 161.24 (C=Oamide), 145.49–139.18 ((C4a,C8a and Cqtriazole), 133.26 (Cqar), 134 (Ctbenz), 131.87 (Ct5), 130.46 (Ctbenz), 130.40 Ctbenz), 128.21(Ctbenz), 127.03 (Ct7), 123.56 (=Ctethylenic), 123.10 (Cttriazole), 119.27 (Ct6), 117.52 (Cqethylenic),115.69 (Ct8), 53.91 (CH2−Ntriazole), 52.78 (*CH−N), 48.53 (CH3−O), 38.33 (CH2−Nquinoline), 18.6 (CH3). Mass spectrometry (ESI‐TOF‐MS): m/z calculated for [C25H22BrN5O4+Na]+546.0747, found 546.0747, m/z calculated for [(C25H25N5O4)2+Na]+1069.1603, found 1069.1603.
Methyl (S)‐2‐{2‐oxo‐1‐[(1‐(1‐benzamido‐2‐methoxy‐2‐oxoethyl)‐1H‐1,2,3‐triazol‐4‐yl)methyl]‐1,2‐dihydroquinoline‐4‐carboxamido}propanoate (3a5): Yield: 75 %; white solid, mp=123–125 °C; Rf=0.15 (hexane/ethyl acetate 1/2: v/v). 1 H NMR (400 MHz, CDCl3): 8.05 (s, 1H, NH), 7.92 (t, 1H, 3JH−H=9.3 Hz, Har), 7.92 (td, 1H, 3JH−H=7.3 Hz, 4JH−H=1.8 Hz, Har), 7.59 (m, 2H, Har), 7.45 (m, 2H, Har and Htriazole), 7.26 (d, 1H, 3JH−H=7.5 Hz, Har), 6.98 (d, 1H, 3JH−H=7.9 Hz, NH), 6.82 (d, 1H, 3JH−H=2.7 Hz, *CH−Ntriazole), 6.71 (s, 1H, CHethylenic), 5.59 (s, 2H, CH2−Ntriazole), 4.85 (qd, 1H, 3JH−H=7.7 Hz, 3JH−H=6.5 Hz, *CH−N), 3.86 (s, 3H, CH3−O), 3.84 (d, 3H, 3JH−H=1.5 Hz, CH3−O), 1.6 (d, 3H, 3JH−H=7.2 Hz, CH3). 13 C NMR (100 MHz, CDCl3): 172.75 (C=Oester), 166.78 (C=Oamide), 166.43(C=Oamide), 165.80 (C=Oamide), 165.40 (C=Oester), 161.24 (C=Oester), 145.49–139.55 (C4a,C8a and Cqtriazole), 138.77 (Ctbenz), 134.24 (Ctbenz), 132.82 (Cqar), 131.87 (Ct5)„ 128.21 (Ctbenz), 127.03 (Ct7), 123.56 (=Ctethylenic), 121.10 (Cttriazole), 119.35 (Ct6), 117.56 (Cqethylenic),115.59 (Ct8), 53.91 (CH2−Ntriazole), 52.78 (*CH−N), 48.53 (CH3−O), 38.33 (CH2−Nquinoline), 18.6 (CH3). Mass spectrometry (ESI‐TOF‐MS): m/z calculated for [C27H26N6O7+Na]+569.1755, found 569.1764, m/z calculated for [(C27H26N6O7)2+Na]+15.3618, found 1115.3618.
Methyl (S)‐2‐{2‐oxo‐1‐[(1–(2‐oxo‐1–2,2,8,8‐tetramethylhexahydro‐[1,3]dioxolo[4′, 5′:5,6]pyrano[4,3‐d][1,3]dioxin‐5‐yl)‐1H‐1,2,3‐triazol‐4‐yl)methyl]‐1,2‐dihydroquinoline‐4‐carboxamido}propanoate (3a6): Yield: 80 %; white solid; mp=128–130 °C; Rf=0.15 (hexane/ethyl acetate 1/2: v/v). 1 H NMR (400 MHz, CDCl3): 7.92 (dd, 1H, 3JH−H=8.1 Hz, 4J=1.5 Hz, Har), 7.75 (d, 1H, 3JH−H=8.6 Hz, Har), 7.61–7.53 (m, 2H, Har et Htriazole), 7.45 (d, H, 3JH−H=7.4 Hz, NH), 7.31–7.20 (m, 2H, Har), 6.75 (s, 1H, Hethylenic), 5.42 (d, 1H, 3JH−H=5.7 Hz, CH), 5.42 (d, 1H, 3JH−H=16 Hz, CH2−Nquinoline), 5.09 (d, 1H, 3JH−H=16 Hz, CH2−Nquinoline), 4.85 (qd, 1H, 3JH−H=7.4 Hz, 3JH−H=7.2 Hz, *CH−N), 4.58 (dd, 1H, 3JH−H=7.7 Hz,4J=2.5 Hz, CH), 4.46 (dd, 1H, 3JH−H=14.2 Hz, 4J=4.1 Hz, CH), 4.32 (m, 1H, CH), 4.27 (dd, 1H, 3JH−H=5.1 Hz, 4J=2.5 Hz, CH), 3.8 (s, 3H, CH3−O), 1.6 (d, 3H, 3JH−H=7.2 Hz, CH3), 1.58 (s, 3H, CH3), 1.43 (s, 3H, CH3), 1.30 (s, 6H, CH3), 1.26 (s, 6H, CH3). 13 C NMR DEPT 135° (100 MHz, CDCl3): 131.74 (Ct5), 127.12 (Ct7), 124.57 (=Ctethylenic), 123.09(Cttriazole), 119.02 (Ct6), 115.58 (Ct8), 96.12 (Cqgalactose anomeric carbon), 66.95 (CH2−O), 52.66 (CH2−Ntriazole), 50.39 (*CH−N), 48.54 (CH3−O), 38.01 (CH2−N), 25.91 (CH3), 25.79 (CH3), 24.84 (CH3), 24.37 (CH3), 17.84 (CH3). Mass spectrometry (ESI‐TOF‐MS) : m/z calculated for [C29H34N5O9+Na]+620. 2337, found 620. 2337, m/z calculated for [(C29H34N5O9)2+Na]+1217.4780, found 1217.4780.
Methyl (S)‐6‐bromo‐2‐{2‐oxo‐1‐[(1‐(2‐methylbenzyl)‐1H‐1,2,3‐triazol‐4‐yl)methyl]‐1,2‐dihydroquinoline‐4‐carboxamido}propanoate (3b3): Yield: 80 %; white solid; mp=245–247 °C; Rf=0.15 (hexane/ethyl acetate 1/2: v/v). 1 H NMR (400 MHz, CDCl3): 8.08 (d, 4JH−H=2.3 Hz, 1H, Har), 7.88 (d, 1H, 3JH−H=9 Hz, Har), 7.70 (dd, 1H, 3JH−H=9.1 Hz, 4J=2.3 Hz, Har), 7.43 (s, 1H, Htriazole), 7.31–7.26 (m, 1H, Har), 7.22–7.13 (m, 3H, Har), 6.82 (s, 1H, CHethylenic), 6.66 (d, 1H, 3JH−H=7.5 Hz, NH), 5.59 (m, 4H, CH2), 4.82 (qd, 1H, 3JH−H=7.2 Hz, 3JH−H=7.5 Hz, *CH−N), 3.85 (s, 3H, CH3−O), 2.27 (s, 1H, CH3‐Ar), 1.58 (d, 3H, 3JH−H=7.2 Hz, CH3). 13 C NMR DEPT 135° (100 MHz, CDCl3): 134.64 (Ct5), 131.39 (Ctbenz), 129.66 (Ct7), 129.36 (Ctbenz), 129.30 (Ctbenz), 126.74 (Ctbenz), 123.13 (Cttriazole), 120.43 (Ct6), 117.42 (=Ctethylenic), 52.87 (*CH−N), 52.42 (CH2−Ntriazole), 48.59 (CH3−O), 38.26 (CH2−Nquinoline), 19.03 (CH3‐Ar), 18.27 (CH3). Mass spectrometry (ESI‐TOF‐MS) : m/z calculated for [C25H21Br2N4O4+Na]+560.0789, found 560.0918, m/z calculated for [(C25H21Br2N4O4)2+Na]+1097,1621, found 1097.
Methyl (S)‐6‐bromo‐2‐{2‐oxo‐1‐[(1‐(2‐bromobenzyl)‐1H‐1,2,3‐triazol‐4‐yl)methyl]‐1,2‐dihydroquinoline‐4‐carboxamido}propanoate (3b4): Yield: 80 %; white solid; mp=230–232 °C; Rf=0.15 (hexane/ethyl acetate 1/2: v/v). 1 H NMR (400 MHz, CDCl3): 8.10 (s, 1H, Har), 7.96 (m, 1H, Har), 7.72 (s, 1H, Htriazole), 7.62 (d, 1H, 3JH−H=7.8 Hz, Har), 7.31 (m, 1H, Har), 7.22 (t, 1H, 3JH−H=7.6 Hz), 6.89 (s, 1H, CHethylenic), 6.69 (d, 1H, 3JH−H=6.9 Hz, NH), 5.61–5.12 (m, 4H, CH2), 4.84 (qd, 1H, 3JH−H=7.2 Hz, 3JH−H=6.9 Hz, *CH−N), 3.85 (s, 3H, CH3−O), 1.58 (d, 3H, 3JH−H=7.2 Hz, CH3). 13 C NMR DEPT 135° (100 MHz, CDCl3): 134.81 (Ct5), 133.26 (Ctbenz), 130.65 (Ctbenz), 130.63 (Ctbenz), 129.39 (Ct7), 128.21 (Ctbenz), 123.13 (Cttriazole), 122.28 (Ct6), 118.96 (=Ctethylenic), 52.89 (*CH−N), 52.72 (CH2−Ntriazole), 46.6 (CH3−O), 38.46 (CH2−Nquinoline), 18.31 (CH3). Mass spectrometry (ESI‐TOF‐MS): m/z calculated for [C25H21Br2N4O4+Na]+623.9787, found 623.9869, m/z calculated for [(C25H21Br2N4O4)2+Na]+1226.9780, found 1226.9805.
Antimicrobial activity evaluation
The Agar Disc Diffusion Method (ADD) was employed for the determination of antibacterial activities of the tested products as described previously. The test samples were first dissolved in dimethyl sulfoxide (1 %) (DMSO), which did not affect the microbial growth. Briefly, the test was performed on sterile petri plates containing agar medium. 30 ml of the sterilized medium was poured into sterile petri plates. After solidification, 100 μl of fresh cultures of bacterial species (one microorganism per petri plate) was added onto the plates. Sterile filter paper discs (6 mm in diameter) were impregnated with 6 μl of 10 mg/mL test samples. All plates were sealed with sterile laboratory films to avoid eventual evaporation of the test samples, and then incubated at 37 °C for 24 h. [56] The diameter of the inhibition zone was measured in millimeters and an average of three independent determinations was recorded.
The MICs of 2 a, 2 b, 3a1 –3a6 and 3b3 –3b4 were determined by the broth microdilution method.[ 57 , 61 ] A 96‐well polypropylene microtiter plate was filled with 50 μL of Mueller‐Hinton broth (MHB). Then, 50 μL of each sample at a final concentration of 10 mg/mL was added into the first well. Serial dilutions were realized by pipetting 50 μL from the first well and transferred to the next one. This operation was repeated until the 12th well and the last 50 μL mixture was discarded. Finally, a volume of 50 μL of bacterial suspension was added into each well at a final concentration of approximately 106 CFU/mL. The 96‐well plate was then covered and was incubated at 37 °C for 24 h, whereas plates containing fungal organisms were incubated at 28 °C for 48 h. After that, 5 μL of resazurin was pipetted into all the wells and incubated once more at 37 °C for 2 h. The MIC is presented as the lowest concentration that showed a negative bacterial growth, detected as a non‐change in resazurin color. A positive bacterial growth was observed as a reduction of the blue dye resazurin to pink resorufin.[ 57 , 61 ] The MIC determination was performed in triplicate for each organism and the experiment was repeated where necessary.
Computational studies
Ligand and protein preparation : The 2D structures of the synthesized hybrid compounds were prepared with ChemDraw version 19.1 and imported into Maestro (Schrödinger Release 2020–4: Maestro, Schrödinger, LLC, New York, NY, 2020). The 2D structures were converted to 3D using Maestro's LigPrep tool: possible tautomeric states for each ligand were generated at pH 7.0±2.0 with Epik [62] and maximum of two stereoisomers were generated per ligand; the OPLS3e force field [63] was applied to generate optimized low‐energy 3D conformers of the ligands. We used only the S enantiomers of the amino acid (L‐alanine) moiety and the SS stereoisomer of 3a5 for the computational studies.
The crystal structures of two S. aureus and one E. coli DNA gyrase‐inhibitor complexes (PDB ID: 5BS3 [64] – a complex with a novel bacterial topoisomerase inhibitor [NBTI], resolution 2.65 Å; 5CDQ [65] – a complex with moxifloxacin, a fluoroquinolone, res. 2.95 Å; 4DUH [66] – a complex with a 4,5’‐bithiazole inhibitor [4′‐methyl‐N(2)‐phenyl‐[4,5′‐bithiazole]‐2,2′‐diamine], res. 1.5 Å, respectively) were retrieved from the Protein Data Bank (PDB). [67] The target structures were processed with the Protein Preparation Wizard [68] of Maestro. The missing hydrogen atoms were added and the hydrogen bond network was optimized with PROPKA at pH 7.0. All water molecules beyond 3 Å from non‐protein atoms were removed and a restrained minimization was carried out using the OPLS3e force field with the convergence criteria of 0.3 Å RMSD for all heavy atoms.
Mapping water interaction sites at the quinolone and NBTI binding pockets : Since the crystal resolution is somewhat low for the S. aureus DNA gyrase‐inhibitor complexes (PDB IDs: 5BS3 and 5CDQ) only a few or no crystal water molecules are detected at the NBTI or fluoroquinolone binding sites in the DNA gyrase subunit A (GyrA). The coumarin binding site in the DNA gyrase subunit B (GyrB) of the E. coli structure (PDB ID: 4DUH), however, contains co‐crystallized water molecules. To investigate whether water plays an important role in mediating the inhibitor binding interactions, we calculated favorable water interaction fields at the NBTI and fluoroquinolone binding sites using the program GRID (version 22d)[ 69 , 70 , 71 ] of Molecular Discovery Ltd. The probing area for detecting possible hydration layers was restricted to cover the area around the particular co‐crystallized ligand. The number of planes per Ångström and resolution was set to 0.25 Å. The energy minima below −7 kcal/mol in the Grid map were detected with the program MINIM, whereafter the program FILMAP was used to populate the energy minima with water molecules. The subsequent docking studies at the three inhibitor binding sites (NBTI, fluoroquinolone, coumarin) were performed both with and without the GRID‐calculated/crystal water molecules for the reference compounds (Supporting Information, p. S19, Figure S2, Table S2) and with the water molecules for the novel synthesized compounds. For the binding free energy evaluation, these favorable water molecules were included for all compounds.
Molecular docking : Docking was performed with the extra precision (XP) mode of Glide[ 72 , 73 , 74 ] (Schrödinger Release 2020‐4: Glide, Schrödinger, LLC, New York, NY, 2020) at the three ligand binding sites defined by the co‐crystallized inhibitors in the selected DNA gyrase structures. The outer box size of the docking grid was set to 30 Å×30 Å×30 Å (the diameter midpoint of the docked ligands was set to remain in an inner box with dimensions of 10 Å×10 Å×10 Å). Flexible ligand sampling was used and for each ligand 10 poses were taken for post‐docking minimization and one pose per ligand was generated. The Epik state penalties were added to the final docking score. The docking protocol was validated by docking the co‐crystallized ligands back into their crystal binding sites (Supporting Information, p. S18, Figure S1).
Binding free energy prediction : The Prime[ 75 , 76 ]/MM‐GBSA tool of Maestro Schrödinger Release 2020–4: Prime, Schrödinger, LLC, New York, NY, 2020) was used to calculate the binding free energies for the docked poses of the synthesized compounds. The binding free energy ΔGbind is estimated according to [Eq. 1]:
| (1) |
where ΔEMM is the difference in energy between the complex structure and the sum of the energies of the ligand and unliganded receptor (in the OPLS3e molecular mechanics force field), ΔGsolv is the difference in the generalized Born surface area (GBSA) solvation energy of the complex and the sum of the solvation energies for the ligand and unliganded receptor (calculated with the VSGB2.1 solvation model [77] ), and ΔGSA is the difference in the surface area energy for the complex and the sum of the surface area energies for the ligand and uncomplexed receptor.
Quantum mechanical calculations : All the 3D structures of the synthesized compounds that were initially generated and optimized in the OPLS3e force field were subjected to ab initio quantum mechanical (QM) geometry optimization using Jaguar (Schrödinger Release 2020‐4: Jaguar, Schrödinger, LLC, New York, NY, 2020). [78] The 6–31G** basis set was used with the B3LYP−D3 [79] density functional theory (DFT) with automatic self‐consistent field (SCF) spin treatment using medium grid density with nonrelativistic Hamiltonian. Geometry optimization in the gas phase was carried out for 100 steps with default convergence criteria. The highest and lowest occupied molecular orbitals (HOMO and LUMO, respectively) were calculated. The pK a values of the compounds were predicted using the Jaguar pK a prediction tool.[ 80 , 81 ] The selection of atoms for pK a prediction was made automatically in water. Maximum of 48 iterations with DIIS convergence scheme were performed. The tautomer prediction was done using the Jaguar QM conformer and tautomer prediction tool. The top five tautomers were allowed to be generated in water without charge adjustment using the default workflow.
ADME and toxicity prediction : Schrödinger's QikProp tool (Schrödinger Release 2020–4: QikProp, Schrödinger, LLC, New York, NY, 2020) was used to predict pharmacokinetic properties of the synthesized compounds.
Determination of inhibitory activities on E. coli DNA gyrase
Inhibitory activities against E. coli DNA gyrase were determined in supercoiling or relaxation assays from Inspiralis on streptavidin‐coated 96‐well microtiter plates from Thermo scientific Pierce. First, the plates were rehydrated with buffer (20 mM Tris‐HCl with pH 7.6, 0.01 % w/v BSA, 0.05 % v/v Tween 20, 137 mM NaCl) and the biotinylated oligonucleotide was then immobilized. After washing off the unbound oligonucleotide, the enzyme test was performed. The reaction volume of 30 μL in buffer (35 mM Tris × HCl with pH 7.5, 4 mM MgCl2, 24 mM KCl, 2 mM DTT, 1.8 mM spermidine, 1 mM ATP, 6.5 % w/v glycerol, 0.1 mg/mL) contained 1.5 U of DNA gyrase from E. coli, 0.75 μg of relaxed pNO1 plasmid, and 3 μL solution of the inhibitor in 10 % DMSO and 0.008 % Tween 20. Reaction solutions were incubated at 37 °C for 30 min. After that, the TF buffer (50 mM NaOAc with pH 5.0, 50 mM NaCl and 50 mM MgCl2) was added to terminate the enzymatic reaction. After additional incubation for 30 min at rt, during which biotin‐oligonucleotide‐plasmid triplex was formed, the unbound plasmid was washed off using TF buffer and SybrGOLD in T10 buffer (10 mM Tris HCl with pH 8.0 and 1 mM EDTA) was added. The fluorescence was measured with a microplate reader (BioTek Synergy H4, excitation: 485 nm, emission: 535 nm). Initial screening was done at 100 or 10 μM concentration of inhibitors against E. coli DNA gyrase. Novobiocin (IC50=0.168 μM [lit. 0.08 μM]) [82] was used as the positive control.
Conflict of interest
The authors declare no conflict of interest.
1.
Supporting information
As a service to our authors and readers, this journal provides supporting information supplied by the authors. Such materials are peer reviewed and may be re‐organized for online delivery, but are not copy‐edited or typeset. Technical support issues arising from supporting information (other than missing files) should be addressed to the authors.
Supporting Information
Acknowledgements
We acknowledge the great support from the Department of Chemistry, University of Helsinki, Finland. Specifically, we would like to thank Mr. Hassan Haddad, Ms. Karina Moslova and all researchers of the Department of Chemistry at the University of Helsinki for providing the necessary tools to conduct this research. Financial support from Tor, Joe and Pentti Borg's Memorial Foundation to R.B. and Slovenian Research Agency for J.I. (Grant No. P1‐0208) is gratefully acknowledged. The Sigrid Jusélius Foundation, Biocenter Finland Bioinformatics and Drug Discovery and Chemical Biology networks, CSC IT Center for Science, and Prof. Mark Johnson and Dr. Jukka Lehtonen are acknowledged for the excellent computational infrastructure at the Åbo Akademi University. This work contributes also to the activities within the strategic research profiling area Solutions for Health at Åbo Akademi University (Academy of Finland, #336355).
O. Moussaoui, R. Bhadane, R. Sghyar, J. Ilaš, E. M. El Hadrami, S. Chakroune, O. M. H. Salo-Ahen, ChemMedChem 2022, 17, e202100714.
Contributor Information
Oussama Moussaoui, Email: oussama.moussaoui@usmba.ac.ma.
Dr. Outi M. H. Salo‐Ahen, Email: outi.salo-ahen@abo.fi.
Data Availability Statement
The data that support the findings of this study are available in the supplementary material of this article.
References
- 1.J. O'Neill, Tackling Drug-Resistant Infections Globally: Final Report and Recommendations, Review On Antimicrobial Resistance, 2016.
- 2. Correia S., Poeta P., Hébraud M., Capelo J. L., Igrejas G., J. Med. Microbiol. 2017, 66, 551–559. [DOI] [PubMed] [Google Scholar]
- 3. Villa P., Arumugam N., Almansour A. I., Suresh Kumar R., Mahalingam S. M., Maruoka K., Thangamani S., Bioorg. Med. Chem. Lett. 2019, 29, 729–733. [DOI] [PubMed] [Google Scholar]
- 4. Alcaide B., Almendros P., Aragoncillo C., Curr. Opin. Drug Discovery Dev. 2010, 13, 685–697. [PubMed] [Google Scholar]
- 5. da Silva Mesquita R., Kyrylchuk A., Grafova I., Kliukovskyi D., Bezdudnyy A., Rozhenko A., Tadei W. P., Leskelä M., Grafov A., PLoS One 2020, 15, e0227811. [DOI] [PMC free article] [PubMed] [Google Scholar]
- 6. El-Sayed O. A., Al-Bassam B. A., Hussein M. E., Arch. Pharm. 2002, 335, 403–410. [DOI] [PubMed] [Google Scholar]
- 7. Mahamoud A., Chevalier J., Davin-Regli A., Barbe J., Pages J.-M., Curr. Drug Targets 2006, 7, 843–847. [DOI] [PubMed] [Google Scholar]
- 8. Bergh J. C. S., Tötterman T. H., Termander B. C., Strandgarden K. A.-M. P., Gunnarsson P. O. G., Nilsson B. I., Cancer Invest. 1997, 15, 204–211. [DOI] [PubMed] [Google Scholar]
- 9. Trivedi A., Dodiya D., Surani J., Jarsania S., Mathukiya H., Ravat N., Shah V., Arch. Pharm. 2008, 341, 435–439. [DOI] [PubMed] [Google Scholar]
- 10. Rano T. A., Sieber-McMaster E., Pelton P. D., Yang M., Demarest K. T., Kuo G.-H., Bioorg. Med. Chem. Lett. 2009, 19, 2456–2460. [DOI] [PubMed] [Google Scholar]
- 11. Moussaoui O., El Hadrami E. M., Benjalloune Touimi G., Bennani B., Ben Tama A., Chakroune S., Boukir A., Mediterr. J. Chem. 2019, 9, 326–336. [Google Scholar]
- 12. Moussaoui O., Bhadane R., Sghyar R., El Hadrami E. M., El Amrani S., Ben Tama A., Kandri Rodi Y., Chakroune S., Salo-Ahen O. M. H., Sci. Pharm. 2020, 88, 57. [Google Scholar]
- 13. Sekgota K. C., Majumder S., Isaacs M., Mnkandhla D., Hoppe H. C., Khanye S. D., Kriel F. H., Coates J., Kaye P. T., Bioorg. Chem. 2017, 75, 310–316. [DOI] [PubMed] [Google Scholar]
- 14. Sakharov P. A., Rostovskii N. V., Khlebnikov A. F., Panikorovskii T. L., Novikov M. S., Org. Lett. 2019, 21, 3615–3619. [DOI] [PubMed] [Google Scholar]
- 15. Aly A. A., Ishak E. A., Shwaky A. M., Mohamed A. H., Monatsh. Chem. 2020, 151, 223–229. [Google Scholar]
- 16. Katagi M. S., Fernandes J., Mamledesai S., Satyanarayana D., Dabadi P., Bolakatti G., J. Pharm. Res. 2015, 14, 51–56. [Google Scholar]
- 17. Xue W., Li X., Ma G., Zhang H., Chen Y., Kirchmair J., Xia J., Wu S., Eur. J. Med. Chem. 2020, 188, 112022. [DOI] [PubMed] [Google Scholar]
- 18. Govender H., Mocktar C., Kumalo H. M., Koorbanally N. A., Phosphorus Sulfur Silicon Relat. Elem. 2019, 194, 1074–1081. [Google Scholar]
- 19. Elenich O. V., Lytvyn R. Z., Blinder O. V., Skripskaya O. V., Lyavinets O. S., Pitkovych K. E., Obushak M. D., Yagodinets P. I., Pharm. Chem. J. 2019, 52, 969–974. [Google Scholar]
- 20. Ferretti M. D., Neto A. T., Morel A. F., Kaufman T. S., Larghi E. L., Eur. J. Med. Chem. 2014, 81, 253–266. [DOI] [PubMed] [Google Scholar]
- 21. Deng Q., Ji Q.-G., Ge Z.-Q., liu X.-F., Yang D., Yuan L.-J., Med. Chem. Res. 2014, 23, 5224–5236. [Google Scholar]
- 22. Parmar N. J., Pansuriya B. R., Parmar B. D., Barad H. A., Med. Chem. Res. 2014, 23, 42–56. [Google Scholar]
- 23. Patel R. V., Kumari P., Rajani D. P., Chikhalia K. H., J. Fluorine Chem. 2011, 132, 617–627. [Google Scholar]
- 24. Stepanenko I., Yamashkin S., Kostina Y., Batarsheva A., Mironov M., Res. Results Pharmacol. 2018, 4, 27–36. [Google Scholar]
- 25. Patel P. K., Patel R. V., Mahajan D. H., Parikh P. A., Mehta G. N., Pannecouque C., De Clercq E., Chikhalia K. H., J. Heterocycl. Chem. 2014, 51, 1641–1658. [Google Scholar]
- 26. Shaveta, Mishra S., Singh P., Eur. J. Med. Chem. 2016, 124, 500–536. [DOI] [PubMed] [Google Scholar]
- 27. Forezi L. S. M., Lima C. G. S., Amaral A. A. P., Ferreira P. G., Souza M. C. B. V., Cunha A. C., da Silva F. C., Ferreira V. F., Chem. Rec. 2021, 21, 2782–2807. [DOI] [PubMed] [Google Scholar]
- 28. Gondru R., Kanugala S., Raj S., Ganesh Kumar C., Pasupuleti M., Banothu J., Bavantula R., Bioorg. Med. Chem. Lett. 2021, 33, 127746. [DOI] [PubMed] [Google Scholar]
- 29. Tratrat C., Curr. Top. Med. Chem. 2020, 20, 2235–2258. [DOI] [PubMed] [Google Scholar]
- 30. Petrova K. T., Potewar T. M., Correia-da-Silva P., Barros M. T., Calhelha R. C., Ćiric A., Soković M., Ferreira I. C. F. R., Carbohydr. Res. 2015, 417, 66–71. [DOI] [PubMed] [Google Scholar]
- 31. Turan-Zitouni G., Kaplancıklı Z. A., Yıldız M. T., Chevallet P., Kaya D., Eur. J. Med. Chem. 2005, 40, 607–613. [DOI] [PubMed] [Google Scholar]
- 32. Lakkakula R., Roy A., Mukkanti K., Sridhar G., Russ. J. Gen. Chem. 2019, 89, 831–835. [Google Scholar]
- 33. Mohammed M. K., Al-Shuhaib Z., Al-Shawi A. A. A., Mediterr. J. Chem. 2019, 9, 305–310. [Google Scholar]
- 34. Gour J., Gatadi S., Pooladanda V., Ghouse S. M., Malasala S., Madhavi Y. V., Godugu C., Nanduri S., Bioorg. Chem. 2019, 93, 103306. [DOI] [PubMed] [Google Scholar]
- 35. Huang R.-Z., Liang G.-B., Li M.-S., Fang Y.-L., Zhao S.-F., Zhou M.-M., Liao Z.-X., Sun J., Wang H.-S., MedChemComm 2019, 10, 584–597. [DOI] [PMC free article] [PubMed] [Google Scholar]
- 36. Whiting M., Muldoon J., Lin Y.-C., Silverman S. M., Lindstrom W., Olson A. J., Kolb H. C., Finn M. G., Sharpless K. B., Elder J. H., Fokin V. V., Angew. Chem. Int. Ed. 2006, 45, 1435–1439; [DOI] [PubMed] [Google Scholar]; Angew. Chem. 2006, 118, 1463–1467. [Google Scholar]
- 37. Cichero E., Buffa L., Fossa P., J. Mol. Model. 2011, 17, 1537–1550. [DOI] [PubMed] [Google Scholar]
- 38. Labadie G. R., de la Iglesia A., Morbidoni H. R., Mol. Diversity 2011, 15, 1017–1024. [DOI] [PubMed] [Google Scholar]
- 39. Huo J., Hu H., Zhang M., Hu X., Chen M., Chen D., Liu J., Xiao G., Wang Y., Wen Z., RSC Adv. 2017, 7, 2281–2287. [Google Scholar]
- 40. Diaz-Ortiz A., Prieto P., Carrillo J. R., Martin R., Torres I., Curr. Org. Chem. 2015, 19, 568–584. [Google Scholar]
- 41. Ghosh S., Verma A., Mukerjee A., Mandal M. K., Arab. J. Chem. 2019, 12, 3046–3053. [Google Scholar]
- 42. Gümüs A., Okumuş V., Turk. J. Chem. 2018, 42, 1344–1357. [Google Scholar]
- 43. Huisgen R., Angew. Chem. 1963, 75, 604–637; [Google Scholar]; Angew. Chem. Int. Ed. 1963, 2, 565–598. [Google Scholar]
- 44. Huisgen R., J. Org. Chem. 1976, 41, 403–419. [Google Scholar]
- 45. Gothelf K. V., Jørgensen K. A., Chem. Rev. 1998, 98, 863–910. [DOI] [PubMed] [Google Scholar]
- 46. Fichtali I., Chraibi M., Aroussi F. E., Bentama A., Hadrami E. M. E., Benbrahim K. F., Stiriba S.-E., Der Pharma Chemica 2016, 8, 236–242. [Google Scholar]
- 47. Bahsis L., Ben El Ayouchia H., Anane H., Ramirez de Arellano C., Bentama A., El Hadrami E., Julve M., Domingo L., Stiriba S.-E., Catalysts 2019, 9, 687. [Google Scholar]
- 48. Agouram N., Hadrami E. M. E., Tama A. B., Julve M., Anane H., Stiriba S.-E., Der Pharma Chemica 2016, 8, 499–506. [Google Scholar]
- 49. Rostovtsev V. V., Green L. G., Fokin V. V., Sharpless K. B., Angew. Chem. Int. Ed. Engl. 2002, 41, 2596–2599. [DOI] [PubMed] [Google Scholar]
- 50. Tornøe C. W., Christensen C., Meldal M., J. Org. Chem. 2002, 67, 3057–3064. [DOI] [PubMed] [Google Scholar]
- 51. Mandoli A., Molecules 2016, 21, 1174. [Google Scholar]
- 52. Makosza M., Pure Appl. Chem. 1975, 43, 439–462. [Google Scholar]
- 53. Mąkosza M., Fedoryński M., in: Encyclopedia of Catalysis (Ed.: Horváth I.), John Wiley & Sons, Inc., Hoboken, NJ, USA, 2010, p. eoc170.pub2. [Google Scholar]
- 54. Keita A., Lazrak F., Essassi E. M., Alaoui I. C., Rodi Y. K., Bellan J., Pierrot M., Phosphorus Sulfur Silicon Relat. Elem. 2003, 178, 1541–1548. [Google Scholar]
- 55. Moussaoui O., Byadi S., Eddine Hachim M., Sghyar R., Bahsis L., Moslova K., Aboulmouhajir A., Rodi Y. K., Podlipnik Č., Hadrami E. M. E., Chakroune S., J. Mol. Struct. 2021, 1241, 130652. [Google Scholar]
- 56. Zaidan M. R. S., Noor Rain A., Badrul A. R., Adlin A., Norazah A., Zakiah I., Trop. Biomed. 2005, 22, 165–170. [PubMed] [Google Scholar]
- 57. Ouedrhiri W., Bouhdid S., Balouiri M., Lalami A. E. O., Moja S., Chahdi F. O., Greche H., J. Chem. Pharm. Res. 2015, 7, 78–84. [Google Scholar]
- 58. Costenaro L., Grossmann J. G., Ebel C., Maxwell A., Structure 2007, 15, 329–339. [DOI] [PubMed] [Google Scholar]
- 59. Collin F., Karkare S., Maxwell A., Appl. Microbiol. Biotechnol. 2011, 92, 479–497. [DOI] [PMC free article] [PubMed] [Google Scholar]
- 60. Bax B. D., Chan P. F., Eggleston D. S., Fosberry A., Gentry D. R., Gorrec F., Giordano I., Hann M. M., Hennessy A., Hibbs M., Huang J., Jones E., Jones J., Brown K. K., Lewis C. J., May E. W., Saunders M. R., Singh O., Spitzfaden C. E., Shen C., Shillings A., Theobald A. J., Wohlkonig A., Pearson N. D., Gwynn M. N., Nature 2010, 466, 935–940. [DOI] [PubMed] [Google Scholar]
- 61. Basri D. F., Luoi C. K., Azmi A. M., Latip J., Pharmaceuticals 2012, 5, 1032–1043. [DOI] [PMC free article] [PubMed] [Google Scholar]
- 62. Shelley J. C., Cholleti A., Frye L. L., Greenwood J. R., Timlin M. R., Uchimaya M., J. Comput.-Aided Mol. Des. 2007, 21, 681–691. [DOI] [PubMed] [Google Scholar]
- 63. Roos K., Wu C., Damm W., Reboul M., Stevenson J. M., Lu C., Dahlgren M. K., Mondal S., Chen W., Wang L., Abel R., Friesner R. A., Harder E. D., J. Chem. Theory Comput. 2019, 15, 1863–1874. [DOI] [PubMed] [Google Scholar]
- 64. Singh S. B., Kaelin D. E., Wu J., Miesel L., Tan C. M., Black T., Nargund R., Meinke P. T., Olsen D. B., Lagrutta A., Lu J., Patel S., Rickert K. W., Smith R. F., Soisson S., Sherer E., Joyce L. A., Wei C., Peng X., Wang X., Fukuda H., Kishii R., Takei M., Takano H., Shibasaki M., Yajima M., Nishimura A., Shibata T., Fukuda Y., Bioorg. Med. Chem. Lett. 2015, 25, 1831–1835. [DOI] [PubMed] [Google Scholar]
- 65. Chan P. F., Srikannathasan V., Huang J., Cui H., Fosberry A. P., Gu M., Hann M. M., Hibbs M., Homes P., Ingraham K., Pizzollo J., Shen C., Shillings A. J., Spitzfaden C. E., Tanner R., Theobald A. J., Stavenger R. A., Bax B. D., Gwynn M. N., Nat. Commun. 2015, 6, 10048. [DOI] [PMC free article] [PubMed] [Google Scholar]
- 66. Brvar M., Perdih A., Renko M., Anderluh G., Turk D., Solmajer T., J. Med. Chem. 2012, 55, 6413–6426. [DOI] [PubMed] [Google Scholar]
- 67. Berman H. M., Westbrook J., Feng Z., Gilliland G., Bhat T. N., Weissig H., Shindyalov I. N., Bourne P. E., Nucleic Acids Res. 2000, 28, 235–242. [DOI] [PMC free article] [PubMed] [Google Scholar]
- 68. Madhavi Sastry G., Adzhigirey M., Day T., Annabhimoju R., Sherman W., J. Comput.-Aided Mol. Des. 2013, 27, 221–234. [DOI] [PubMed] [Google Scholar]
- 69. Goodford P. J., J. Med. Chem. 1985, 28, 849–857. [DOI] [PubMed] [Google Scholar]
- 70. Wade R. C., Goodford P. J., J. Med. Chem. 1993, 36, 148–156. [DOI] [PubMed] [Google Scholar]
- 71. Wade R. C., Clark K. J., Goodford P. J., J. Med. Chem. 1993, 36, 140–147. [DOI] [PubMed] [Google Scholar]
- 72. Friesner R. A., Banks J. L., Murphy R. B., Halgren T. A., Klicic J. J., Mainz D. T., Repasky M. P., Knoll E. H., Shelley M., Perry J. K., J. Med. Chem. 2004, 47, 1739–1749. [DOI] [PubMed] [Google Scholar]
- 73. Halgren T. A., Murphy R. B., Friesner R. A., Beard H. S., Frye L. L., Pollard W. T., Banks J. L., J. Med. Chem. 2004, 47, 1750–1759. [DOI] [PubMed] [Google Scholar]
- 74. Friesner R. A., Murphy R. B., Repasky M. P., Frye L. L., Greenwood J. R., Halgren T. A., Sanschagrin P. C., Mainz D. T., J. Med. Chem. 2006, 49, 6177–6196. [DOI] [PubMed] [Google Scholar]
- 75. Jacobson M. P., Friesner R. A., Xiang Z., Honig B., J. Mol. Biol. 2002, 320, 597–608. [DOI] [PubMed] [Google Scholar]
- 76. Jacobson M. P., Pincus D. L., Rapp C. S., Day T. J. F., Honig B., Shaw D. E., Friesner R. A., Proteins 2004, 55, 351–367. [DOI] [PubMed] [Google Scholar]
- 77. Li J., Abel R., Zhu K., Cao Y., Zhao S., Friesner R. A., Proteins Struct. Funct. Bioinf. 2011, 79, 2794–2812. [DOI] [PMC free article] [PubMed] [Google Scholar]
- 78. Bochevarov A. D., Harder E., Hughes T. F., Greenwood J. R., Braden D. A., Philipp D. M., Rinaldo D., Halls M. D., Zhang J., Friesner R. A., Int. J. Quantum Chem. 2013, 113, 2110–2142. [Google Scholar]
- 79. Grimme S., Antony J., Ehrlich S., Krieg H., J. Chem. Phys. 2010, 132, 154104. [DOI] [PubMed] [Google Scholar]
- 80. Philipp D. M., Watson M. A., Yu H. S., Steinbrecher T. B., Bochevarov A. D., Int. J. Quantum Chem. 2018, 118, e25561. [Google Scholar]
- 81. Bochevarov A. D., Watson M. A., Greenwood J. R., Philipp D. M., J. Chem. Theory Comput. 2016, 12, 6001–6019. [DOI] [PubMed] [Google Scholar]
- 82. Alt S., Mitchenall L. A., Maxwell A., Heide L., J. Antimicrob. Chemother. 2011, 66, 2061–2069. [DOI] [PubMed] [Google Scholar]
Associated Data
This section collects any data citations, data availability statements, or supplementary materials included in this article.
Supplementary Materials
As a service to our authors and readers, this journal provides supporting information supplied by the authors. Such materials are peer reviewed and may be re‐organized for online delivery, but are not copy‐edited or typeset. Technical support issues arising from supporting information (other than missing files) should be addressed to the authors.
Supporting Information
Data Availability Statement
The data that support the findings of this study are available in the supplementary material of this article.