

Abstract
Aims
To estimate prevalence of alcohol use disorders (AUD) and alcohol dependence (AD) for Russia in 2019, based on clients in primary health‐care facilities.
Design
Cross‐sectional assessment of AUD and AD. Prevalence estimates were cross‐validated using a treatment multiplier methodology.
Setting
A total of 21 primary health‐care facilities, including dispanserization units (population health preventive care settings).
Participants
A total of 2022 participants (986 women and 1036 men) 18 years of age and older.
Measurements
Composite International Diagnostic Interview.
Findings
The prevalence of AD and AUD was 7.0% [95% confidence interval (CI) = 5.9–8.1%] and 12.2% (95% CI = 10.8–13.6%), respectively. Marked sex differences were observed for the prevalence of AD (women: 2.8%; 95% CI = 1.7–3.8%; men: 12.2%; 95% CI = 10.3–14.1%) and AUD (women: 6.1%; 95% CI = 4.6–7.7%; men: 19.5%; 95% CI = 17.2–21.8%). Age patterns of AD and AUD prevalence were sex‐specific. Among women, the prevalence of AUD and AD was highest in the youngest age group and decreased with age. Among men, the prevalence of AUD and AD was highest among men aged 45–59 years. Sensitivity analyses indicated that the prevalence of AD as estimated using a treatment multiplier (6.5%; 95% CI = 5.0–8.9%) was similar to the estimates of the main analysis.
Conclusions
Even though alcohol use has declined since 2003 in Russia, the prevalence of alcohol use disorders and alcohol dependence remains high at approximately 12 and 7%, respectively.
Keywords: Alcohol, alcohol use disorders, dependence, prevalence, Russia, treatment
INTRODUCTION
Alcohol use is a major risk factor for mortality and burden of disease [1], with alcohol use disorders (AUD) and alcohol dependence (AD), in particular, contributing markedly to this burden [2]. Russia and other eastern European countries have long been identified as having high alcohol consumption levels, and consequently one of the highest alcohol‐attributable burden of disease rates globally [3, 4].
Despite the high burden of alcohol‐attributable disease, research on the epidemiology of AUD and AD in Russia has been scarce, even though such data are relevant for health‐care planning. To our knowledge, there has been no national survey on AUD reported for Russia in the past decade and, as a result, the prevalence of AUD and AD used in major comparative risk assessments or policy studies has been estimated indirectly based on treatment statistics [1, 5] using the treatment multiplier methodology common in the epidemiology of illicit drugs [6]. A recent validation study to adapt the Alcohol Use Disorder Identification Test (AUDIT) for Russia [7, 8] provides an opportunity to assess the prevalence of AD and AUD for 2019, and to validate whether the previous estimates of AUD and AD based on treatment statistics were accurate. Thus, the main objective was to determine the prevalence of AUD and AD and to discuss the results.
METHODS
Design and sample
This study is a secondary analysis of national cross‐sectional survey data (see [7, 8] for a description of the survey methodology). A total of 21 publicly owned primary health‐care facilities, covering seven of eight Federal Districts of the Russian Federation, participated in the data collection. The primary health‐care system in Russia is complex and more extensive than in European high‐income countries [9]. Polyclinics, as the major providers of primary health‐care, offer not only services from general practitioners, but also from specialists such as surgeons and cardiologists, whose services are considered to be part of primary health‐care services under Russian law [10]. The large‐scale federal program of ‘dispanserization’ is also part of primary health‐care and is carried out in polyclinics; dispanserization comprises a wide range of regular preventive check‐ups and screenings for the entire population, including screening for potential alcohol use disorders. In 2018, the year before the study, 60% of the general population was covered by these preventive screenings [11], and another 60% visited their general practitioner (GP) at least once in that year [12]. The overlap between the population covered by preventive screenings and those who visited their GP is unknown.
Between August 2019 and February 2020, a sample of 2173 participants were recruited from rural and urban facilities, with at least 200 participants from each region. A quota sampling design was implemented for each region to achieve representation of important sociodemographic groups, which included quotas of 50% men, 50% patients aged 40 years and older and a limit of 50% of patients recruited from dispanserization settings. All patients who visited a participating primary health‐care facility on the day of the interviews, who were aged at least 18 years and able to give informed consent, were eligible for the study.
Interview and measures
Trained interviewers conducted face‐to‐face interviews following a standardized assessment chart [13]. The World Health Organization Composite International Diagnostic Interview (WHO CIDI) served to assess the past 12‐month prevalence of AD and AUDs (the latter defined as either AD or harmful use) as defined by the ICD‐10 [14]). The CIDI version used was based on the version adapted for and used in a large study in primary health‐care centres in six European countries [15], translated into Russian and back‐translated with the support of an expert panel, which included narcologists (i.e. psychiatrists, who are addiction treatment specialists) among other specialists [16]. The CIDI has been shown to perform similarly to psychiatric interviews or the Schedule for Clinical Assessment in Neuropsychiatry in a large WHO reliability and validity study [17]. AUDs were assessed for all people with a country‐adapted AUDIT (RUS‐AUDIT) score of 5 or higher [7]. To conserve resources and reduce the interview burden for respondents, only every third patient with an AUDIT score of 4 or lower was assessed for AUDs, by design. Figure 1 gives an overview of the assessment process and the statistical procedures applied.
FIGURE 1.

Overview of data assessment procedures and processing. The Russian version of the Alcohol Use Disorders Identification Test (AUDIT) (RUS‐AUDIT [7, 8) was used to measure hazardous and harmful use of alcohol and to screen for alcohol use disorder (AUD) and alcohol dependence (AD). The Composite International Diagnostic Interview (CIDI) was used to measure 12‐month prevalence of AUD and AD
Statistical analysis and weighting
The past‐year (12‐month) prevalence of AD and AUD was derived from the CIDI using population weights based on sex and age (18–29, 30–45, 46–59, 60–74, ≥75 years of age) [18]. Participants who abstained from alcohol during the past year were assumed to have had neither AD nor AUD in the past year. By design, the CIDI was given to only a random subsample of participants who scored 4 or less on the AUDIT; for these participants without CIDI scores, AD and AUD statuses were imputed based on the sex‐specific prevalence. This imputation was performed for 299 individuals and resulted in an estimate of two individuals with AD and 15 individuals with AUD. Statistical differences by sex, age and the interaction of sex and age were determined by logistic regression, where the interaction between age and sex was estimated using a likelihood ratio test which compared a model with an interaction term and a model without an interaction term for age and sex. As AUD and AD are overlapping outcomes, we applied a Bonferroni correction.
For the sensitivity analysis, prevalence of AD was estimated via the multiplier method using treatment data as reported by the V. Serbsky Federal Medical Research Centre of Psychiatry and Narcology of the Ministry of Health of the Russian Federation [19]. This centre publishes national and regional treatment data on alcohol and drug use disorders. Average treatment coverage was taken from the meta‐analysis of Mekonen and colleagues [20].
All statistical calculations were performed using SYSTAT version 13.2 [21] and R [22]. As the analysis was not pre‐registered, the results should be considered exploratory.
RESULTS
Of the 2173 people eligible based on our selection criteria, 143 (6.6%) declined to participate, two did not fall within the required age range (18 years and older) and six did not identify their sex. Among the 2022 people (986 women and 1036 men) who participated in the study, the age range was 18–96 years, with an average age of 43.1 [standard deviation (SD) = 16.0] and 40.7 (SD = 15.3) for women and men, respectively. A total of 30.7% finished special secondary education (e.g. technical schools), 39.3% completed some form of higher education and 55.3% were married; 20.2% of the sample indicated that they did not have enough money for food and/or clothing, and a further 43.1% indicated that they had sufficient resources for for food and clothing, but some could not afford to purchase large household appliances. Of all the participants, 26.5% were current smokers.
A total of 1513 participants (74.8%) reported alcohol use in the past year, of whom 1497 (688 women and 809 men) provided valid responses to the AUDIT questions (i.e. 98.9% of the completed forms had no missing values).
The prevalence of AD and AUD was 7.0% [95% confidence interval (CI) = 5.9–8.1%] and 12.2% (95% CI = 10.8–13.6%), respectively (Table 1). Marked sex differences were observed for the prevalence of AD (women: 2.8%, 95% CI = 1.7–3.8%; men: 12.2%, 95% CI = 10.3–14.1%) and AUD (women: 6.1%, 95% CI = 4.6–7.7%; men: 19.5%, 95% CI = 17.2–21.8%). The sex differences proved significant for both AD and AUD on the Bonferroni‐adjusted 2.5% alpha level (see Table 2).
TABLE 1.
Prevalence of alcohol dependence (AD) and alcohol use disorders (AUD) in Russia in 2019 by sex
| Sex | Alcohol dependence | Alcohol use disorders | ||
|---|---|---|---|---|
| Prevalence | (95% CI) | Prevalence | (95% CI) | |
| Men | 12.2% | (10.3, 14.1%) | 19.5% | (17.2, 21.8%) |
| Women | 2.8% | (1.7, 3.8%) | 6.1% | (4.6, 7.7%) |
| Total | 7.0% | (5.9–8.1%) | 12.2% | (10.8–13.6%) |
Sex differences were statistically significant for both alcohol dependence and alcohol use disorders (see Table 2 for details). CI = confidence interval.
TABLE 2.
The association of sex and age with alcohol use disorders and alcohol dependence
| Sex/measure | Alcohol use disorders | Alcohol dependence | ||||||
|---|---|---|---|---|---|---|---|---|
| Odds ratio | (95% CI) | P‐value | Interaction by sex (P‐value) a | Odds ratio | (95% CI) | P‐value | Interaction by sex (P‐value) a | |
| Total | ||||||||
| Age (10‐year increase) | 0.96 | (0.88, 1.04) | 0.307 | 0.001 | 0.96 | (0.86, 1.07) | 0.413 | < 0.001 |
| Sex (men compared to women) | 2.86 | (2.14, 3.81) | < 0.001 | 3.58 | (2.41, 5.32) | < 0.001 | ||
| Males | ||||||||
| Age (10‐year increase) | 1.05 | (0.95, 1.16) | 0.386 | 1.06 | (0.94, 1.19) | 0.377 | ||
| Females | ||||||||
| Age (10‐year increase) | 0.76 | (0.64, 0.91) | 0.002 | 0.65 | (0.50, 0.86) | 0.002 | ||
The significance of the interaction between age and sex was estimated using a likelihood ratio test which compared a model with an interaction term to a model without an interaction term for age and sex.
The prevalence of AD and AUD by age and sex can be found in Figs 1 and 2. For both indicators there seem to be sex‐specific age patterns. For women, we find a continuously decreasing pattern with the highest prevalence in the youngest age group, and almost no AD or AUD for women above the age of 75 years. For men, the 45–59‐year‐olds have the highest prevalence, and while prevalence decreases in older ages it is still considerable, even for the over 75‐year‐olds. The interaction between sex and age was significant at the Bonferroni‐adjusted level of 2.5% for both AD and AUD (see Table 2).
FIGURE 2.
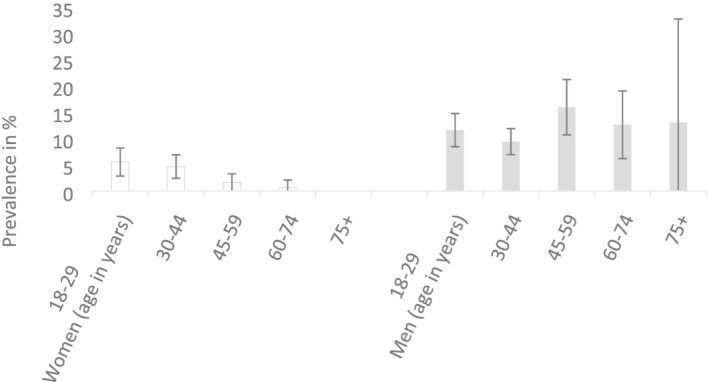
Prevalence of alcohol dependence in Russia in 2019 by sex and age
Using the treatment multiplier yielded an estimate for AD of 6.5% (95% CI = 5.0%, 8.9%). Not only is the treatment‐based point estimate very close to the estimated prevalence from the survey, the CI from the survey (Table 1) falls completely within the larger interval produced when calculating the prevalence using the treatment multiplier estimate (Fig. 3).
FIGURE 3.

Prevalence of alcohol use disorders in Russia in 2019 by sex and age
DISCUSSION
This contribution calculates survey‐derived estimates for the prevalence of AD and AUD for Russia, and compares the overall numbers with existing treatment‐derived data. This study found an overall prevalence of AD and AUD of 7.0 and 12.2%, respectively, indicating that Russia has one of the highest prevalences in the world (for comparisons, see [23]), surpassing even the average prevalence of the WHO European region by 86 and 30% for AD and AUD, respectively.
The current prevalence estimates are limited, as they are based on a survey of all patients attending primary health‐care facilities on a single day, and are not based on a probability sample with a sampling frame comprising all adults in the Russian Federation. Such a sampling frame would be impractical and costly to implement due to the size of the country. Furthermore, current rates of response for household‐based surveys (e.g. [24]) indicate that such a survey would not be representative based on sampling and response biases [25, 26, 27]. However, the response rate of 93.4% for this study is much higher than the response rate for general population surveys. For the 6.6.% non‐responders we needed to assume similar drinking patterns as for the whole sample. Furthermore, Russian surveys on alcohol, as in almost all survey‐based alcohol studies, underestimate the overall level of drinking when compared to alcohol sales, or to production, import and export data [28]. It may be argued that the prevalence among primary care patients is higher than among the general population, as people visit such facilities due to health problems [29]. However, we have reason to believe that the surveyed participants are quite similar to the general population. Due to the specifics of the Russian health‐care system and the overall legislative framework, a very high proportion of primary health‐care visits are not related to the provision of medical care as such. For instance, an analysis of more than 2500 medical records from a Moscow city polyclinic in 2017 suggests that almost half of the patients’ visits to GPs did not involve the provision of any direct medical care [30]. Given the multiple functions of Russian polyclinics, including prevention, we believe that we have covered a large variety of individuals. The non‐response rate was very low (6.6%), and while we cannot rule out the possibility that the characteristics of non‐responders were different from responders with respect to their levels of drinking and AUD, it is unlikely that this would have caused a large bias.
Another limitation relates to the fact that any assessment of AD and AUD may be susceptible to social‐desirability biases, especially in Russia. In Russia, those with an AUD are nationally registered, which may be associated with difficulties in finding or maintaining employment. In line with current regulations, narcological registration restricts patients from holding certain professions (professional drivers, law enforcement officers and professionals who operate heavy machinery, for instance) and employers often check for the presence of narcological registration even when hiring for other positions which are not subject to this rule [31]. However, as patients with AUDs were not registered in the narcology system due to the results of their testing while participating in the survey, the study may, in fact, have elicited more truthful responses, as there was no fear of registration and its consequences.
Russia is still a country with a high prevalence of AUD, and especially of AD. The respective prevalence numbers for the European Union (EU) in 2010 were 3.4% for AD (1.7% for women and 5.2% for men [32]), both of which comprise fewer than half the Russian estimates for the overall prevalence and for men alone. Furthermore, the sex ratio in AD was lower in Russia (1:4.3) than in the EU (1:3.1; EU numbers from [32]). It should be noted that the last review of AD in Europe used here was for 2010. However, given the stability of alcohol per capita consumption for the EU, there is no reason to believe that EU prevalence has increased over the past decade. Finally, the age patterns for AD and AUD were sex‐specific in Russia. While men shared the traditional age pattern of several other central and eastern European countries [33], women were found to show a decreasing pattern with age, as is typical for North America [34] and in most samples in the World Mental Health Survey [35]. It would be very interesting to further explore cultural differences in these sex × age patterns found for AUD.
CONCLUSION
While the prevalence of AD and AUD is high in Russia there is a clear downward trend, at least from currently available data. Based on treatment data, this trend has been moving steadily downwards in recent years, with rates being reduced to almost one‐third of the rate reported in 2003 [5, 36]. This reflects the much‐reduced alcohol consumption in Russia during this time—in large part a result of Russia’s national strategy to reduce the prevalence of AUD at the population level, and the increase in alcohol control policy measures which led to a reduction in the affordability and availability of alcoholic beverages, including unrecorded alcohol [5, 31].
DECLARATION OF INTERESTS
The authors have no conflicts of interest to declare. The authors alone are responsible for the views expressed in this publication and these do not necessarily represent the decisions or the stated policy of the World Health Organization, where C.F.‐B. and M.N. are staff members.
AUTHOR CONTRIBUTIONS
Jurgen Rehm: Conceptualization; formal analysis; funding acquisition; methodology; project administration; resources; supervision; validation. Kevin Shield: Formal analysis; investigation; methodology; supervision. Anna Bunova: Conceptualization; investigation. Carina Ferreira‐Borges: Funding acquisition; resources; supervision. Ari Franklin: Data curation. Boris Gornyi: Conceptualization; investigation. Pol Rovira: Formal analysis; visualization. Maria Neufeld: Data curation; investigation; validation.
ACKNOWLEDGEMENTS
We would like to thank the 2019/2020 RUS‐AUDIT Collaborators and the RUS‐AUDIT Project Advisory Board, without whom the present contribution would not have been possible. The original study on the validation of the AUDIT was supported by the Government of the Russian Federation and the Government of Germany through the WHO Office in the Russian Federation and the WHO European Office for Prevention and Control of Noncommunicable Diseases. J.R. was additionally supported by funding from the Canadian Institutes of Health Research, Institute of Neurosciences and Mental Health and Addiction (CRISM Ontario Node grant no. SMN‐13950). There was no specific funding for the present investigation.
Rehm J, Shield KD, Bunova A, Ferreira‐Borges C, Franklin A, Gornyi B, et al. Prevalence of alcohol use disorders in primary health‐care facilities in Russia in 2019. Addiction. 2022;117:1640–1646. 10.1111/add.15816
Funding information Institute of Neurosciences, Mental Health and Addiction, Grant/Award Number: SMN‐13950; Ministry of Health of the Russian Federation, Grant/Award Number: n.a.; Canadian Institutes of Health Research
REFERENCES
- 1. Shield K, Manthey J, Rylett M, Probst C, Wettlaufer A, Parry CDH, et al. National, regional, and global burdens of disease from 2000 to 2016 attributable to alcohol use: a comparative risk assessment study. Lancet Public Health. 2020;5:e51–61. [DOI] [PubMed] [Google Scholar]
- 2. Rehm J, Shield K, Gmel G, Rehm M, Frick U. Modeling the impact of alcohol dependence on mortality burden and the effect of available treatment interventions in the European Union. Eur Neuropsychopharmacol. 2013;23:89–97. [DOI] [PubMed] [Google Scholar]
- 3. Global Burden of Disease (GBD) 2016 Russia Collaborators . Burden of disease in Russia, 1980–2016: a systematic analysis for the Global Burden of Disease Study 2016. Lancet. 2018;392:1138–46. [DOI] [PMC free article] [PubMed] [Google Scholar]
- 4. Nemtsov AV. A Contemporary History of Alcohol in Russia. Stockholm, Sweden: Södertörns högskola; 2011. [Google Scholar]
- 5. World Health Organization (WHO) Regional Office for Europe . Alcohol Policy Impact Case Study. The effects of alcohol control measures on mortality and life expectancy in the Russian Federation. Copenhagen, Denmark: WHO Regional Office for Europe; 2019. Available at: http://www.euro.who.int/en/health-topics/disease-prevention/alcohol-use/publications/2019/alcohol-policy-impact-case-study-the-effects-of-alcohol-control-measures-on-mortality-and-life-expectancy-in-the-russian-federation-2019 (accessed 21 October 2021).
- 6. European Monitoring Centre for Drugs and Drug Addiction (EMCDDA) . EMCDDA Recommended Draft Technical Tools and Guidelines—Key Epidemiological Indicator: Prevalence of problem drug use. Lisbon, Portugal: EMCDDA; 2004. Available at: https://www.emcdda.europa.eu/system/files/publications/321/Guidelines_Prevalence_Revision_280704_b-1_124620.pdf (accessed 3 July 2021).
- 7. Rehm J, Neufeld M, Yurasova E, Bunova A, Gil A, Gornyi B, et al. Adaptation of and protocol for the validation of the Alcohol Use Disorders Identification Test (AUDIT) in the Russian Federation for use in primary healthcare. Alcohol Alcohol. 2020;55:624–30. [DOI] [PMC free article] [PubMed] [Google Scholar]
- 8. Neufeld M, Rehm J, Bunova A, Gil A, Gornyi B, Rovira P, et al. Validation of a screening test for alcohol use, the Russian Federation. Bull World Health Organ. 2021;99:496–505. [DOI] [PMC free article] [PubMed] [Google Scholar]
- 9. Sheiman I, Shishkin S, Shevsky V. The evolving Semashko model of primary health care: the case of the Russian Federation. Risk Manag Healthc Policy. 2018;11:209–20. [DOI] [PMC free article] [PubMed] [Google Scholar]
- 10. Ministry of Health of the Russian Federation Federal’nyj zakon ot 21 nojabrja 2011 g. no. 323‐FZ ‘Ob osnovah ohrany zdorov'ja grazhdan v Rossijskoj Federacii’ [Federal Law of November 21, 2011 no. 323‐FZ ‘On the Basics of Health Protection of Citizens in the Russian Federation’]; 2011. Available at: https://minzdrav.gov.ru/documents/7025-federalnyy-zakon-323-fz-ot-21-noyabrya-2011-g (accessed 13 October 2021).
- 11. Starodubov VI, Son IM, Senenko AS, Savchenko ED, Dzjuba NA, Zaharchenko OO et al. Itogi dispanserizacii opredelennyh grupp vzroslogo naselenija Rossijskoj Federacii, 2013–2018 gg [Results of dispanserization of certain groups of the adult population of the Russian Federation, 2013–2018]. Central Research Institute of Organization and Informatization of Health Care of the Ministry of Health of the Russian Federation; 2019. Available at: https://mednet.ru/images/materials/statistika/starodubov_i_soavt-itogi_dispanserizacii_vzr_naseleniya_2013-2018_gg.pdf (accessed 13 October 2021).
- 12. Statista . In general, how often do you visit/consult with primary care physicians* for yourself? Available at: https://www.statista.com/statistics/888375/visits-to-primary-care-physician-in-russia-by-frequency/ (accessed 13 October 2021).
- 13. World Health Organization . The RUS‐AUDIT Project Report. Adapting and validating the Alcohol Use Disorders Identification Test (AUDIT) in the Russian Federation 2021. Available at: https://apps.who.int/iris/bitstream/handle/10665/342123/9789289055765-eng.pdf (accessed 2 July 2021).
- 14. Carvalho AF, Heilig M, Perez A, Probst C, Rehm J. Alcohol use disorders. Lancet. 2019;394:781–92. [DOI] [PubMed] [Google Scholar]
- 15. Rehm J, Allamani A, Della Vedova R, Elekes Z, Jakubczyk A, Landsmane I, et al. General practitioners recognizing alcohol dependence: a large cross‐sectional study in 6 European countries. Ann Fam Med. 2015;13:28–32. [DOI] [PMC free article] [PubMed] [Google Scholar]
- 16. World Health Organization . The RUS‐AUDIT Validation Study Protocol. Adapting and validating the Alcohol Use Disorders Identification Test (AUDIT) in the Russian Federation 2021. Available at: https://www.euro.who.int/en/health-topics/disease-prevention/alcohol-use/publications/2021/the-rus-audit-validation-study-protocol-adapting-and-validating-the-alcohol-use-disorders-identification-test-audit-in-the-russian-federation-2021 (accessed 2 July 2021).
- 17. Üstün BT, Compton W, Mager D, Babor T, Baiyewu O, Chatterji S, et al. WHO study on the reliability and validity of the alcohol and drug use disorder instruments: overview of methods and results. Drug Alcohol Depend. 1997;47:161–9. [DOI] [PubMed] [Google Scholar]
- 18. United Nations . World Population Statistics 2019. Data Query: United Nations; 2019. Available at: https://population.un.org/wpp/DataQuery/ (accessed June 2021).
- 19. Ministry of Health of the Russian Federation . Dejatel’nost’ narkologicheskoj sluzhby Rossijskoj Federacii v 2018–2019 godah. Analiticheskij obzor [Activities of the narcological service of the Russian Federation in 2018–2019. Analytical review]. Moscow, Russia: Ministry of Health of the Russian Federation; 2020. Available at: http://nncn.serbsky.ru/wp‐content/uploads/2020/10/%D0%9D%D0%B0%D1%80%D0%BA%D0%BE%D0%BB%D0%BE%D0%B3%D0%B8%D1%87%D0%B5%D1%81%D0%BA%D0%B0%D1%8F‐%D1%81%D0%BB%D1%83%D0%B6%D0%B1%D0%B0‐%D0%A0%D0%A4.‐%D0%90%D0%9E‐2018‐2019.pdf (accessed 2 July 2021).
- 20. Mekonen T, Chan GC, Connor J, Hall W, Hides L, Leung J. Treatment rates for alcohol use disorders: a systematic review and meta‐analysis. Addiction. 2020;116:2617–34. [DOI] [PubMed] [Google Scholar]
- 21. SYSTAT . SYSTAT version 13.2 2021. Available at: https://systatsoftware.com/products/systat/ (accessed 28 June 2021).
- 22. R Project . The R Project for Statistical Computing: R version 4.0.1 2021. Available at: https://www.r-project.org/ (accessed 20 October 2021).
- 23. World Health Organization . Global status report on alcohol and health 2018. Geneva, Switzerland: World Health Organization; 2018. Available at: https://www.who.int/substance_abuse/publications/global_alcohol_report/en/ (accessed 7 March 2021).
- 24. RLMS‐HSE . The Russia Longitudinal Monitoring Survey—Higher School of Economics: Frequently Asked Questions 2021. Available at: https://rlms-hse.cpc.unc.edu/data/documentation/faq/ (accessed 30 June 2021).
- 25. Kruskal W, Mosteller F. Representative sampling, III: The current statistical literature. Int Stat Rev. 1979;47:245–65. [Google Scholar]
- 26. Rehm J, Kilian C, Rovira P, Shield KD, Manthey J. The elusiveness of representativeness in general population surveys for alcohol. Drug Alcohol Rev. 2021;40:161–5. [DOI] [PubMed] [Google Scholar]
- 27. Shield KD, Rehm J. Difficulties with telephone‐based surveys on alcohol consumption in high‐income countries: the Canadian example. Int J Methods Psychiatr Res. 2012;21:17–28. [DOI] [PMC free article] [PubMed] [Google Scholar]
- 28. Rehm J, Klotsche J, Patra J. Comparative quantification of alcohol exposure as risk factor for global burden of disease. Int J Methods Psychiatr Res. 2007;16:66–76. [DOI] [PMC free article] [PubMed] [Google Scholar]
- 29. Manthey J, Gual A, Jakubczyk A, Pieper L, Probst C, Struzzo P, et al. Alcohol use disorders in Europe: a comparison of general population and primary health care prevalence rates. J Subst Abuse. 2016;21:478–84. [Google Scholar]
- 30. Agamov ZK. Analiz Struktury Poseshhenij Pacientami Vrachej Gorodskoj Polikliniki [Analysis of the structure of patients’ visits to doctors of the city polyclinic]. Issled Prak Med. 2018;5:142–8. [Google Scholar]
- 31. Neufeld M, Bunova A, Gornyi B, Ferreira‐Borges C, Gerber A, Khaltourina D, et al. Russia’s National Concept to reduce alcohol abuse and alcohol‐dependence in the population 2010–2020: which policy targets have been achieved? Int J Environ Res Public Health. 2020;17:8270. [DOI] [PMC free article] [PubMed] [Google Scholar]
- 32. Rehm J, Anderson P, Barry J, Dimitrov P, Elekes Z, Feijao F, et al. Prevalence of and potential influencing factors for alcohol dependence in Europe. Eur Addict Res. 2015;21:6–18. [DOI] [PubMed] [Google Scholar]
- 33. Rehm J, Room R, Van den Brink W, Jacobi F. Alcohol use disorders in EU countries and Norway: an overview of the epidemiology. Eur Neuropsychopharmacol. 2005;15:377–88. [DOI] [PubMed] [Google Scholar]
- 34. Grant BF, Goldstein RB, Saha TD, Chou SP, Jung J, Zhang H, et al. Epidemiology of DSM‐5 alcohol use disorder: results from the National Epidemiologic Survey on alcohol and related conditions III. JAMA Psychiatry. 2015;72:757–66. [DOI] [PMC free article] [PubMed] [Google Scholar]
- 35. Glantz MD, Bharat C, Degenhardt L, Sampson NA, Scott KM, Lim CC, et al. The epidemiology of alcohol use disorders cross‐nationally: findings from the world mental health surveys. Addict Behav. 2020;102:106128. [DOI] [PMC free article] [PubMed] [Google Scholar]
- 36. National Scientific Center of Narcology [A branch of the FSBI National Medical Research Center for Psychiatry and Narcology named after V.P. Serbsky of the Ministry of Health of Russia] . Home page Moscow2021. Available at: http://nncn.serbsky.ru (accessed 2 July 2021).