

Abstract
Gold mining is a major driver of Amazonian forest loss and degradation. As mining activity encroaches on primary forest in remote and inaccessible areas, satellite imagery provides crucial data for monitoring mining‐related deforestation. High‐resolution imagery, in particular, has shown promise for detecting artisanal gold mining at the forest frontier. An important next step will be to establish relationships between satellite‐derived land cover change and biodiversity impacts of gold mining. In this study, we set out to detect artisanal gold mining using high‐resolution imagery and relate mining land cover to insects, a taxonomic group that accounts for the majority of faunal biodiversity in tropical forests. We applied an object‐based image analysis (OBIA) to classify mined areas in an Indigenous territory in Guyana, using PlanetScope imagery with ~3.7 m resolution. We complemented our OBIA with field surveys of insect family presence or absence in field plots (n = 105) that captured a wide range of mining disturbances. Our OBIA was able to identify mined objects with high accuracy (>90% balanced accuracy). Field plots with a higher proportion of OBIA‐derived mine cover had significantly lower insect family richness. The effects of mine cover on individual insect taxa were highly variable. Insect groups that respond strongly to mining disturbance could potentially serve as bioindicators for monitoring ecosystem health during and after gold mining. With the advent of global partnerships that provide universal access to PlanetScope imagery for tropical forest monitoring, our approach represents a low‐cost and rapid way to assess the biodiversity impacts of gold mining in remote landscapes.
Keywords: Artisanal gold mining, biodiversity monitoring, Guyana, insect bioindicators, PlanetScope imagery
Gold mining is a major driver of Amazonian forest loss and degradation. As mining activity encroaches on primary forest in remote and inaccessible areas, satellite imagery provides crucial data for monitoring mining‐related deforestation. We apply high‐resolution satellite imagery to detect artisanal gold mining and relate mining land cover to insects, a taxonomic group that accounts for the majority of faunal biodiversity in tropical forests. We were able to detect mining land cover with >90% using an object‐based image analysis. Field plots with higher mine cover had significantly lower insect family richness. Insect groups that respond strongly to mining disturbance could potentially serve as bioindicators for monitoring ecosystem health during and after gold mining. With the advent of global partnerships that provide universal access to PlanetScope imagery for tropical forest monitoring, our approach represents a low‐cost and rapid way to assess the biodiversity impacts of gold mining in remote landscapes.

Introduction
Gold mining represents a major threat to ecosystem integrity, including tropical rainforests that harbor the majority of global terrestrial biodiversity (Hammond et al., 2007; Kalamandeen et al., 2020). Artisanal gold mining, an increasingly prevalent land use across the Amazon Basin, results in fine‐scale forest fragmentation that can metastasize to encompass large areas over time (Caballero Espejo et al., 2018). This type of gold mining spans the gamut of environmental degradation, including the immediate loss of forest cover, toxic mercury pollution, and long‐lasting topographic changes caused by river channel diversion (Alvarez‐Berríos et al., 2016; Markham & Sangermano, 2018).
Monitoring land cover change related to gold mining enables land managers to respond to illegal mining and identify areas needing restoration. Satellite imagery provides a solution for assessing mining‐related land cover changes in tropical rainforests. Freely available satellite imagery such as the multi‐decadal Landsat satellite archive can quantify forest cover loss related to gold mining, including the extent of mining in remote and inaccessible areas (Asner et al., 2013) and illicit mining activity outside of legal concessions (Elmes et al., 2014). While the Landsat archive's open access and global coverage has enabled decadal tracking of landcover change (Hansen et al., 2013; Vancutsem et al., 2021), the spatial resolution of Landsat (30 m) is not always sufficient to detect early stages of forest degradation (Asner et al., 2013). Higher resolution imagery, including aerial lidar and commercial SmallSat platforms, can enable early detection of environmental changes caused by gold mining, such as the loss of aboveground carbon (Csillik et al., 2019). Near real‐time alert systems for deforestation based on these remote sensing platforms are now feasible, with the potential to aid policies that seek to limit mining incursion in protected areas (Csillik & Asner, 2020).
Despite the utility of remote sensing for detecting environmental threats, many crucial biodiversity variables are unmeasurable from spaceborne sensors. Insect taxonomic richness exemplifies a biodiversity variable that is central to ecosystem function and requires labor‐intensive field sampling (Wagner et al., 2021). Consequently, community‐level insect data are frequently limited to a small spatial extent and the relationships between biodiversity and landscape‐scale mining degradation are not well understood (Sonter et al., 2018). For example, understanding how insect taxa respond to mining would have immediate practical relevance. The abundance of anopheline mosquitoes in areas impacted by gold mining drives malaria transmission in human communities (Moreno et al., 2007). Aquatic invertebrates within polluted areas can bioaccumulate toxins (Xie et al., 2009), harming people who consume fish from local waterways (Alpers et al., 2016). After mining has ceased, ant species composition can indicate the efficacy of mine rehabilitation efforts (Ribas et al., 2012). We propose that remote sensing metrics of land cover that correlate with insect bioindicators could be used to infer ecological degradation and recovery.
This study develops a protocol for linking satellite remote sensing to insect taxonomic richness in a biodiversity hotspot threatened by gold mining. We first used the Landsat satellite record to develop a spatial field sampling scheme for insect collection based on deforestation related to artisanal gold mining. We then sampled insect communities from the core to the edge of mined sites and determined the relationship between insect diversity and mining degradation, quantified using high‐resolution SmallSat imagery. Our work demonstrates how earth observation from high‐resolution satellite imagery can complement rapid biodiversity assessments based on field data collection. We address the following questions:
-
1
How accurately does PlanetScope imagery detect mining land cover degradation in an old‐growth tropical rainforest?
-
2
How does the presence or absence of insect taxa correlate with mining land cover classification derived from high‐resolution satellite imagery?
-
3
Is there a correlation between mining land cover and insect taxonomic richness?
Materials and Methods
Regional context and study site
Our study site is within the Guiana Shield ecoregion, one of the world's most extensive remaining tracts of old‐growth tropical rainforests (Fig. 1). In addition to being an important reservoir of forest carbon stocks, the Guiana Shield's continued intact state is crucial to the hydrological cycle in the adjacent Amazon Basin (Bovolo et al., 2018). The Guiana Shield is also a global hotspot for biodiversity, including many endemic species (Higgins, 2007). The main deforestation driver in these forests is artisanal gold mining, accounting for 70–80% of all forest loss in the three countries of Guyana, Suriname, and French Guiana that are fully within the Guiana Shield ecoregion (Dezécache et al., 2017; Hammond et al., 2007).
Figure 1.
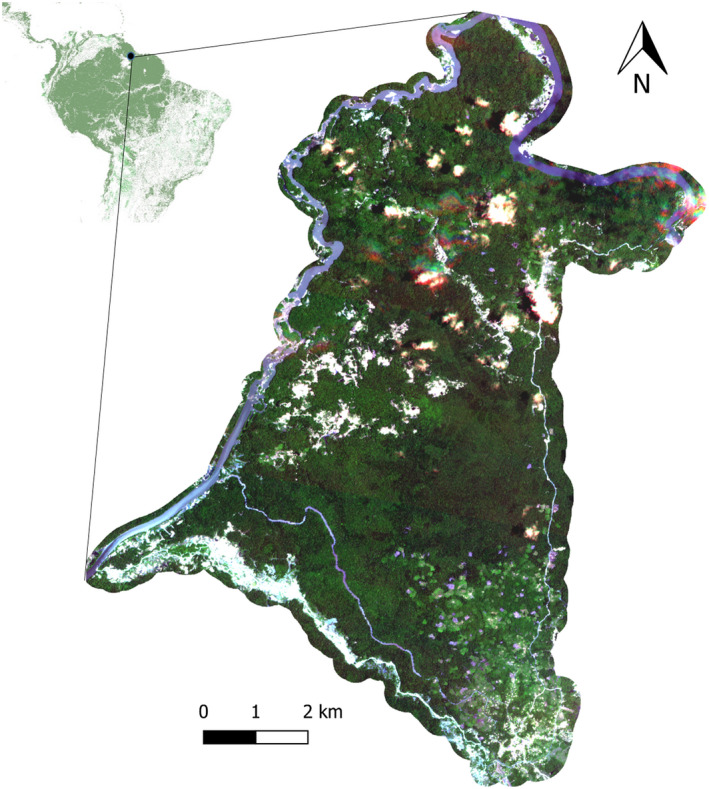
Map of study area. The upper right‐hand map shows the location of the study area within the Guiana Shield. The shaded green color represents forest cover across South America from MDA Systems Ltd. The color image is clipped to the Indigenous territory of Campbelltown in Guyana and represents PlanetScope imagery acquired on 19 September 2019. [Colour figure can be viewed at wileyonlinelibrary.com]
Fieldwork for this study was conducted within the boundaries of the Indigenous community of Campbelltown located north of the mining outpost of Mahdia in Guyana (Latitude: 5°16′00″N, Longitude: 59°09′00″W). Campbelltown historically contained old‐growth forests characteristic of lateritic and quarzitic (white sand) soils found across Guyana. Land cover now includes old‐growth forests, secondary forest regrowth, and cleared forest patches associated with mining, shifting agriculture, and infrastructure (roads and houses). Artisanal gold mining is the primary source of household income but has also led to conflicts within the community and with miners from outside the community (Hilson & Laing, 2017).
Landsat data and field sampling scheme
We developed a stratified sampling scheme for field data collection using the Global Forest Change dataset (Hansen et al., 2013). The Global Forest Change data are a Landsat‐derived remote sensing product that includes annual maps of forest loss at 30 m resolution with a global extent. These data have previously been applied to detect deforestation events in the Guiana Shield region (Roopsind et al., 2019). We extracted the Global Forest Change data for our study site, including the year of forest loss. We then processed the raster data for field sampling by polygonizing adjacent loss pixels from the same year into a single forest loss unit (Fig. 2). Next, we used a stratified sampling scheme to select 165 loss units for field sampling, representing 15 units for each loss year between 2005 and 2015. We deliberately selected a higher number of loss units than would be feasible to sample in the field, as we anticipated that at least some Landsat‐derived loss units would be inaccessible or would represent forest loss from causes other than mining. We then designed field plots centered around Landsat pixels based on each of these loss units. Our field plots included a center plot, with a 15 m radius based on the centroid of a Landsat pixel within the selected loss unit, and four cardinal neighbor plots spaced 30 m apart from the center plot in the four cardinal directions (Fig. 2). This plot design ensured sampling of deforested plots and neighboring plots representing a range of degradation, from nearly intact forest to sites with a long‐term history of mining activity (Fig. 3).
Figure 2.

Land cover classification from PlanetScope imagery. The map on the left shows the location of Landsat‐derived forest loss units (n = 21), which each include five field plots (one center plot and four plots in the cardinal directions) where presence of insect families was surveyed in January 2020. The map panels show the land cover classification in the vicinity of a cluster of field plots, including mine cover. The bottom map panel displays the original PlanetScope imagery used to develop the classification. [Colour figure can be viewed at wileyonlinelibrary.com]
Figure 3.

Landscape context of field plots. These photographs were taken in sampled field plots and illustrate range of mining‐related degradation from severely degraded mining pits (foreground, panel A), to forest regrowth on abandoned mine (panel B), to a fragment of old‐growth forest (background, panel A). Photographs by Trevor Caughlin. [Colour figure can be viewed at wileyonlinelibrary.com]
In the field, we selected a subset of 21 loss units out of the original 165 for field sampling. We adopted a haphazard sampling scheme, selecting a general area and randomly selecting loss units within that area. We discarded loss units where deforestation resulted from activities other than mining (e.g., clearing for shifting agriculture and housing). We ensured that selected loss units represented the full range of loss years, including at least one sampled loss unit from all years between 2005 and 2015, with a maximum of four sampled loss units for loss years 2012 and 2015. We then sampled a field plot centered within each selected loss unit as well as neighbor plots in the four cardinal directions, resulting in five field plots per loss unit (Fig. 2). Altogether, field sampling resulted in 21 center plots and 84 cardinal neighbor plots, for a total of 105 plots.
PlanetScope imagery
We selected a PlanetScope image with multispectral imagers, four spectral channels (blue, green, red, and near‐infrared) and ~3.7 m resolution from 19 September 2019. This image had the least cloud cover out of all available images 3 months prior to field sampling. We interpreted the PlanetScope image in the field while conducting insect surveys, including opportunistic collection of 186 ground control points. During collection of ground control points, we did not observe any major differences between land cover in the image and in the field, suggesting that minimal land cover change occurred during the 3‐month gap between image acquisition and insect surveys.
We georeferenced the PlanetScope image using ground control points, achieving <4 m accuracy with a first‐order polynomial transformation, which provided superior results compared to other transformations. We then prepared the image for an object‐based image analysis (OBIA) using the Large‐Scale Mean‐Shift Algorithm (LSMS) in ORFEO ToolBox, version 7.0, an open‐source software package for image analysis (Inglada & Christophe, 2009). Relative to pixel‐based classification, OBIA often provides superior accuracy, in part due to the ability to include object geometry and texture in classification algorithms (Gao et al., 2009; Hussain et al., 2013; Rittl et al., 2013). The object‐based segmentation process combines spatial scale (hs), range radius (hr), and the minimum segmented size (M), employing four processes: LSMS‐smoothing, LSMS‐segmentation, LSMS‐merging, and LSMS‐vectorization (www.orfeo‐toolbox.org). Based on a visual inspection of segmentation output across 100 different parameter combinations, we selected the following segmentation parameters: hs = 10, hr. = 85, and M = 140. In total, LSMS‐segmentation resulted in 26 861 objects with a mean (± sd) object area of 55 ± 72 m2. We manually removed objects with image distortion, cloud cover, and shadow for a total area of 1160 ha removed from the image (16.74%). We then randomly selected 2769 objects for training data. After initial data exploration, we realized that nonforest objects were scarce, so we randomly subsampled within mined areas for an additional 426 training objects. Based on our ground control points and the goals of our study (to differentiate between mined areas and natural vegetation), we selected five land cover classes (Table 1).
Table 1.
Training dataset of manually identified objects for use in land cover classification.
| Land cover class | Sample size (number of objects) | Description |
|---|---|---|
| Forest | 1195 | Primary rainforest with closed canopy |
| Regrowth | 228 | Vegetation in sites recovering from disturbance, including secondary forest, grass, and herbaceous ground cover |
| Mine | 110 | Active or recently used mining areas |
| Bare ground | 65 | Recently cleared land with no mining activity or vegetation |
| Open water | 51 | Riparian and pond areas |
Land cover classification
We developed our land cover classification using the support vector machine (SVM) algorithm in R version 3.5.3 with the e1071 package (Meyer et al., 2020). Input data for the SVM included spectral information (the four PlanetScope spectral bands and normalized difference vegetation index calculated from Planet Imagery) with the average and standard deviation of pixel‐level values within each object. In addition, we included the following geometric information from each object in the SVM: object area, edge, and edge‐to‐area ratio. After testing various kernels and tuning parameters, we found that a linear kernel with a cost = 1 and gamma parameter = 0.08 provided the best overall accuracy. We assessed the accuracy of our SVM by splitting our land cover data into training and test datasets using 10‐fold cross‐validation. Code and data to run the SVM are publicly available (Caughlin, 2021). To extract data from the land cover classification for use as a predictor variable in analyses of insect biodiversity, we calculated the per cent cover of the mine land cover class within 15 m of each field plot.
Insect collection
Insect samples were collected by a single recorder over 3 weeks, from 7 January 2020 to 30 January 2020, at each of the 105 plots. Using a field tablet with a GPS receiver (Bad Elf GNSS Surveyor BE‐GPS‐3300, accuracy <1 m), we identified the center of each Landsat sample pixel where a circular plot with a radius of 15 m was established, with the procedure repeated for neighboring Landsat pixels (Fig. 2). We used active visual surveys with area counts to detect insect occurrence in field plots. Active visual surveys are most accurate for easily detectable insect groups (e.g., butterflies, dragonflies, and bees) and less reliable for cryptic ground‐dwelling or nocturnal insects (Montgomery et al., 2021). Alternate methods suitable for ground‐dwelling insects (e.g., pitfall trapping) are more labor‐intensive and may require disturbing soil and vegetation (Gist & Crossley, 1973; Ward et al., 2001). Similarly, collection methods that rely on trapping insects, such as malaise traps and pan traps, require additional labor for placement and extensive post‐field efforts to identify and count specimens (Montgomery et al., 2021; Skvarla et al., 2020). An additional advantage of active visual surveys is that this method minimizes the number of specimens that must be killed, as insects can be caught, identified, and released, or, if a specimen must be collected, only one example is required for further identification. For the purposes of our study, active visual surveys enabled rapid sampling of many insect taxa across a large spatial extent.
Insect sampling took place between 8:00 and 16:00 h Insects were collected using aerial nets (for flying insects and insects on terrestrial vegetation), dip nets (for aquatic insects), and direct observation, including evidence of insect activities, such as termite mounds and entrances to underground burrows. For each insect specimen collected, we identified insects to order and family. When possible, we identified specimens to families in the field and released them unharmed at the point of collection. Insects that could not be accurately identified in the field were collected and placed in a freezer to be killed, labeled, and stored in 90% alcohol. These samples were brought back to the Center for the Study of Biological Diversity at the University of Guyana and identified. Insect data are available in Data S1.
Presence or absence of insect families
We coded each insect family represented in the study as present or absent for each plot, generating a binary response variable in our statistical models. To address question (2), whether PlanetScope‐derived mine cover correlates with insect families' presence or absence, we developed generalized linear mixed effect models (GLMMs) in a Bayesian framework. GLMMs are capable of modeling nonnormal response variables in nested sampling units, thus avoiding the need to average or transform data (Bolker et al., 2009; McElreath, 2020). Our binomial models included plot‐level presence or absence of insect families as a response variable and proportion mine cover within a plot as a predictor variable. To account for nonindependence between plots within the same loss units (Fig. 1), we included a random intercept for each of the 21 loss units. To model variability at the insect family level, we accounted for family membership with a random intercept, representing baseline abundance of insect families when mine cover is zero, and a random slope for the effect of mining, representing different responses to mine cover depending on insect family.
To answer question (3), whether PlanetScope‐derived mine cover was correlated with insect taxonomic richness, we summed the presence of insect families for each plot. We then modeled insect family richness using a negative binomial model, with mine cover as a response variable and loss unit as a random intercept. This approach enabled us to use the counts of insect families in each field plot as a response variable while accounting for shared variance between forest loss units.
We fitted our statistical models using the Hamiltonian Monte Carlo algorithm in the Stan programming language (Stan Development Team, 2020). The statistical model was implemented using the rstanarm package in the R programming language (Goodrich et al., 2018). We ran each model with four chains, each with 2000 total iterations, discarding the first 1000 as warm‐up and assessed model diagnostics by visually inspecting output and assessing the Gelman–Rubin statistic and number of divergent transitions (Gelman & Rubin, 1992).
Results
Classification accuracy
Our land cover model achieved an overall out‐of‐sample accuracy of 89.4%. The class with the highest balanced accuracy of 93% was the mine cover class, and the class with the lowest balanced accuracy of 72.4% was the bare ground class, with some bare ground observations misclassified as forest or mined areas (Table 2).
Table 2.
Confusion matrix for land cover classification.
| Observed data | |||||||
|---|---|---|---|---|---|---|---|
| Regrowth | Forest | Mine | Bare ground | Open water | User accuracy (%) | ||
| Classified data | Regrowth | 107 | 23 | 5 | 3 | 1 | 77 |
| Forest | 53 | 875 | 1 | 10 | 0 | 93 | |
| Mine | 3 | 3 | 71 | 11 | 3 | 78 | |
| Bare ground | 1 | 3 | 2 | 21 | 4 | 68 | |
| Open water | 1 | 1 | 2 | 1 | 31 | 86 | |
| Producer accuracy (%) | 64 | 97 | 88 | 46 | 79 | ||
Shaded regions indicate objects that were classified correctly.
Insect family occurrence
There were a total of 1187 observations of insects in this survey. We recorded a total of 10 different insect orders and 69 insect families. The two most dominant and diverse orders were Diptera (20 families) and Hemiptera (16 families), which accounted for 51% of all insect families recorded. The two rarest families were Mantidae (two observations) and Phasmatidae (one observation).
Mine cover had an overall negative effect on the probability of insect family occurrence (Fig. 4). For an average insect family, our model estimates that when comparing a site with zero mine cover to a site with 100% mine cover, the probability of insect family occurrence declines by a median of 2.69% (95% CI: 0–5.6% decline). The effect of mining was highly certain, including a 97.6% probability that mining had a negative effect on community‐level insect family occurrence.
Figure 4.

Negative effect of mine cover on probability of insect family occurrence for the average insect family at an average site. The thick black line shows predicted mean response of an average insect family in an average site to mine cover. The dashed lines represent 95% credibility intervals. [Colour figure can be viewed at wileyonlinelibrary.com]
There were a wide range of detected effects of mining on the probability of family presence (Fig. 5). A total of eight families within four orders (Odonata: Coenagrionidae and Libellulidae; Orthoptera: Acrididae and Tettigoniidae; Diptera: Ceratopogonidae; Hymenoptera: Crabronidae, Formicidae, and Sphecidae) had a median effect of mining >10 times that of an average family, corresponding to an increase in the probability of presence of at least 4.5% in a mined site versus a site with zero mine cover. In contrast, six families were particularly negatively impacted by mine cover, including Culicidae, Limoniidae (Diptera), Vespidae (Hymenoptera), Chrysopidae (Neuroptera), Gryllidae (Orthoptera), and Nymphalidae (Lepidoptera), with a decrease in the probability of family presence for these families of at least 6% in a site with 100% mine cover, relative to a site with zero mine cover. Overall, mine cover had a negative impact on insect family richness (Fig. 6). For an average mined site compared to a site with zero mine cover, mining reduced the number of predicted insect families by 2.21 families (95% CI: −4.23 to 0.11) with a high probability (>97%) that mine cover had a negative impact on insect family richness.
Figure 5.

Range of effects of mining cover on insect family occurrence. Effect size represents posterior draws from the random slope parameters of the binomial generalized linear mixed model. Positive effects indicate species with increased presence in sites with high mine cover. Overlap with zero indicates uncertainty in effect size estimates, while negative effects indicate decreased presence in sites with high mine cover. The 28 families represented are those with 50% CI (credibility intervals) that did not overlap zero. Dots reveal posterior medians for each insect family, while thick gray lines indicate 50% CI and thin lines indicate 95% CI. Different colored dots indicate different insect orders, as shown in the legend. [Colour figure can be viewed at wileyonlinelibrary.com]
Figure 6.

Negative effect of mine cover on insect family richness. Each gray dot represents the observed level of insect family richness at a given site. The thick black line represents mean predicted effect of mine cover on insect family richness, while dashed lines represent 95% CI. [Colour figure can be viewed at wileyonlinelibrary.com]
Discussion
The urgency of the biodiversity extinction crisis demands improved monitoring tools to rapidly assess and respond to environmental threats (Proença et al., 2017). We quantified the impacts of one such threat to insect biodiversity, gold mining, by integrating remotely sensed imagery with field sampling. The multi‐decadal temporal extent of the Landsat satellite archive enabled us to stratify sampling to capture a wide range of land‐use histories, while high‐resolution PlanetScope data enabled us to detect small‐scale artisanal gold mines. Rapid assessments of insect family occurrence at field sites provided a diversity metric with relevance to a wide range of critical ecosystem services. We found that increased mining cover derived from SmallSat imagery was associated with declines in insect taxonomic richness. Our research demonstrates how satellite imagery's ever‐increasing resolution and extent can complement rapid field assessments of biodiversity.
High‐resolution imagery from the PlanetScope platform was essential for detecting environmental degradation at our study site. The ~3.7 m resolution of the imagery enabled us to segment pixels into objects with different shapes and textures and distinguish artisanal mines from spectrally similar land cover types, including bare ground and water. In addition to the relatively high spatial resolution of PlanetScope imagery, the high temporal resolution enabled us to select a relatively cloud‐free image over a tropical rainforest where high cloud cover is a barrier to satellite remote sensing year‐round. While we related insect biodiversity to discrete land cover classes, SmallSat imagery also presents novel opportunities for detecting continuous changes in vegetation, including seasonal variation that could be related to on‐the‐ground metrics of biodiversity (e.g., Curnick et al., in press). Our work adds to a growing body of research that demonstrates the power of OBIA applied to high spatial resolution satellite data, including PlanetScope imagery, for ecological monitoring (Kalacska et al., 2020; Li et al., 2019). An agreement with Norway's International Climate & Forests Initiative has led to public access to PlanetScope imagery across the tropics, further opening up low‐cost opportunities to rapidly monitor environmental degradation (Gewin, 2021),
While high‐accuracy classification is an important goal for land cover mapping, the ultimate test of real‐world utility is whether remote sensing products can predict ecological dynamics. We found that higher OBIA‐derived mine cover resulted in declines in insect family richness. This result parallels other studies on the impact of artisanal gold mining that have shown near‐term impacts of mining on the biodiversity of birds and anurans (Alvarez‐Berríos et al., 2016), diatoms (Tudesque et al., 2012), and stream fishes (Brosse et al., 2011). The addition of insect communities to the list of taxa impacted by gold mining in primary forests is important as the loss of insect diversity has the potential to impact many ecosystem functions, from pollination to decomposition (Barton & Evans, 2017; Cardoso et al., 2020; Winfree et al., 2011). We expect biodiversity loss caused by mining to increase over time as the land area occupied by mines grows, and as many detrimental impacts of gold mines (e.g., accumulation of toxicants) bioaccumulate in the ecosystem. In the context of ever‐growing increases in mine cover, with impacts that cross scales from individual sites to regions (Sonter et al., 2018), the ability to predict biodiversity loss from satellite remote sensing layers will be central to forecasting ecological changes.
Despite an overall decrease in taxonomic richness in sites with higher mining land cover, family‐level impacts were highly variable, including the increased occurrence of some insect families in mined sites. Insect response to mine cover is dependent on taxa‐specific feeding guilds and physical habitat requirements. For example, the family with the greatest increase in the probability of occurrence under mining was Sphecidae, mud‐daubing wasps, which typically prefer open areas with little vegetation and exposed soil which they burrow to nest (Giovanetti, 2005). The occurrence of ants, Formicidae, also responded positively to increased mine cover, likely because many genera of ants prefer disturbed and open sandy areas for nest building sites (Graham et al., 2004). However, overall increases at the family level may mask shifts in relative abundance at finer taxonomic scales (Stoll, 2020). Over the long term, shifts in taxonomic composition generated by mining disturbance may have major ecological consequences as insect communities are foundational to food webs in tropical rainforests (Lister & Garcia, 2018).
Identifying taxonomic groups that exhibit a strong response to gold mining can serve as bioindicators for rapid assessment of habitat degradation and post‐mining recovery trajectories (Tudesque et al., 2012). Out of the eight families with a significant effect, either positive or negative of mining, four of these families belonged to the order Hymenoptera. Studies from other regions have suggested that this group, and ants in particular, is well‐suited as bioindicators for ecosystem recovery after mining (Majer & Nichols, 1998; Ottonetti et al., 2006). Our results affirm the utility of hymenopteran insects as potential bioindicators for ecological change after mining in tropical rainforests.
Rapid biodiversity assessments that pair field surveys with remotely sensed data can generate new hypotheses for future studies. For example, an unexpected finding from our work was that mosquitoes (Diptera: Culicidae) were negatively affected by mine cover. This result was somewhat surprising given that mining disturbance generates aquatic habitats needed for reproduction in mosquito species (Moreno et al., 2007). Conversely, several dragonfly families, including Libellulidae (skimmers) and Coenagrionidae (narrow‐winged damselflies), were among the taxonomic groups with the highest increase in the probability of occurrence with increased mine cover. One hypothesis for decreased mosquito occurrence in mined areas is that mining activity promotes habitat for mosquito predators, including odonate species which benefit from ponds created by mining, potentially enabling these species to control mosquito populations (Saha et al., 2012). An alternate hypothesis is that mosquito adults rely on vegetated microhabitats to rest during the day (Hutchings et al., 2011), and mining disturbance decreases the availability of these resting spots. Disentangling these hypotheses could inform malaria control efforts in human communities near gold mines.
We assessed the presence or absence of insect families with active visual surveys (Montgomery et al., 2021). While this method enabled rapid field measurements over a large area, our taxonomic resolution was limited to the family level and likely biased toward the detection of conspicuous taxa. Some studies have shown that family‐level diversity in invertebrate taxa can be an acceptable proxy for more intensive species‐level identification (Heino, 2010; Rohde et al., 2019). However, we anticipate that finer taxonomic resolution, analogous to higher spatial resolution from satellite imagery, will improve biological insights from rapid assessments. For example, overall abundance within a family can mask considerable variation in how insect species respond to disturbance, with consequences for selecting bioindicator species (Ottonetti et al., 2006). Identifying insects down to generic‐ or species‐level requires specialist skills, particularly in the tropics where insect taxa are understudied, with many unclassified species (Stork, 2018). Emerging DNA‐based species identification methods may present a solution to detect rapid changes in insect communities with lower cost and greater efficiency than manual identification (Beng et al., 2016). In particular, DNA metabarcoding with high‐throughput sequencing enables biodiversity assessment from environmental samples, including high‐capacity analysis of hundreds of thousands of sequences (Fernandes et al., 2019). Developing generalized workflows to pair metabarcoding with satellite remote sensing data, such as PlanetScope imagery, will be a key next step for biodiversity monitoring in the 21st century (Yamasaki et al., 2017).
Conclusion
We have demonstrated that high‐resolution PlanetScope imagery can produce land cover classifications relevant to biodiversity change. Our results emphasize the importance of landscape context for biodiversity of insects, a crucial yet understudied, taxonomic group. Because insects sustain subsequent links in tropical forest food webs, we anticipate wide‐ranging impacts of gold mining on other taxonomic groups. As gold mining continues to encroach into tropical rainforests that harbor the majority of terrestrial species on earth, our approach provides a method to rapidly detect environmental degradation.
Funding information
This research was supported by Conservation International Guyana grant #CI‐6005496. A. R. was supported by NASA Award 80NSSC20K1491.
Supporting information
Data S1. Dataset of insect family presence and absence across field sites.
Acknowledgments
This research was supported by Conservation International Guyana grant #CI‐6005496. The authors express their gratitude to the Toshao and residents of Campbelltown who hosted the field team and assisted in the data collection for the project. They thank the Guyana Environmental Protection Agency and the Ministry of Amerindian Affairs for assistance with local permitting. Rene Edwards and Kerry Anne Cort provided helpful feedback on project design and analysis. They also thank Dr. Ian Robertson for a helpful review of the paper. A. R. was supported by NASA Award 80NSSC20K1491.
Data Availability Statement
Upon acceptance of the paper, field data and the land cover product will be deposited in the Dryad Data Archive. Raw PlanetScope imagery is publicly available via Norway's International Climate & Forests Initiative: https://www.planet.com/nicfi/.
References
- Alpers, C.N. , Yee, J.L. , Ackerman, J.T. , Orlando, J.L. , Slotton, D.G. & Marvin‐DiPasquale, M.C. (2016) Prediction of fish and sediment mercury in streams using landscape variables and historical mining. Science of the Total Environment, 571, 364–379. [DOI] [PubMed] [Google Scholar]
- Alvarez‐Berríos, N. , Campos‐Cerqueira, M. , Hernández‐Serna, A. , Amanda Delgado, C.J. , Román‐Dañobeytia, F. & Aide, T.M. (2016) Impacts of small‐scale gold mining on birds and anurans near the Tambopata Natural Reserve, Peru, assessed using passive acoustic monitoring. Tropical Conservation Science, 9, 832–851. [Google Scholar]
- Asner, G.P. , Llactayo, W. , Tupayachi, R. & Luna, E.R. (2013) Elevated rates of gold mining in the Amazon revealed through high‐resolution monitoring. Proceedings of the National Academy of Sciences of the United States of America, 110, 18454–18459. [DOI] [PMC free article] [PubMed] [Google Scholar]
- Barton, P.S. & Evans, M.J. (2017) Insect biodiversity meets ecosystem function: differential effects of habitat and insects on carrion decomposition. Ecological Entomology, 42, 364–374. [Google Scholar]
- Beng, K.C. , Tomlinson, K.W. , Shen, X.H. , Surget‐Groba, Y. , Hughes, A.C. , Corlett, R.T. et al. (2016) The utility of DNA metabarcoding for studying the response of arthropod diversity and composition to land‐use change in the tropics. Scientific Reports, 6, 24965. [DOI] [PMC free article] [PubMed] [Google Scholar]
- Bolker, B.M. , Brooks, M.E. , Clark, C.J. , Geange, S.W. , Poulsen, J.R. , Stevens, M.H.H. et al. (2009) Generalized linear mixed models: a practical guide for ecology and evolution. Trends in Ecology & Evolution, 24, 127–135. [DOI] [PubMed] [Google Scholar]
- Bovolo, C.I. , Wagner, T. , Parkin, G. , Hein‐Griggs, D. , Pereira, R. & Jones, R. (2018) The Guiana Shield rainforests—overlooked guardians of South American climate. Environmental Research Letters, 13, 074029. [Google Scholar]
- Brosse, S. , Grenouillet, G. , Gevrey, M. , Khazraie, K. & Tudesque, L. (2011) Small‐scale gold mining erodes fish assemblage structure in small neotropical streams. Biodiversity and Conservation, 20, 1013–1026. [Google Scholar]
- Caballero Espejo, J. , Messinger, M. , Román‐Dañobeytia, F. , Ascorra, C. , Fernandez, L.E. & Silman, M. (2018) Deforestation and forest degradation due to gold mining in the Peruvian Amazon: a 34‐year perspective. Remote Sensing, 10, 1903. [Google Scholar]
- Cardoso, P. , Barton, P.S. , Birkhofer, K. , Chichorro, F. , Deacon, C. , Fartmann, T. et al. (2020) Scientists' warning to humanity on insect extinctions. Biological Conservation, 242, 108426. [Google Scholar]
- Caughlin, T.T. (2021) trevorcaughlin/Guyana_landcover: Guyana/v1.0.0. Zenodo. Available from: 10.5281/zenodo.5669042 [DOI]
- Csillik, O. & Asner, G.P. (2020) Near‐real time aboveground carbon emissions in Peru. PLoS One, 15, e0241418. [DOI] [PMC free article] [PubMed] [Google Scholar]
- Csillik, O. , Kumar, P. , Mascaro, J. , O'Shea, T. & Asner, G.P. (2019) Monitoring tropical forest carbon stocks and emissions using Planet satellite data. Scientific Reports, 9, 17831. [DOI] [PMC free article] [PubMed] [Google Scholar]
- Curnick, D.J. , Davies, A.J. , Duncan, C. , Freeman, R. , Jacoby, D.M.P. , Shelley, H.T.E. et al. (in press) SmallSats: a new technological frontier in ecology and conservation? Remote Sensing in Ecology and Conservation. [Google Scholar]
- Dezécache, C. , Faure, E. , Gond, V. , Salles, J.‐M. , Vieilledent, G. & Hérault, B. (2017) Gold‐rush in a forested El Dorado: deforestation leakages and the need for regional cooperation. Environmental Research Letters, 12, 034013. [Google Scholar]
- Elmes, A. , Ipanaqué, J.G.Y. , Rogan, J. , Cuba, N. & Bebbington, A. (2014) Mapping licit and illicit mining activity in the Madre de Dios region of Peru. Remote Sensing Letters, 5, 882–891. [Google Scholar]
- Fernandes, K. , van der Heyde, M. , Coghlan, M. , Wardell‐Johnson, G. , Bunce, M. , Harris, R. et al. (2019) Invertebrate DNA metabarcoding reveals changes in communities across mine site restoration chronosequences. Restoration Ecology, 27, 1177–1186. [Google Scholar]
- Gao, Y. , Kerle, N. & Mas, J.‐F. (2009) Object‐based image analysis for coal fire‐related land cover mapping in coal mining areas. Geocarto International, 24, 25–36. [Google Scholar]
- Gelman, A. & Rubin, D.B. (1992) Inference from iterative simulation using multiple sequences. Statistical Science, 7, 457–472. [Google Scholar]
- Gewin, V. (2021) Help monitor the world's tropical forests. Frontiers in Ecology and the Environment, 19, 144–148. [Google Scholar]
- Giovanetti, M. (2005) Ecologia da nidificação de uma vespa solitária (Hymenoptera: Sphecidae) no Panamá. Neotropical Entomology, 34, 713–719. [Google Scholar]
- Gist, C.S. & Crossley, D.A., Jr. (1973) A method for quantifying pitfall trapping. Environmental Entomology, 2, 951–952. [Google Scholar]
- Goodrich, B. , Gabry, J. , Ali, I. & Brilleman, S. (2018) rstanarm: Bayesian applied regression modeling via Stan. R Package Version 2.21.1. Available from: http://mc‐stan.org/ [Accessed 5 January 2020]. [Google Scholar]
- Graham, J.H. , Hughie, H.H. , Jones, S. , Wrinn, K. , Krzysik, A.J. , Duda, J.J. et al. (2004) Habitat disturbance and the diversity and abundance of ants (Formicidae) in the Southeastern Fall‐Line Sandhills. Journal of Insect Science, 4, 30. [DOI] [PMC free article] [PubMed] [Google Scholar]
- Hammond, D.S. , Gond, V. , de Thoisy, B. , Forget, P.‐M. & DeDijn, B.P.E. (2007) Causes and consequences of a tropical forest gold rush in the Guiana Shield, South America. Ambio, 36, 661–670. [DOI] [PubMed] [Google Scholar]
- Hansen, M.C. , Potapov, P.V. , Moore, R. , Hancher, M. , Turubanova, S.A. , Tyukavina, A. et al. (2013) High‐resolution global maps of 21st‐century forest cover change. Science, 342, 850–853. [DOI] [PubMed] [Google Scholar]
- Heino, J. (2010) Are indicator groups and cross‐taxon congruence useful for predicting biodiversity in aquatic ecosystems? Ecological Indicators, 10, 112–117. [Google Scholar]
- Higgins, P.A.T. (2007) Biodiversity loss under existing land use and climate change: an illustration using northern South America. Global Ecology and Biogeography, 16, 197–204. [Google Scholar]
- Hilson, G. & Laing, T. (2017) Gold mining, indigenous land claims and conflict in Guyana's hinterland. Journal of Rural Studies, 50, 172–187. [Google Scholar]
- Hussain, M. , Chen, D. , Cheng, A. , Wei, H. & Stanley, D. (2013) Change detection from remotely sensed images: from pixel‐based to object‐based approaches. ISPRS Journal of Photogrammetry and Remote Sensing, 80, 91–106. [Google Scholar]
- Hutchings, R.S.G. , Sallum, M.A.M. & Hutchings, R.W. (2011) Mosquito (Diptera: Culicidae) diversity of a forest‐fragment mosaic in the Amazon rain forest. Journal of Medical Entomology, 48, 173–187. [DOI] [PubMed] [Google Scholar]
- Inglada, J. & Christophe, E. (2009) The Orfeo Toolbox remote sensing image processing software. Page IV–733 Geoscience and Remote Sensing Symposium, 2009 IEEE International, IGARSS 2009. IEEE.
- Kalacska, M. , Lucanus, O. , Sousa, L. & Arroyo‐Mora, J.P. (2020) High‐resolution surface water classifications of the Xingu River, Brazil, pre and post operationalization of the Belo Monte Hydropower Complex. Data, 5, 75. [Google Scholar]
- Kalamandeen, M. , Gloor, E. , Johnson, I. , Agard, S. , Katow, M. , Vanbrooke, A. et al. (2020) Limited biomass recovery from gold mining in Amazonian forests. Journal of Applied Ecology, 57, 1730–1740. [Google Scholar]
- Li, J. , Schill, S.R. , Knapp, D.E. & Asner, G.P. (2019) Object‐based mapping of coral reef habitats using Planet Dove satellites. Remote Sensing, 11, 1445. [Google Scholar]
- Lister, B.C. & Garcia, A. (2018) Climate‐driven declines in arthropod abundance restructure a rainforest food web. Proceedings of the National Academy of Sciences of the United States of America, 115, E10397–E10406. [DOI] [PMC free article] [PubMed] [Google Scholar]
- Majer, J.D. & Nichols, O.G. (1998) Long‐term recolonization patterns of ants in Western Australian rehabilitated bauxite mines with reference to their use as indicators of restoration success. Journal of Applied Ecology, 35, 161–182. [Google Scholar]
- Markham, K.E. & Sangermano, F. (2018) Evaluating wildlife vulnerability to mercury pollution from artisanal and small‐scale gold mining in Madre de Dios, Peru. Tropical Conservation Science, 11, 1940082918794320. [Google Scholar]
- McElreath, R. (2020) Statistical rethinking: a Bayesian course with examples in R and STAN. Boca Raton, FL: CRC Press. [Google Scholar]
- Meyer, D. , Dimitriadou, E. , Hornik, K. , Weingessel, A. , Leisch, F. , Chang, C.C. et al. (2020) e1071: Misc functions of the Department of Statistics, Probability Theory Group (Formerly: E1071). TU Wien.
- Montgomery, G.A. , Belitz, M.W. , Guralnick, R.P. & Tingley, M.W. (2021) Standards and best practices for monitoring and benchmarking insects. Frontiers in Ecology and Evolution, 8, 579193. [Google Scholar]
- Moreno, J.E. , Rubio‐Palis, Y. , Páez, E. , Pérez, E. & Sánchez, V. (2007) Abundance, biting behaviour and parous rate of anopheline mosquito species in relation to malaria incidence in gold‐mining areas of southern Venezuela. Medical and Veterinary Entomology, 21, 339–349. [DOI] [PubMed] [Google Scholar]
- Ottonetti, L. , Tucci, L. & Santini, G. (2006) Recolonization patterns of ants in a rehabilitated lignite mine in central Italy: potential for the use of Mediterranean ants as indicators of restoration processes. Restoration Ecology, 14, 60–66. [Google Scholar]
- Proença, V. , Martin, L.J. , Pereira, H.M. , Fernandez, M. , McRae, L. , Belnap, J. et al. (2017) Global biodiversity monitoring: from data sources to essential biodiversity variables. Biological Conservation, 213, 256–263. [Google Scholar]
- Ribas, C.R. , Schmidt, F.A. , Solar, R.R.C. , Campos, R.B.F. , Valentim, C.L. & Schoereder, J.H. (2012) Ants as indicators of the success of rehabilitation efforts in deposits of gold mining tailings. Restoration Ecology, 20, 712–720. [Google Scholar]
- Rittl, T. , Cooper, M. , Heck, R.J. & Ballester, M.V.R. (2013) Object‐based method outperforms per‐pixel method for land cover classification in a protected area of the Brazilian Atlantic Rainforest region. Pedosphere, 23, 290–297. [Google Scholar]
- Rohde, A.T. , Pilliod, D.S. & Novak, S.J. (2019) Insect communities in big sagebrush habitat are altered by wildfire and post‐fire restoration seeding. Insect Conservation and Diversity, 12, 216–230. [Google Scholar]
- Roopsind, A. , Sohngen, B. & Brandt, J. (2019) Evidence that a national REDD+ program reduces tree cover loss and carbon emissions in a high forest cover, low deforestation country. Proceedings of the National Academy of Sciences of the United States of America, 116, 24492–24499. [DOI] [PMC free article] [PubMed] [Google Scholar]
- Saha, N. , Aditya, G. , Banerjee, S. & Saha, G.K. (2012) Predation potential of odonates on mosquito larvae: implications for biological control. Biological Control, 63, 1–8. [Google Scholar]
- Skvarla, M. , Larson, J. , Fisher, R. & Dowling, A. (2020) A review of terrestrial and canopy malaise traps. Annals of the Entomological Society of America, 114, 27–47. [Google Scholar]
- Sonter, L.J. , Ali, S.H. & Watson, J.E.M. (2018) Mining and biodiversity: key issues and research needs in conservation science. Proceedings of the Royal Society B: Biological Sciences, 285, 20181926. [DOI] [PMC free article] [PubMed] [Google Scholar]
- Stan Development Team . (2020) Stan modeling language users guide and reference manual, Version 2.25. Available from: https://mc‐stan.org [Accessed 5 January 2020].
- Stoll, E. (2020) August 14. Insect diversity in mining sites: bioindicators and the effect of mining on insect diversity and abundance. BA Thesis, Georgetown, Guyana, University of Guyana. [Google Scholar]
- Stork, N.E. (2018) How many species of insects and other terrestrial arthropods are there on Earth? Annual Review of Entomology, 63, 31–45. [DOI] [PubMed] [Google Scholar]
- Tudesque, L. , Grenouillet, G. , Gevrey, M. , Khazraie, K. & Brosse, S. (2012) Influence of small‐scale gold mining on French Guiana streams: are diatom assemblages valid disturbance sensors? Ecological Indicators, 14, 100–106. [Google Scholar]
- Vancutsem, C. , Achard, F. , Pekel, J.‐F. , Vieilledent, G. , Carboni, S. , Simonetti, D. et al. (2021) Long‐term (1990–2019) monitoring of forest cover changes in the humid tropics. Science Advances, 7, eabe1603. [DOI] [PMC free article] [PubMed] [Google Scholar]
- Wagner, D.L. , Grames, E.M. , Forister, M.L. , Berenbaum, M.R. & Stopak, D. (2021) Insect decline in the Anthropocene: death by a thousand cuts. Proceedings of the National Academy of Sciences of the United States of America, 118, e2023989118. [DOI] [PMC free article] [PubMed] [Google Scholar]
- Ward, D.F. , New, T.R. & Yen, A.L. (2001) Effects of pitfall trap spacing on the abundance, richness and composition of invertebrate catches. Journal of Insect Conservation, 5, 47–53. [Google Scholar]
- Winfree, R. , Gross, B.J. & Kremen, C. (2011) Valuing pollination services to agriculture. Ecological Economics, 71, 80–88. [Google Scholar]
- Xie, L. , Flippin, J.L. , Deighton, N. , Funk, D.H. , Dickey, D.A. & Buchwalter, D.B. (2009) Mercury(II) bioaccumulation and antioxidant physiology in four aquatic insects. Environmental Science & Technology, 43, 934–940. [DOI] [PubMed] [Google Scholar]
- Yamasaki, E. , Altermatt, F. , Cavender‐Bares, J. , Schuman, M.C. , Zuppinger‐Dingley, D. , Garonna, I. et al. (2017) Genomics meets remote sensing in global change studies: monitoring and predicting phenology, evolution and biodiversity. Current Opinion in Environmental Sustainability, 29, 177–186. [Google Scholar]
Associated Data
This section collects any data citations, data availability statements, or supplementary materials included in this article.
Supplementary Materials
Data S1. Dataset of insect family presence and absence across field sites.
Data Availability Statement
Upon acceptance of the paper, field data and the land cover product will be deposited in the Dryad Data Archive. Raw PlanetScope imagery is publicly available via Norway's International Climate & Forests Initiative: https://www.planet.com/nicfi/.