

Abstract
Several lines of evidence suggest the ligand‐sensing transcription factor Nurr1 as a promising target to treat neurodegenerative diseases. Nurr1 modulators to validate and exploit this therapeutic potential are rare, however. To identify novel Nurr1 agonist chemotypes, we have employed the Nurr1 activator amodiaquine as template for microscale analogue library synthesis. The first set of analogues was based on the 7‐chloroquiolin‐4‐amine core fragment of amodiaquine and revealed superior N‐substituents compared to diethylaminomethylphenol contained in the template. A second library of analogues was subsequently prepared to replace the chloroquinolineamine scaffold. The two sets of analogues enabled a full scaffold hop from amodiaquine to a novel Nurr1 agonist sharing no structural features with the lead but comprising superior potency on Nurr1. Additionally, pharmacophore modeling based on the entire set of active and inactive analogues suggested key features for Nurr1 agonists.
Keywords: nuclear receptor-related 1, NR4A2, transcription factor, neurodegeneration, pharmacophore model
The nuclear receptor Nurr1 is considered a neuroprotective transcription factor and ascribed high therapeutic potential, but Nurr1 activators are rare. Using the Nurr1 agonist amodiaquine as starting point, microscale analogue libraries were synthesized and tested in a cellular setting to identify new Nurr1 ligand scaffolds. Thereby, novel synthetic Nurr1 activators exceeding amodiaquine in potency were obtained.
Introduction
The nuclear receptor‐related 1 (Nurr1, NR4A2) [1] belongs to the nerve growth factor IB‐like receptor [2] (NR4A) subfamily of nuclear receptors which act as ligand‐activated transcription factors. Nurr1 evolves as neuroprotective protein with particularly high levels in neurons [3] suggesting therapeutic promise in neurodegenerative disorders. [4] Polymorphisms in the Nurr1 gene have been associated with an increased risk for Parkinson's Disease (PD),[ 3 , 5 , 6 ] and Nurr1 levels were found to be decreased in the brains of PD and Alzheimer's Disease (AD) patients.[ 7 , 8 ] Therapeutic potential[ 9 , 10 , 11 , 12 ] of Nurr1 in neurodegeneration is also supported by knockout studies[ 3 , 13 ] and rodent models of PD, [14] AD[ 10 , 11 ] and Multiple Sclerosis (MS). [9] Nurr1 deletion in adult dopaminergic neurons in mice resulted in a progressive pathological phenotype resembling the features of early PD with reduced dopaminergic neuron markers, decreased dopamine levels in striatum and motor deficits.[ 3 , 15 ] Conversely, neuronal Nurr1 levels were decreased in the 1‐methyl‐4‐phenyl‐1,2,3,6‐tetrahydropyridine (MPTP) model of PD [14] and in transgenic mouse models of AD.[ 10 , 16 , 17 ] In the experimental autoimmune encephalomyelitis (EAE) model of MS, heterozygous Nurr1 knockout mice revealed an earlier disease onset and increased infiltration of inflammatory cells in the spinal cord. [13] Preliminary evidence hence suggests great potential of Nurr1 as therapeutic target but pharmacological target validation of Nurr1 is pending since potent and selective Nurr1 agonists and inverse agonists to serve as chemical tools are lacking.
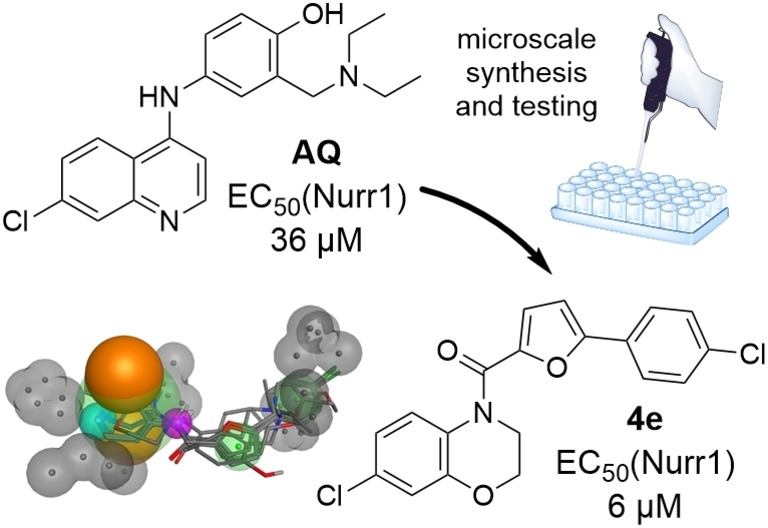
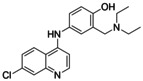
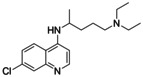
To date, the antimalarials amodiaquine (AQ, 1, Scheme 1) and chloroquine (CQ),[ 18 , 19 ] the dopamine metabolite 5,6‐dihydroxyindole (DHI) [20] and analogues, [21] and natural fatty acid metabolites[ 22 , 23 ] have been shown to modulate Nurr1. In addition, we have recently discovered that the AQ derivative 2 comprising a branched aliphatic chain as N‐substituent on the quinoline scaffold retained Nurr1 agonism despite reduced activation efficacy (AQ (1): EC50 36 μM, 3.6‐fold max. Nurr1 activation; 2: EC50 1.8 μM, 1.47‐fold max. Nurr1 activation). Moreover, fragmentation of the Nurr1 agonist AQ (1) resulted in a fragment‐like Nurr1 activator (3) with weak potency (EC50 259 μM, 2.5‐fold max. Nurr1 activation) but favorable features for structural optimization. [24] Knowledge on the structure activity relationship (SAR) of Nurr1 agonists is scarce, however, and structural data for rational ligand design is lacking. Hence, we chose 3 as starting point for a combinatorial approach to achieve a rapid and broad exploration of the Nurr1 agonist SAR and to obtain new Nurr1 agonist scaffolds. The free amino group of 3 appeared well suitable for derivatization to amides and amines in a miniature format in a first set of analogues. The new structural features of the most active compound in this first library subsequently served as starting point for the next compound generation. Thereby, we rapidly explored the SAR of AQ derived Nurr1 ligands and achieved a scaffold hop, which refers to the search for compounds with similar bioactivity but different (core) structure compared to a template.[ 25 , 26 ] The most active descendants 3 j and 4 e of this strategy exceeded the lead AQ and the fragment 3 in potency and modulated Nurr1 activity in cellular and cell‐free settings.
Scheme 1.

Nurr1 agonists.
Results and Discussion
With the intention to expand the very scarce collection of Nurr1 ligands, we engaged on AQ and its fragment 3 as a starting point for structural variation aiming to obtain new Nurr1 ligand scaffolds by rapid diversification of the AQ chemotype. Our previous approach to a systematic SAR elucidation of AQ has yielded strongly optimized chloroquinolinamines (2, 3) as Nurr1 activators [24] but systematic extension of these fragment structures was not productive. Hence, we chose a different approach for a rapid and broad elucidation of the Nurr1 agonist SAR. With AQ as starting point, we generated a small analogue library in an economic microscale format keeping 3 as fixed structural feature. The most active compound in this first set was then used as starting molecule for a second analogue library in which the structural feature 3 was broadly varied. In both rounds, the libraries were first tested in vitro after a minimal workup for potential Nurr1 activation before the most active constituent was synthesized in batch and purified for full characterization. The general workflow is visualized in Figure 1.
Figure 1.
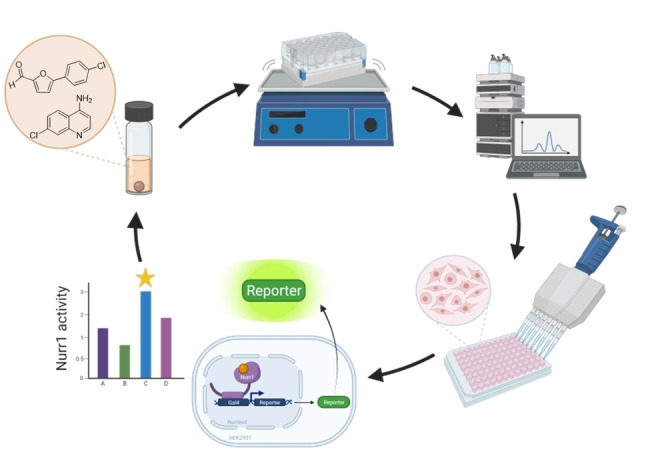
Schematic workflow of analogue library synthesis and in vitro testing. Created with BioRender.com.
Microscale library design and synthesis. The starting molecule 3 comprising a free amino group appeared suitable to prepare a library of analogues by reductive amination with aldehydes and ketones (Scheme 2a). These were selected from our in‐house building block library after filtering for compounds comprising only one carbonyl group and no primary/secondary amine, carboxylic acid, carbonyl chloride, sulfonyl chloride, ester, aromatic alcohol, alkyl halide, carbamate or boronic acid to prevent side reactions. In addition, to restrict the size of the products to a comparable range as the Nurr1 agonists AQ and CQ, we only retained building blocks with a molecular weight of 120–250 g/mol resulting in 151 candidate carbonyls. From this set, seven building blocks comprising a tertiary amine as it is contained in AQ and CQ were rationally chosen. Another seven were computationally selected for maximum structural diversity based on the extended connectivity fingerprints (ECFP, [27] radius=2) of the virtually generated products using a diversity picker and CQ as seed molecule. To establish conditions for the synthesis of library A, we performed test reductive amination reactions with 3 and benzaldehyde or 3‐methylbutan‐2‐one at low volume (160 μL) and varied solvent (CH2Cl2, THF), equivalents of the carbonyl (1.0–1.5 eq), equivalents of reducing agent NaBH(OAc)3 [28] (3.0–6.0 eq), reaction time (4–24 h), and reaction vessel (Eppendorf tube, HPLC glass vial). The reactions were mixed by shaking, molecular sieves were added to remove water, acetic acid served as catalyst. At the end of the reaction, the solvent was removed at 50 °C, NaOH solution was added, and the mixtures were extracted twice with ethyl acetate in the HPLC vial. The organic layers were transferred to a new vial. Product formation and reaction selectivity were assessed semi‐quantitatively by TLC‐MS. Based on this rough exploration of reaction conditions, 24 h reaction time with methylene chloride as solvent in HPLC glass vials evolved as suitable conditions for both the aliphatic and the aromatic carbonyl reagent. These conditions were employed for the preparation of library A. After the minimal workup, the yield of all products was roughly determined by chromatography to adjust the concentrations for biological testing to approx. 30 μM. The library was then dried at room temperature and redissolved in DMSO for in vitro characterization.
Scheme 2.

Preparation of microscale analogue libraries. Reagents & Conditions: (a) NaBH(OAc)3, HOAc, CH2Cl2, r.t., 24 h; (b) 4‐DMAP, CH2Cl2, r.t., 24 h.
Library B was based on the 5‐(4‐chlorophenyl)furan‐2‐yl substituent which was discovered in library A as preferred motif. This novel structural feature of Nurr1 agonists was hence kept constant in library B while the quinoline fragment (3) was varied. The second library was prepared using 5‐(4‐chlorophenyl)furan‐2‐carbonyl chloride (7 a) and selected amine building blocks from our in‐house library for amide coupling (Scheme 2b). After filtering our collection of amines to contain no carboxylic acid, carbonyl chloride, sulfonyl chloride, ester, aromatic alcohol, alkyl halide, carbamate or boronic acid and applying a molecular weight range of 100–270 g/mol, 113 suitable amines were retained. From these building blocks, six were rationally selected for similarity to the former 4‐amino‐7‐chloroquinoline (3), seven were computationally selected for maximum fingerprint (ECFP4) similarity of the virtually generated products to the hit compound 4 from library A, and eight were computationally selected for maximum structural diversity based on the ECFP4 of the virtually generated products using a diversity picker and 4 as seed molecule. Before library synthesis, amide coupling test reactions were performed with 5‐(4‐chlorophenyl)furan‐2‐carbonyl chloride (7 a) and pyridin‐3‐amine (as aromatic amine example) or pyridin‐3‐ylmethanamine (as aliphatic amine example) with varying solvent (CH2Cl2, THF), base and reaction time (4–24 h). Workup and monitoring were performed as described for library A. Using the most favorable conditions from the test reactions, library B was prepared in methylene chloride with 4‐DMAP as base and 24 h reaction time, and after minimal workup tested in vitro at approx. 3 μM.
Batch synthesis. The most active compounds from the library screenings 3 j and 4 e, and their respective amine or amide counterparts 4 and 5 were prepared in batch according to Scheme 3. The amides 4 and 4 e were obtained by amide coupling of the amines 3 and 6 with 5‐(4‐chlorophenyl)furan‐2‐carboxylic acid (7). The secondary amine 3 j was synthesized by reduction of 4 with LiAlH4. For the preparation of 5, 5‐(4‐chlorophenyl)furan‐2‐carbaldehyde (8) was reduced to its corresponding alcohol with LiAlH4 which was then activated with methanesulfonyl chloride and treated with the amine 6 to obtain 5.
Scheme 3.

Batch synthesis of Nurr1 agonists 3 j, 4, 4 e and 5. Reagents & Conditions: (a) EDC⋅HCl, 4‐DMAP, CHCl3/DMF, reflux, 24 h, 65–86 %; (b) LiAlH4, THF, 0 °C–r.t., 24 h, 32 %; (c) i) LiAlH4, THF, 0 °C, 5 min.; ii) MsCl, CH2Cl2/TEA, r.t., 1 h; iii) 6, toluene, reflux, 48 h, 11 %.
Biological characterization. A hybrid Gal4‐Nurr1 reporter gene assay[ 24 , 29 ] in transiently transfected HEK293T cells was used for primary characterization of Nurr1 modulation. It was based on a chimeric receptor composed of the human Nurr1 ligand binding domain (LBD) fused to the Gal4 DNA binding domain from yeast. [30] A firefly luciferase reporter construct with Gal4 response element served as reporter gene and constitutively expressed Renilla luciferase was employed to monitor transfection efficiency and test compound toxicity. The crude libraries were tested in a single concentration in three biologically independent experiments. Concentrations were roughly adjusted based on semi‐quantitative yield estimation by TLC‐UV (library A) or HPLC‐UV (library B). The test concentrations of the libraries (∼30 μM for library A, ∼3 μM for library B) were set according to the potencies of their respective template compounds AQ (EC50 36 μM) for library A and 4 (EC50 3 μM) for library B to promote the discovery of novel Nurr1 agonists with similar or higher potency compared to the respective templates. Selected actives were then prepared in batch, isolated, and characterized in full dose‐response curves.
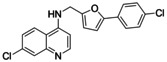
Nurr1 ligand structure activity relationship. Starting from the known Nurr1 agonist chemotype of AQ and CQ, we employed their common substructure 3 as initial building block for analogue development and generated a library (library A, Figure 2) of 14 secondary amine analogues (3 a–3 n) of AQ/CQ sharing 3 as common motif. The library design followed a balanced strategy to contain compounds with structural similarity to AQ/CQ and structurally diverse analogues. Three analogues in this set (3 i, 3 j, 3 k) caused more than 1.5‐fold Nurr1 activation while no potential inverse agonist blocking Nurr1 activity was detected. With 2.47‐fold Nurr1 activation, the 5‐(4‐chlorophenyl)furan‐2‐ylmethylamine 3 j exhibited the strongest effect on Nurr1 activity in library A and was selected for batch synthesis. Full dose‐response characterization of 3 j confirmed Nurr1 agonism with an EC50 value of 8±1 μM (Table 1). In a cell‐free time‐resolved fluorescence resonance energy transfer (HTRF) assay, 3 j (5 μM, 10 μM) diminished dimerization of the Tb3+‐cryptate‐labeled Nurr1 LBD and the GFP‐labeled Nurr1 LBD (Figure 2c). Similar effects on Nurr1 homodimerization were observed with Nurr1 agonistic statins [31] thus confirming direct Nurr1 modulation by 3 j. In the Gal4‐Nurr1 reporter gene assay, 3 j already exceeded the potency of AQ (EC50 36 μM) and chloroquine (CQ, EC50 47 μM) highlighting the 5‐(4‐chlorophenyl)furan‐2‐ylmethylamine substituent as attractive novel Nurr1 ligand moiety. The corresponding amide 4 of 3 j (which was prepared as intermediate in the synthesis of 3 j) was even slightly more active with an EC50 value of 3.0±0.1 μM (Table 1) suggesting preference for rigidity.
Figure 2.

Library A: (a) Chemical structures of library A compounds and (b) single point screening data of crude library A at ∼30 μM. Data are the mean±SD, n=3. (c) Library product 3 j (purified compound) diminished Nurr1 homodimerization in an HTRF assay. Data are the mean±SD, N=3.
Table 1.
Nurr1 agonism of the purified compounds 3 j, 4, 4 e, and 5. AQ (1), [29] CQ, [29] 2 [24] and lead fragment 3 [24] for comparison. Fold activation refers to the maximum Nurr1 activation vs. DMSO (0.1 %). Data are the mean±S.E.M., n≥3.
|
ID |
structure |
EC50(Nurr1) (fold act.) |
|---|---|---|
|
AQ |
|
36±4 μM (3.6±0.1‐fold) |
|
CQ |
|
47±5 μM (2.0±0.1‐fold) |
|
2 |
|
1.8±0.3 μM (1.47±0.03‐fold) |
|
3 |
|
259±70 μM (2.5±0.4‐fold) |
|
3 j |
|
8±1 μM (2.5±0.1‐fold) |
|
4 |
|
3.0±0.1 μM (2.0±0.1‐fold) |
|
4 e |
|
6±2 μM (1.40±0.05‐fold) |
|
5 |
|
47±13 μM (2.0±0.2‐fold) |


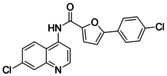
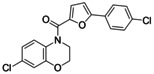
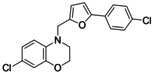
Encouraged by the rapid discovery of 3 j and 4 as new Nurr1 agonists with a scaffold already differing markedly from AQ/CQ, we used the amide 4 as the seed molecule for library B (Figure 3) to vary the other half of the molecule and replace the chloroquinoline motif. Therein, we again maintained a balance between structurally related motifs and structural diversity to obtain 21 5‐(4‐chlorophenyl)furan‐2‐ylcarbamide derivatives (4 a–4 u) in library B. Three compounds of library B achieved >1.5‐fold Nurr1 activation among which 4 e (1.74‐fold act.) and 4 i (1.77‐fold act.) were equally active in this first screen. Again, no compound caused relevant Nurr1 repression in the primary screening. Full characterization of the purified compounds 4 e and 4 i after batch synthesis only confirmed Nurr1 agonism for the dihydrobenzoxazine 4 e with an EC50 value of 6±2 μM (Table 1). To obtain further insights into the importance of the methylamine vs amide linker, we also prepared the secondary amine analogue 5 of 4 e which confirmed the preference for amides as the amine 5 was less active than the amide 4 e.
Figure 3.
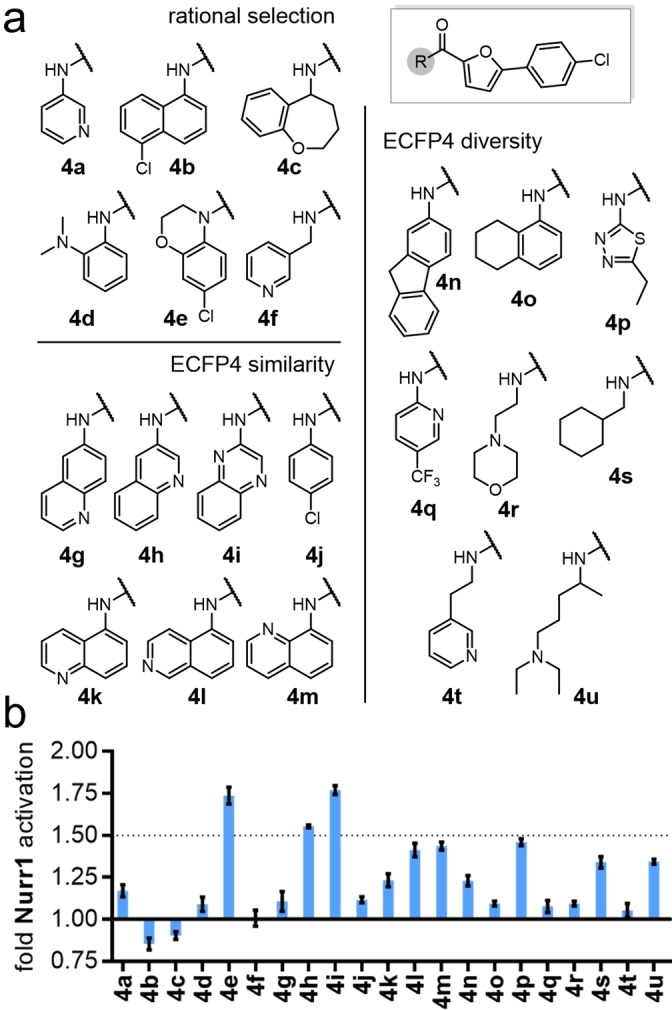
Library B: (a) Chemical structures of library B compounds and (b) single point screening data of crude library B at ∼3 μM. Data are the mean±SD, n=3.
Only two small libraries of AQ/CQ analogues enabled scaffold hopping from the known AQ chemotype of Nurr1 agonists over the library A hit 3 j to the entirely new Nurr1 agonist scaffold 4 e which shares no structural feature with the starting point AQ. Computational similarity evaluation of 4 e with the starting molecules AQ and CQ confirmed low (<0.15; Table 2) Tanimoto similarity calculated on Morgan [32] Fingerprints and ECFP4. Both compounds 3 j and 4 e exceeded AQ and CQ in potency on Nurr1 and hence present as attractive starting points for systematic optimization. Further in vitro characterization of the new Nurr1 agonist chemotype 4 e additionally revealed activation of human full‐length Nurr1 in reporter gene assays for the human Nurr1 response elements NBRE, NurRE and DR5 (Figure 4a), and the HTRF assay confirmed direct Nurr1 modulation by 4 e (Figure 4b) as observed by decreased dimerization despite a weak non‐specific baseline shift. The fact that 4 e activated the Nurr1 homodimer (NurRE) although the HTRF assay showed decreased Nurr1 dimerization in presence of 4 e indicates, however, that also other molecular mechanisms than dimerization involve in the Nurr1 agonism of 4 e as it has been observed for other Nurr1 ligands.[ 24 , 31 , 33 ] Further studies will be needed to elucidate the co‐regulatory network and molecular mechanisms driving Nurr1 activation by ligands entirely.
Table 2.
Structural similarity of 4 e and the starting molecules AQ and CQ in terms of Tanimoto similarities calculated on Morgan Fingerprints (a) and ECFP4 (b).
|
|
4 e |
AQ |
CQ |
|---|---|---|---|
|
4 e |
– |
a: 0.14; b: 0.14 |
a: 0.13; b: 0.14 |
|
AQ |
a: 0.14; b: 0.14 |
– |
a: 0.53; b: 0.52 |
|
CQ |
a: 0.13; b: 0.14 |
a: 0.53; b: 0.52 |
– |
Figure 4.
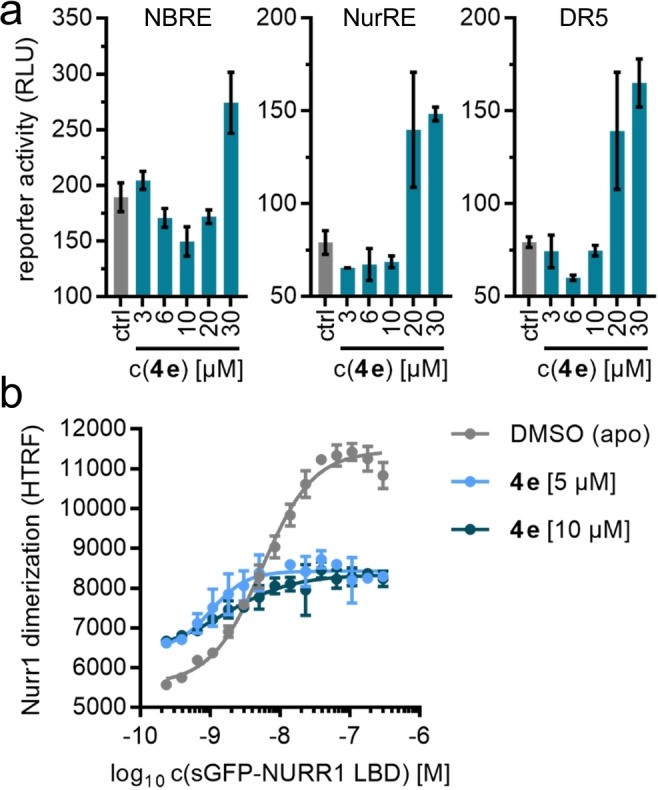
In vitro profiling of Nurr1 agonist 4 e. (a) 4 e activated full‐length Nurr1 in reporter gene assays for the human Nurr1 response elements NBRE (Nurr1 monomer), NurRE (Nurr1 homodimer) and DR5 (Nurr1:RXR heterodimer). Nurr1 and RXR (for DR5) were overexpressed. Data are the mean±SD, n=3. (b) 4 e diminished Nurr1 homodimerization in an HTRF assay. Data are the mean±SD, N=3.
Pharmacophore modeling. Our microscale synthesis approach of AQ/CQ analogues as Nurr1 activators followed the hypothesis of a common binding site and the structure‐activity dataset of all actives and inactives thus held potential to reveal relevant patterns of Nurr1 activators. In an attempt to extract common structural features, we generated a pharmacophore model from AQ and the analogues 3 a‐3 n, 4, 4 a–4 u and 5 (Figure 5, model available as SI file). To classify compounds as active or inactive, we used a threshold of 1.5‐fold activation in the screening leaving a set of eight actives (AQ, 3 i, 3 j, 4, 4 e, 4 h, 4 i, 5) and thirty inactives. The obtained model defined one H‐bond acceptor (quinoline nitrogen of AQ) and one H‐bond donor feature (diarylamine of AQ) as well as two aromatic centers and one hydrophobic region. Interestingly, the aliphatic amine in the side chain of AQ was not identified as a relevant feature in this set. The model also contained various excluded volumes around the large aromatic region (quinoline of AQ) and the lipophilic extension (trialkylamine of AQ) indicating geometry as an essential factor in this series of Nurr1 ligands. Despite their considerable structural diversity in terms of fingerprints, all compounds considered active (>1.5‐fold activation) except 4 e complied with the pharmacophore model suggesting the contained features as important for Nurr1 activation. 4 e was not recognized for lacking the central H‐bond donor. In addition, twelve compounds (3 a, 3 b, 3 d, 3 e, 3 f, 3 g, 3 h, 3 n, 4 a, 4 g, 4 k, 4 p) not passing the activity threshold of 1.5‐fold Nurr1 activation matched the model. Several of these putative false positives exhibited weak Nurr1 agonism (≥1.25‐fold activation; 3 a, 3 b, 3 d, 4 p) in the screenings, however, suggesting them as potential further actives. Considering also this aspect, the model provided favorable accuracy especially regarding the identification of true actives. It provides useful insights into structural requirements of Nurr1 agonists and can serve for pharmacophore‐based virtual screening.
Figure 5.
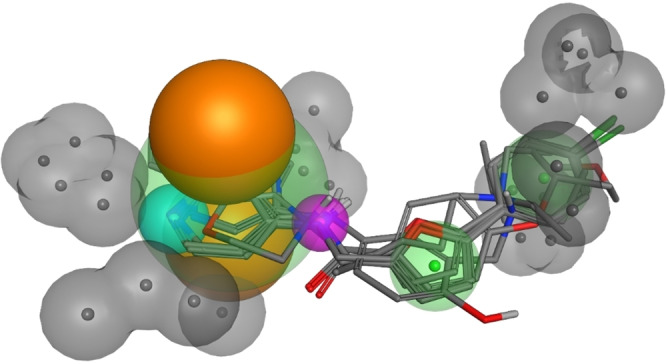
Pharmacophore model derived from Nurr1 activator AQ and analogues 3 a–3 n, 4, 4 a–4 u and 5. Pharmacophore features are color‐coded with hydrophobic/aromatic features in green, excluded volume in grey, H‐bond acceptors in cyan, H‐bond donors in purple, and the centroid projection along the π‐system plane normal in orange.
Conclusion
As a neuroprotective transcription factor, Nurr1 is evolving as an attractive target for potential treatment of neurodegenerative diseases. [4] However, the limited availability of Nurr1 activators as tools for target validation and as leads for medicinal chemistry presents an obstacle to further evaluation and exploitation of Nurr1 for therapeutic purposes. So far, no validated potent Nurr1 agonist has been discovered which may in part be due to the lack of suitable Nurr1 ligand chemotypes for structural optimization. In order to obtain new Nurr1 agonist scaffolds for medicinal chemistry, we have employed the well‐characterized but weak Nurr1 agonist AQ[ 18 , 19 ] as lead. Our approach of microscale analogue synthesis with direct in vitro characterization and subsequent batch synthesis and validation of hits turned out to be a rapid, economic, and successful strategy to achieve a scaffold hop from AQ to new Nurr1 agonists. Two small analogue libraries were sufficient to obtain 4 e as a Nurr1 activator sharing no common structural elements with the template AQ. Despite very low fingerprint‐based similarity of 4 e to AQ (Tanimoto Similarity <0.15; Table 2), however, computer‐aided pharmacophore elucidation suggested a common pharmacophore of the active compounds in this study. This model also indicated important pharmacophore features of Nurr1 agonists and may enable virtual screening for further chemotypes of Nurr1 ligands. 4 e provides a new scaffold for structural optimization to potent and selective Nurr1 agonists with rapid synthetic accessibility. In addition, our results validate and encourage microscale synthesis in plate format for early SAR elucidation and scaffold hopping in medicinal chemistry.
Experimental Section
Chemistry
General. All used chemicals were purchased from commercial sources and used without further purification. Batch reactions were carried out under argon atmosphere in oven‐dried glassware and in absolute solvents purchased from Sigma Aldrich. Solvents used for compound purification by column chromatography (methylene chloride, n‐hexane and ethyl acetate) were of technical grade and used without further purification. The deuterated solvents DMSO‐d6 and acetone‐d6 used for NMR spectroscopy were purchased and used without further drying. Thin‐layer chromatography (TLC) was performed on silica (particle size of 60 μm) coated aluminum plates with 254 nm fluorescence indicator from Macherey‐Nagel. Purification by column chromatography was carried out using silica gel from Sigma Aldrich. NMR spectra were recorded on Bruker AV300, AV400 and AV500 spectrometers (Bruker Corporation, Billerica, MA, USA). Chemical shift values (δ) are reported in ppm and coupling constants (J) are shown in Hertz (Hz). Signal multiplicities are abbreviated as s for singlet, d for duplet, t for triplet, q for quartet, and m for multiplet. High‐resolution mass (HRMS) spectra were obtained on a LTQ Orbitrap XL device (Thermo Fisher Scientific). Purity of all final products was analyzed by HPLC on a Varian ProStar HPLC from SpectraLab Scientific Inc. equipped with a MultiHigh 100 Phenyl‐5μ, 240+4 mm column at a flow rate of 1 mL per minute and UV‐detection (254 nm and 280 nm). Compounds from batch synthesis had ≥95 % purity (AUC at 254 nm and 280 nm).
Microscale synthesis of library A. Preparations. 4‐Amino‐7‐chloroquinoline (3, 142 mg, 0.795 mmol) was dissolved in methylene chloride/glacial acetic acid (1.325 mL, 4 : 1) to obtain a 0.6 M master solution of the starting fragment 3. Aldehydes and ketones were dissolved in methylene chloride to obtain 1.5 M solutions. NaBH(OAc)3 (1.41 g, 6.65 mmol) was dissolved in methylene chloride/glacial acetic acid (2.96 mL, 4 : 1) to obtain a 2.25 M solution of the reducing agent. Library Synthesis. One molecular sieves sphere was added to each HPLC reaction vial (amber glass, 40×8.2 mm, 1 mL flat bottom tubes). 50 μL (30 μmol, 1.00 eq) of the solution of 3 were dispensed into all reaction tubes. 30 μL (45 μmol, 1.50 eq) of the respective aldehyde or ketone solutions were added each to one tube. And last, 80 μL (180 μmol, 6.00 eq) of the NaBH(OAc)3 solution were added to all tubes. The tubes were sealed with PE‐plugs, (fixed with parafilm), placed into an empty pipette tip box, and the box was placed on a shaker platform and gently shaken for 24 h at room temperature. The tubes were then opened and placed into a drying oven at 50 °C to evaporate the solvent. 400 μL of aqueous NaOH (1 M) solution was added to each tube and shaken for 15 min. The mixture was extracted with EtOAc (2×400 μL). 600 μL (2×300 μL) of the combined organic layer were separated, and the solvent was evaporated to obtain the dry crude products. Analytical characterization. All reactions were analyzed by thin‐layer chromatography (methylene chloride/ethanol/TEA 95 : 5 : 10) with normalized glass capillaries. 5 mM and 0.5 mM solutions of 3 in EtOAc were used as external references. A picture was taken from the TLC under UV254 fluorescence illumination and quenching of the spots was analyzed densitometrically with ImageJ (version 1.52a) to estimate reaction yields. All TLC spots were analyzed by TLC‐MS. Approx. 100 mM (adjusted for the desired product) DMSO stock solutions for in vitro testing were prepared based on the estimated reaction yields of the product spot from TLC analysis.
Microscale synthesis of library B. Preparations. 5‐(4‐Chlorophenyl)furan‐2‐carboxylic acid (7, 1.40 g, 6.28 mmol, 1.00 eq) was dissolved in methylene chloride (30 mL). Thionyl chloride (3.69 g, 31.4 mmol, 5.00 eq) and a catalytic amount of DMF were added at room temperature, and the reaction mixture was stirred under reflux for 5 h. After cooling to room temperature, the solvents were evaporated under reduced pressure, and the crude product was reconstituted in methylene chloride to obtain a 1.0 M solution of the starting fragment 5‐(4‐chlorophenyl)furan‐2‐carbonyl chloride (7 a). Primary and secondary amines were dissolved separately in methylene chloride to obtain 0.5 M solutions. 4‐DMAP (514 mg, 4.21 mmol) was dissolved in methylene chloride (2.10 mL) to obtain a 2.0 M solution of the catalyst. Library synthesis. One molecular sieves sphere was added to each HPLC reaction vial (amber glass, 40×8.2 mm, 1 mL flat bottom tubes). 120 μL (120 μmol, 1.50 eq) of the acid chloride solution were dispensed to all reaction tubes. 160 μL (80 μmol, 1.00 eq) of the respective amine solutions were added each to one tube. 68 μL (136 μmol, 1.70 eq) of the 4‐DMAP solution were added to all tubes. The tubes were sealed with PE‐plugs, (fixed with parafilm), placed into an empty pipette tip box, and the box was placed on a shaker platform and gently shaken for 24 h at room temperature. The tubes were opened and placed into a drying oven at 50 °C to evaporate the solvent. 400 μL of aqueous NaOH (1 M) solution was added to each tube and shaken for 15 min. The mixture was extracted with ethyl acetate (2×400 μL). 600 μL (2×300 μL) of the combined organic layer were separated and washed with aqueous acetic acid (1 M, 600 μL). 400 μL of the organic layer were separated and the solvent was evaporated to obtain the dry crude products. Analytical characterization. Reactions were analyzed by UV‐HPLC at 254 and 275 nm. An amount of the organic layer corresponding to 100 μg of product at complete conversion was dissolved in methanol/water (1 mL, 50 : 50). Solutions of 5‐(4‐chlorophenyl)furan‐2‐carboxylic acid (7; 10, 20, and 50 μg/mL) were used for external calibration. 100 mM (adjusted for the desired product) DMSO stock solutions for in vitro testing were prepared based on the mean AUC (%) at both wavelengths for the product peak.
7‐Chloro‐N‐((5‐(4‐chlorophenyl)furan‐2‐yl)methyl)quinolin‐4‐amine (3 j). 4 (100 mg, 0.26 mmol, 1.00 eq) was dissolved in THF (5 mL) at 0 °C and a solution of LiAlH4 (1 M, 0.52 mmol, 0.52 mL, 2.00 eq) was slowly added. The mixture was allowed to warm to room temperature and stirred for 24 h. The mixture was slowly diluted with water (10 mL) and then washed with ethyl acetate (3×30 mL). The combined organic layers were dried over Na2SO4 and concentrated. The crude product was purified by column chromatography (ethyl acetate/hexane 1 : 1+0.5 % TEA) to obtain the title compound as a yellow solid (31 mg, 32 %). 1H NMR (500 MHz, DMSO‐d 6) δ=8.43 (d, J=5.4 Hz, 1H), 8.30 (d, J=9.0 Hz, 1H), 7.94–7.89 (m, 1H), 7.80 (d, J=2.2 Hz, 1H), 7.68–7.64 (m, 2H), 7.49–7.44 (m, 3H), 6.93 (d, J=3.3 Hz, 1H), 6.67 (d, J=5.5 Hz, 1H), 6.52 (d, J=3.3 Hz, 1H), 4.59 (d, J=5.6 Hz, 2H). 13C NMR (126 MHz, DMSO‐d 6) δ=152.07, 151.83, 151.26, 149.73, 149.04, 133.46, 131.64, 129.09, 128.92, 127.56, 124.87, 124.36, 124.05, 117.50, 110.12, 107.34, 99.42, 39.90. HRMS (MALDI): m/z calculated 369.05560 for C20H15Cl2N2O, found 369.05602 ([M+H]+).
7‐Chloro‐2,3‐dihydro‐4H‐benzo[b][1,4]oxazin‐4‐yl)(5‐(4‐chlorophenyl)furan‐2‐carboxamide (4 e). 7‐Chloro‐3,4‐dihydro‐2H‐benzo[b][1,4]oxazine (6, 84.8 mg, 0.50 mmol, 1.00 eq), 5‐(4‐chlorophenyl)furan‐2‐carboxylic acid (7, 133 mg, 0.60 mmol, 1.20 eq) and 4‐DMAP (183 mg, 1.50 mmol, 3.00 eq) were dissolved in a mixture of chloroform (10 mL) and DMF (5 mL). EDC⋅HCl (192 mg, 1.0 mmol, 2.0 eq) was added and the mixture was stirred under reflux for 24 h. After cooling to room temperature, the mixture was diluted with ethyl acetate (30 mL) and washed with water (3×30 mL). The organic layer was dried over Na2SO4 and concentrated. The crude product was purified by column chromatography (ethyl acetate/hexane 1 : 5) to obtain the title compound as a colorless solid (121 mg, 65 %). 1H‐NMR (500 MHz, acetone‐d6 ): δ=7.75–7.70 (m, 2H), 7.50 (d, J=8.8 Hz, 1H), 7.49–7.45 (m, 2H), 7.21 (d, J=3.7 Hz, 1H), 7.08 (d, J=3.6 Hz, 1H), 6.97 (d, J=2.4 Hz, 1H), 6.85 (dd, J=8.9, 2.4 Hz, 1H), 4.45–4.41 (m, 2H), 4.25–4.21 (m, 2H). 13C‐NMR (126 MHz, acetone‐d6 ): δ=158.62, 155.43, 148.17, 147.65, 134.83, 130.24, 129.97, 129.36, 126.87, 125.96, 125.75, 120.66, 120.51, 117.70, 108.59, 67.15, 44.12. HRMS (MADLI): m/z calculated 374.03453 for C19H14Cl2NO3, found 374.03473 ([M+H]+).
5‐(4‐Chlorophenyl)‐N‐(7‐chloroquinolin‐4‐yl)furan‐2‐carboxamide (4). 4‐Amino‐7‐chloroquinoline (3, 89 mg, 0.5 mmol, 1.0 eq), 5‐(4‐chlorophenyl)furan‐2‐carboxylic acid (7, 134 mg, 0.6 mmol, 1.2 eq) and 4‐DMAP (183 mg, 1.5 mmol, 3.0 eq) were dissolved in a mixture of chloroform (10 mL) and DMF (5 mL). EDC⋅HCl (192 mg, 1.0 mmol, 2.0 eq) was added and the mixture was stirred under reflux for 20 h. Due to incomplete conversion of 3 according to TLC, further 5‐(4‐chlorophenyl)furan‐2‐carboxylic acid (7, 134 mg, 0.6 mmol, 1.2 eq) and EDC⋅HCl (192 mg, 1.0 mmol, 2.0 eq) were added and the solution was stirred under reflux for another 4 h. After cooling to room temperature, water (30 mL) was added, and the mixture was extracted with ethyl acetate (3×15 mL). The combined organic layers were dried over Na2SO4, and concentrated. The crude product was purified by column chromatography (ethyl acetate/hexane 1 : 2) to obtain the title compound as a pale yellow solid (164 mg, 86 %). 1H NMR (500 MHz, DMSO‐d6 ) δ=10.75 (s, 1H), 8.94 (d, J=4.9 Hz, 1H), 8.25 (d, J=9.0 Hz, 1H), 8.11 (d, J=1.9 Hz, 1H), 8.05 (d, J=8.6 Hz, 2H), 7.89 (d, J=4.9 Hz, 1H), 7.70 (dd, J=9.0, 2.1 Hz, 1H), 7.61–7.57 (m, 3H), 7.30 (d, J=3.6 Hz, 1H). 13C NMR (126 MHz, DMSO‐d6 ) δ=156.65, 154.67, 152.06, 149.24, 146.22, 141.49, 134.30, 133.46, 129.06, 128.04, 127.80, 126.61, 126.41, 125.79, 121.29, 118.39, 115.88, 108.79. HRMS (MALDI): m/z calculated 383.03486 for C20H13Cl2N2O2, found 383.03477 ([M+H]+).
7‐Chloro‐4‐((5‐(4‐chlorophenyl)furan‐2‐yl)methyl)‐3,4‐dihydro‐2H‐benzo[b][1,4]oxazine (5). 5‐(4‐chlorophenyl)furan‐2‐carbaldehyde (1.03 g, 5.00 mmol, 1.00 eq) was dissolved in THF (15 mL) at 0 °C. A solution of LiAlH4 (1 M, 5.00 mmol, 5.0 mL) was added, the mixture was stirred for 5 minutes at 0 °C, and then quenched by the addition of water (10 mL). The mixture was extracted with ethyl acetate (3×30 mL), the combined organic layers were dried over Na2SO4 and concentrated to obtain (5‐(4‐chlorophenyl)furan‐2‐yl)methanol as a colorless solid which was used without further purification. (5‐(4‐Chlorophenyl)furan‐2‐yl)methanol (100 mg, 0.48 mmol, 1.00 eq) was dissolved in a mixture of TEA (0.96 mL) and methylene chloride (10 mL), methanesulfonic acid chloride (65.9 mg, 0.58 mmol, 1.20 eq) was added and the mixture was stirred for 1 h at room temperature. Water (10 mL) was added, phases were separated, and the aqueous layer was extracted with ethyl acetate (3×30 mL). The combined organic layers were dried over Na2SO4 and concentrated. A solution of 7‐chloro‐3,4‐dihydro‐2H‐benzo[b][1,4]oxazine (6, 35.1 mg, 0.21 mmol, 0.40 eq) in toluene (20 mL) was added and the mixture was stirred under reflux for 48 h. After cooling to room temperature, water (20 mL) was added, the mixture was extracted with ethyl acetate (3×30 mL), the combined organic layer was dried over Na2SO4 and concentrated. The crude product was purified by column chromatography (methylene chloride/hexane 1 : 5+0.5 % AcOH) to obtain the title compound as a yellow solid (8.0 mg, 11 %). 1H NMR (500 MHz, acetone‐d6 ) δ=7.57–7.50 (m, 2H), 7.31–7.25 (m, 2H), 6.83 (d, J=8.7 Hz, 1H), 6.69 (d, J=3.3 Hz, 1H), 6.65 (dd, J=8.7, 2.5 Hz, 1H), 6.57 (d, J=2.5 Hz, 1H), 6.33 (d, J=3.3 Hz, 1H), 4.44 (s, 2H), 4.16–4.10 (m, 2H), 3.42–3.34 (m, 2H). 13C NMR (126 MHz, acetone‐d6 ) δ=152.11, 151.64, 145.09, 133.83, 132.33, 129.54, 128.83, 124.94, 121.46, 120.67, 115.88, 113.99, 110.65, 106.64, 64.68, 47.08, 46.81. HRMS (MALDI): m/z calculated 358.03961 for C19H14Cl2NO2, found 358.03973 ([M−H]−).
In vitro assays
Hybrid Gal4‐Nurr1 reporter gene assays. Reporter gene assays were performed in 96‐well format in HEK293T cells as reported previously using the Gal4‐fusion receptor plasmid pFA‐CMV‐hNurr1‐LBD [29] coding for the hinge region and LBD of the canonical isoform of Nurr1. The Gal4‐VP16 [34] fusion protein (pECE‐SV40‐Gal4‐VP16, [35] Addgene, entry 71728, Watertown, MA, USA) was employed as a ligand‐independent transcriptional inducer for control experiments. pFR‐Luc (Stratagene, La Jolla, CA, USA) served as reporter plasmid and pRL‐SV40 (Promega, Madison, WI, USA) was used for normalization of transfection efficiency and test compound toxicity. Transient transfection was achieved with the Lipofectamine LTX reagent (Invitrogen, Carlsbad, CA, USA). The test compound solutions were prepared in Opti‐MEM supplemented with penicillin (100 U/mL), streptomycin (100 μg/mL) and 0.1 % DMSO. Crude libraries were tested in a single concentration (∼30 μM for library A, ∼3 μM for library B) as single point measurements in three biologically independent experiments. Purified compounds from batch synthesis were tested at various concentrations for full dose‐response characterization. Each concentration was tested in duplicates, and each experiment was performed independently at least three times. Luminescence was measured with a Spark 10 M luminometer (Tecan Group AG, Männedorf, Switzerland), firefly luciferase data were divided by Renilla luciferase data and multiplied by 1000 to obtain relative light units (RLU). Fold activation was obtained by dividing the mean RLU of a test compound at a respective concentration by the mean RLU of untreated control and used for dose‐response curve fitting with the equation “[Agonist] vs. response–variable slope (four parameters)” in GraphPad Prism (version 7.00, GraphPad Software, La Jolla, CA, USA).
Full‐length Nurr1 reporter gene assays. Modulation of full‐length human Nurr1 by 4 e was observed in full‐length reporter gene assays as described previously using the reporter plasmids pFR‐Luc‐NBRE, [29] pFR‐Luc‐NurRE, [29] and pFR‐Luc‐DR5 [29] which contain one copy of the respective human Nurr1 response element NBRE Nl3, NurRE, or DR5 each. Full length human Nurr1 was expressed from pcDNA3.1‐hNurr1‐NE (Addgene, entry 102363), RXRα (for DR5) was expressed from pSG5‐hRXR. [36] Assay procedure, luminescence measurement and data analysis were performed as described for the hybrid reporter gene assays.
HTRF assay. Effects on the dimerization of the Nurr1‐LBD were studied in a homogeneous time‐resolved fluorescence resonance energy transfer assay system. Terbium cryptate as streptavidin conjugate (Tb‐SA; Cisbio Bioassays, Codolet, France) served as FRET donor and was coupled to biotinylated Nurr1‐LBD protein (produced as described previously [29] ). Recombinant sGFP‐Nurr1‐LBD (produced as described previously18) was used as FRET acceptor. All experiments were performed in white flat bottom polystyrol 384 well microtiter plates (Greiner Bio‐One, Frickenhausen, Germany) in HTRF assay buffer (150 mM KF, 25 mM HEPES pH 7.5 (KOH), 10 % (w/v) Glycerol, 5 mM DTT) supplemented with 0.1 % (w/v) CHAPS and 1 % DMSO. The assay solutions contained biotinylated Nurr1‐LBD (final concentration 0.6 nM), Tb‐SA (1.2 nM), sGFP‐Nurr1‐LBD (at varying concentrations up to 300 nM) and the test compounds at fixed concentrations. Free sGFP was added to keep the total sGFP content stable (300 nM) and to suppress artifacts from changes in the degree of diffusion‐enhanced FRET. Samples were set up in three technical replicates. After 1 h incubation at RT, fluorescence intensities (FI) after excitation at 340 nm were recorded at 520 nm for sGFP FRET acceptor fluorescence and 620 nm for Tb‐SA FRET donor fluorescence on a SPARK plate reader (Tecan Group AG). FI520 nm was divided by FI620 nm and multiplied with 10,000 to give a dimensionless HTRF signal.
Computational methods
General. Calculations were conducted in KNIME (version 4.1.3, KNIME AG, Zurich, Switzerland) using default settings for each tool/function unless stated otherwise with nodes from RDKit (version 4.0.1.v202002121352), MOE (version 2.4.2.20190814), CDK (version 1.5.600.v202004290959), and CIR KNIME integration (1.0.100.qualifier).
Library design. Molecular structures of reagents were obtained from their respective CAS numbers via the CIR node or manually inserted as SMILES strings. In order to prevent side reactions in library synthesis, the RDKit Functional Group filter was used to remove molecules with undesired functional groups (library A: primary/secondary amines, carboxylic acids, carbonyl chlorides, sulfonyl chlorides, esters, aromatic alcohols, alkyl halides, carbamates, boronic acids, and molecules with more than one carbonyl group; library B: carboxylic acids, carbonyl chlorides, sulfonyl chlorides, esters, aromatic alcohols, alkyl halides, carbamates, boronic acids). The MOE Molecule Properties node was used to calculate molecular weight and to eliminate non‐organic structures, and the MOE Wash node was used to remove minor salt components and obtain normalized reagent structures (disconnect salts; remove lone pairs; normalize ylides; remove minor components; adjust hydrogens: add). The Two Component Reaction node from RDKit was used to generate virtual product molecules from the reaction of 3 with aldehydes/ketones (library A) or 7 a with primary/secondary amines (library B). Therefore, the following SMARTS were given for the respective reaction to obtain amine (library A) or amide (library B) products: [#7;!H0;!$([#7]‐C=[O,N,S]);!$([#7]∼[!#6]):1].[C;H1 : 2](=[O])≫[#7 : 1]‐[C:2] (library A, for aldehyde educts), [#7;!H0;!$([#7]‐C=[O,N,S]);!$([#7]∼[!#6]):1].[C;H0;!$([C]‐[O,N]):2](=[O])≫[#7 : 1]‐[C:2] (library A, for ketone educts) and [#7;!H0;!$([#7]‐C=[O,N,S]);!$([#7]∼[!#6]):1].[C:2](=[O:3])‐[Cl]≫[#7 : 1]‐[C:2]=[O:3] (library B). Thus obtained virtual product molecules were converted to sdf format and washed using the MOE Wash node (disconnect salts; remove lone pairs; normalize ylides; remove minor components; deprotonate strong acids; protonate strong bases; adjust hydrogens: add). ECFP4 fingerprints were then calculated for the virtual product molecules using either the CDK Fingerprint node to obtain structurally diverse molecules via the RDKit Diversity picker node (random seed: −1, number to pick: 20) or the MOE ECFP Fingerprint calculator to calculate Tanimoto similarity via the Similarity Search node (distance selection: Tanimoto; coefficient type: distance; neighbors selection: nearest). As seed molecules CQ (library A) and 4 (library B) were used. For extraction of tertiary amines from library A, the following SMARTS input was used in the RDKit Molecule Substructure Filter: [#7;H0;!$([#7]‐C=[O,N]);!$([#7]∼[!#6]);!$([#7]#[#6]);!$([#7]:[#6]);!$([#7]=[#6])].
Pharmacophore modeling. For pharmacophore modeling, the molecular structures of AQ, 3 a‐3 n, 4, 4 a–4 u and 5 were loaded into MOE 2019.10 (Chemical Computing Group, Montreal, Canada). Manual check of the protonation state was performed to ensure that the nitrogen atom of the benzomorpholine moiety was protonated, while the nitrogen atoms of quinolines and related heterocycles were deprotonated. After initial energy minimization, conformers were generated using the LowModeMD protocol setting the energy window to 5 kcal/mol and the RMSD limit to 0.25. Compounds causing >1.5‐fold activation in the Gal4‐Nurr1 assays were considered as actives, the remaining as inactives. The generated conformers were subjected to the Pharmacophore Elucidation routine using Unified Pharmacophore scheme, allowing for active coverage of 70 % and the minimum number of 4 features. The superpositions and the corresponding pharmacophore models were manually inspected and the superposition with the highest accuracy (0.525) was used as a starting point for refinement using the Flexible Alignment routine, which was set to emphasize on aromatic atoms, H‐bond donors, and H‐bond acceptors. The resulting alignment was used for the generation of the final model. A consensus pharmacophore was calculated, considering features present in at least 80 % of the actives. After a pharmacophore search of the whole compound set (AQ, 3 a‐3 n, 4, 4 a–4 u and 5), superposition with inactive compounds was used to define excluded volumes on atoms of inactive molecules outside the refined alignment of active molecules.
Conflict of interest
The authors declare no conflict of interest.
1.
Supporting information
As a service to our authors and readers, this journal provides supporting information supplied by the authors. Such materials are peer reviewed and may be re‐organized for online delivery, but are not copy‐edited or typeset. Technical support issues arising from supporting information (other than missing files) should be addressed to the authors.
Supporting Information
Supporting Information
Acknowledgements
Gal4‐VP16 was a gift from Lea Sistonen (Addgene plasmid #71728). pcDNA3.1‐hNurr1‐NE was a gift from Shu Leong Ho (Addgene plasmid #102363). This project has received funding from the Innovative Medicines Initiative 2 Joint Undertaking (JU) under grant agreement No 875510. The JU receives support from the European Union's Horizon 2020 research and innovation programme and EFPIA and Ontario Institute for Cancer Research, Royal Institution for the Advancement of Learning McGill University, Kungliga Tekniska Hoegskolan, Diamond Light Source Limited. Open Access funding enabled and organized by Projekt DEAL.
S. Willems, M. Müller, J. Ohrndorf, J. Heering, E. Proschak, D. Merk, ChemMedChem 2022, 17, e202200026.
Data Availability Statement
The data that support the findings of this study are available from the corresponding author upon reasonable request.
References
- 1. Wang Z., Benoit G., Liu J., Prasad S., Aarnisalo P., Liu X., Xu H., Walker N. P. C., Perlmann T., Nature 2003, 423, 555–560. [DOI] [PubMed] [Google Scholar]
- 2. Alexander S. P., Cidlowski J. A., Kelly E., Marrion N. V., Peters J. A., Faccenda E., Harding S. D., Pawson A. J., Sharman J. L., Southan C., Davies J. A., Br. J. Pharmacol. 2017, 174, S208–S224. [DOI] [PMC free article] [PubMed] [Google Scholar]
- 3. Decressac M., Volakakis N., Björklund A., Perlmann T., Nat. Rev. Neurol. 2013, 9, 629–636. [DOI] [PubMed] [Google Scholar]
- 4. Willems S., Zaienne D., Merk D., J. Med. Chem. 2021, 64, 9592–9638. [DOI] [PubMed] [Google Scholar]
- 5. Benoit G., Cooney A., Giguere V., Ingraham H., Lazar M., Muscat G., Perlmann T., Renaud J.-P., Schwabe J., Sladek F., Tsai M.-J., Laudet V., Pharmacol. Rev. 2006, 58, 798–836. [DOI] [PubMed] [Google Scholar]
- 6. Liu H., Liu H., Li T., Cui J., Fu Y., Ren J., Sun X., Jiang P., Yu S., Li C., Neurosci. Lett. 2017, 650, 25–32. [DOI] [PubMed] [Google Scholar]
- 7. Jeon S. G., Yoo A., Chun D. W., Hong S. B., Chung H., Kim J.-I., Moon M., Aging Dis. 2020, 11, 705–724. [DOI] [PMC free article] [PubMed] [Google Scholar]
- 8. Chu Y., Le W., Kompoliti K., Jankovic J., Mufson E. J., Kordower J. H., J. Comp. Neurol. 2006, 494, 495–514. [DOI] [PMC free article] [PubMed] [Google Scholar]
- 9. Satoh J., Nakanishi M., Koike F., Miyake S., Yamamoto T., Kawai M., Kikuchi S., Nomura K., Yokoyama K., Ota K., Kanda T., Fukazawa T., Yamamura T., Neurobiol. Dis. 2005, 18, 537–550. [DOI] [PubMed] [Google Scholar]
- 10. Moon M., Jeong I., Kim C.-H., Kim J., Lee P. K. J., Mook-Jung I., Leblanc P., Kim K.-S., J. Neurochem. 2015, 132, 254–262. [DOI] [PMC free article] [PubMed] [Google Scholar]
- 11. Moon M., Jung E. S., Jeon S. G., Cha M.-Y., Jang Y., Kim W., Lopes C., Mook-Jung I., Kim K.-S., Aging Cell 2019, 18, e12866. [DOI] [PMC free article] [PubMed] [Google Scholar]
- 12. Jakaria M., Haque M. E., Cho D.-Y., Azam S., Kim I.-S., Choi D.-K., Mol. Neurobiol. 2019, 56, 5799–5814. [DOI] [PubMed] [Google Scholar]
- 13. Montarolo F., Perga S., Martire S., Bertolotto A., Inflammation Res. 2015, 64, 841–844. [DOI] [PubMed] [Google Scholar]
- 14. Liu W., Gao Y., Chang N., Biochem. Biophys. Res. Commun. 2017, 482, 1312–1319. [DOI] [PubMed] [Google Scholar]
- 15. Kadkhodaei B., Alvarsson A., Schintu N., Ramsköld D., Volakakis N., Joodmardi E., Yoshitake T., Kehr J., Decressac M., Björklund A., Sandberg R., Svenningsson P., Perlmann T., Proc. Natl. Acad. Sci. USA 2013, 110, 2360–2365. [DOI] [PMC free article] [PubMed] [Google Scholar]
- 16. España J., Valero J., Miñano-Molina A. J., Masgrau R., Martín E., Guardia-Laguarta C., Lleó A., Giménez-Llort L., Rodríguez-Alvarez J., Saura C. A., J. Neurosci. 2010, 30, 9402–9410. [DOI] [PMC free article] [PubMed] [Google Scholar]
- 17. Parra-Damas A., Valero J., Chen M., España J., Martín E., Ferrer I., Rodríguez-Alvarez J., Saura C. A., J. Neurosci. 2014, 34, 5776–5787. [DOI] [PMC free article] [PubMed] [Google Scholar]
- 18. Kim C.-H., Han B.-S., Moon J., Kim D.-J., Shin J., Rajan S., Nguyen Q. T., Sohn M., Kim W.-G., Han M., Jeong I., Kim K.-S., Lee E.-H., Tu Y., Naffin-Olivos J. L., Park C.-H., Ringe D., Yoon H. S., Petsko G. A., Kim K.-S., Proc. Natl. Acad. Sci. USA 2015, 112, 8756–8761. [DOI] [PMC free article] [PubMed] [Google Scholar]
- 19. Munoz-Tello P., Lin H., Khan P., De Vera I. M. S., Kamenecka T. M., Kojetin D. J., J. Med. Chem. 2020, 63, 15639–15654. [DOI] [PMC free article] [PubMed] [Google Scholar]
- 20. Bruning J. M., Wang Y., Oltrabella F., Tian B., Kholodar S. A., Liu H., Bhattacharya P., Guo S., Holton J. M., Fletterick R. J., Jacobson M. P., England P. M., Cell Chem. Biol. 2019, 26, 674–685.e6. [DOI] [PMC free article] [PubMed] [Google Scholar]
- 21. Kholodar S. A., Lang G., Cortopassi W. A., Iizuka Y., Brah H. S., Jacobson M. P., England P. M., ACS Chem. Biol. 2021, 16, 1159–1163. [DOI] [PMC free article] [PubMed] [Google Scholar]
- 22. de Vera I. M. S., Giri P. K., Munoz-Tello P., Brust R., Fuhrmann J., Matta-Camacho E., Shang J., Campbell S., Wilson H. D., Granados J., Gardner W. J. J., Creamer T. P., Solt L. A., Kojetin D. J., ACS Chem. Biol. 2016, 11, 1795–1799. [DOI] [PMC free article] [PubMed] [Google Scholar]
- 23. Rajan S., Jang Y., Kim C. H., Kim W., Toh H. T., Jeon J., Song B., Serra A., Lescar J., Yoo J. Y., Beldar S., Ye H., Kang C., Liu X. W., Feitosa M., Kim Y., Hwang D., Goh G., Lim K. L., Park H. M., Lee C. H., Oh S. F., Petsko G. A., Yoon H. S., Kim K. S., Nat. Chem. Biol. 2020, 16, 876–886. [DOI] [PMC free article] [PubMed] [Google Scholar]
- 24. Willems S., Ohrndorf J., Kilu W., Heering J., Merk D., J. Med. Chem. 2021, 64, 2659–2668. [DOI] [PubMed] [Google Scholar]
- 25. Schneider G., Neidhart W., Giller T., Schmid G., Angew. Chem. Int. Ed. 1999, 38, 2894–2896; [PubMed] [Google Scholar]; Angew. Chem. 1999, 111, 3068–3070. [Google Scholar]
- 26. Hu Y., Stumpfe D., Bajorath J., J. Med. Chem. 2016, 60, 1238–1246. [DOI] [PubMed] [Google Scholar]
- 27. Rogers D., Hahn M., J. Chem. Inf. Model. 2010, 50, 742–754. [DOI] [PubMed] [Google Scholar]
- 28. Abdel-Magid A. F., Carson K. G., Harris B. D., Maryanoff C. A., Shah R. D., J. Org. Chem. 1996, 61, 3849–3862. [DOI] [PubMed] [Google Scholar]
- 29. Willems S., Kilu W., Ni X., Chaikuad A., Knapp S., Heering J., Merk D., Commun. Chem. 2020, 3, 85. [DOI] [PMC free article] [PubMed] [Google Scholar]
- 30. Heering J., Merk D., Methods Mol. Biol. 2019, 1966, 175–192. [DOI] [PubMed] [Google Scholar]
- 31. Willems S., Kilu W., Faudone G., Heering J., Merk D., bioRxiv 2021, 2021.09.15.460433. [Google Scholar]
- 32. Morgan H. L., J. Chem. Doc. 1965, 5, 107–113. [Google Scholar]
- 33. Zaienne D., Willems S., Schierle S., Heering J., Merk D., J. Med. Chem. 2021, 64, 15126–15140. [DOI] [PubMed] [Google Scholar]
- 34. Sadowski I., Ma J., Triezenberg S., Ptashne M., Nature 1988, 335, 563–564. [DOI] [PubMed] [Google Scholar]
- 35. Budzyński M. A., Puustinen M. C., Joutsen J., Sistonen L., Mol. Cell. Biol. 2015, 35, 2530–2540. [DOI] [PMC free article] [PubMed] [Google Scholar]
- 36. Seuter S., Väisänen S., Rådmark O., Carlberg C., Steinhilber D., Biochim. Biophys. Acta Mol. Cell Biol. Lipids 2007, 1771, 864–872. [DOI] [PubMed] [Google Scholar]
Associated Data
This section collects any data citations, data availability statements, or supplementary materials included in this article.
Supplementary Materials
As a service to our authors and readers, this journal provides supporting information supplied by the authors. Such materials are peer reviewed and may be re‐organized for online delivery, but are not copy‐edited or typeset. Technical support issues arising from supporting information (other than missing files) should be addressed to the authors.
Supporting Information
Supporting Information
Data Availability Statement
The data that support the findings of this study are available from the corresponding author upon reasonable request.