

Abstract
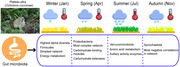
Seasonal variations in gut microbiota of small mammals and how they are influenced by environmental variables are relatively poorly understood. We sampled 162 wild plateau pikas (Ochotona curzoniae) in 4 seasons over 2 and a half years and recorded the air temperature, precipitation, and nutrient content in edible vegetation at the sampling site. After conducting 16S rRNA and shotgun metagenomic sequencing, we found that the highest alpha diversity, the relative abundance of Firmicutes, and the simplest co‐occurrence network occurred in winter, whereas the highest relative abundance of Proteobacteria and the most complex network structure were observed in spring. The highest relative abundance of Verrucomicrobiota and Spirochaetota was seen in summer and autumn, respectively. Air temperature, precipitation, and the contents of crude protein, crude fiber, and polysaccharide in vegetation had significant effects on the seasonal changes in gut microbiota. Diet contributed more to microbial variation than climatic factors. Metagenomic analysis revealed that the amino acid metabolism pathway and axillary activity enzymes were most abundant in summer, while abundance of carbohydrate‐binding modules and carbohydrate esterases was highest in spring. These microbial variations were related to the changes in dietary nutrition, indicating that gut microbiota of plateau pika contribute to the efficient use of food resources. This study provides new evidence of how external environmental factors affect the intestinal environment of small mammals.
Keywords: 16S rRNA gene, gut microbiota, plateau pikas (Ochotona curzoniae), seasonal variation, shotgun metagenomic sequencing
The composition and functional profiles of gut microbiota in plateau pikas changed among seasons. Environmental factors (especially diet) had significant effect on it. This study provides new evidence of how external factors affect the intestinal environment of small mammals.
INTRODUCTION
The intestinal tract harbors a complex bacterial community and these living microorganisms have an enormous impact on the nutritional and health status of the host (Smits et al. 2017; Kešnerová et al. 2020). Moreover, several longitudinal studies of wild animals suggest that gut microbial composition is not stable over time and is usually influenced by environmental fluctuations. In mammals such as wild wood mice (Apodemus sylvaticus), black howler monkeys (Alouatta pigra), and white‐faced capuchins (Cebus capucinus simulator), the gut microbiome follows seasonal dynamics (Amato et al. 2015; Maurice et al. 2015; Orkin et al. 2019). Lots of fish (Karlsen et al. 2017), amphibians (Tong et al. 2020), and insects (Kešnerová et al. 2020) also show these characteristics. Additionally, both Hadza who live a hunter‐gatherer lifestyle (Smits et al. 2017) and Japanese people who live an urbanized lifestyle (Hisada et al. 2015) showed seasonal cycling in their gut microbiome.
The structure and function of gut microbiota are closely related to animal life history characteristics and play an important role in improving hosts’ environmental adaptability (Fragiadakis et al. 2019; Orkin et al. 2019; Kešnerová et al. 2020). Seasonal variations in gut microbial composition found in animals are largely driven by seasonal shifts in diet (Muegge et al. 2011; Carey et al. 2013; Maurice et al. 2015). The gut microbiome of the Hadza people could be inextricably linked to their foraging lifestyle, and the seasonal variation in the microbiome can mainly be attributed to differences in diet between the hunting and gathering seasons (Smits et al. 2017). In addition to being directly affected by diet, the animal gut microbiome is indirectly influenced by seasonal climatic changes, such as in precipitation (Li et al. 2020) and air temperature (Bestion et al. 2017; Siles & Margesin 2017). Therefore, most studies on the external factors influencing seasonal changes in the gut microbiota of wild animals have focused on temporal changes in air temperature, precipitation, and nutritional composition. However, research on the seasonal changes and trophic interactions between gut microbiota and food resource‐use strategies of the hosts is still very limited.
The plateau pika (Ochotona curzoniae) is a typical Qinghai–Tibetan Plateau endemic animal belonging to the lagomorph family, Ochotonidae, and is a diurnal, social, burrowing small mammal (Pech et al. 2007; Arthur et al. 2008). It is of great ecological significance to study the relationship between gut microbiota and the living environment of this typical alpine herbivorous mammal. Significant differences in its gut microbiota have been documented in different geographical populations and altitudes, indicating strong environmental influences on microbial characteristics (Li et al. 2016, 2019). After the long‐term evolutionary process, plateau pikas have developed special adaptations to the harsh environment: They always maintain a high resting metabolic rate and a high body temperature of ∼39°C in all the seasons (Wang et al. 2006) and hold a very low mortality rate (4–6%), although they do not store food or hibernate in the winter (Qu et al. 2012; Smith et al. 2019; Speakman et al. 2021). In order to get an adequate energy supply, plateau pikas make their assimilation rate to natural food reach more than 70% (Wang et al. 1980). The vegetative nutrient contents in the 4 seasons are different, making the energy acquisition strategy of plateau pikas also change accordingly. Previous studies have explored the differences in gut microbiota of plateau pika between winter and summer, and compared the effects of seasons and host species identity on variations in microbial diversity (Wang et al. 2020; Fu et al. 2021). However, knowledge regarding the changes in gut microbiota of plateau pika between the traditional 4 seasons is limited. How it helps the host to improve the utilization efficiency of food resources and the adaptability to climate factors has not been well described.
Sequence‐based methodologies, especially metagenomic sequencing, are currently used to assess the function of the gut microbiome (Wang et al. 2019). Metagenomic analysis is an essential tool for identifying gut microbiota involvement in metabolic activities (Magnúsdóttir et al. 2017). Previous researches on the seasonal variation of animal gut microbiota have studied changes in related functional pathways, finding that carbohydrate‐active enzymes (CAZymes) in gut microbiota also play important roles and be involved in the metabolic capacity of the microbial community (Cao et al. 2020; Liu et al. 2020). Therefore, introducing the above‐mentioned data analysis into the study can deepen our understanding of the gut microbial seasonal dynamics and its relationship with the environmental conditions and strategies of energy harvest.
In this study, we monitored a population of plateau pikas for 2 and a half years. Feces of 162 individuals were sampled, and the nutritional composition of vegetation, as well as the climate at the sampling site, was surveyed over 4 seasons. Fecal microbiota was profiled using 16S rRNA and shotgun metagenomic sequencing. Alpha diversity, major bacterial taxa, co‐occurrence networks, functional pathways, and CAZyme system in different seasons were compared. The effect of environmental factors on gut microbial composition was evaluated. Additionally, seasonal variations in gut microbial functions and the correlations between gut microbial indicators and environmental factors were calculated. The above work was conducted to answer the following scientific questions: (1) What are the differences in composition and functional profiles in gut microbiota of plateau pikas across the 4 seasons? (2) Is diet a key factor in regulating changes in the composition and function of the gut microbiota in the plateau pikas? (3) Does the CAZyme system also undergo similar changes in the vegetative nutritional composition that facilitate the efficiency of vegetation use by the host? The results represent a step forward in understanding the seasonal changes and environmental adaptability of gut microbiota in mammals living on the plateau.
MATERIALS AND METHODS
Fecal sample collection
The protocol was approved by the Ethics Committee of Northwest Institute of Plateau Biology. All animal procedures were conducted according to the Regulations for the Administration of Laboratory Animals established by the Ministry of Science and Technology of the People's Republic of China (2017 Revision).
The sampling time was over continuous seasons from January 2017 to April 2019, and 25 samples from January 2017 and July 2017 also have been used in a previous article (Fu et al. 2021). The wild adult plateau pika sample collection (Table S1, Supporting Information) was performed in winter (January, n = 54), spring (April, n = 47), summer (July, n = 35), and autumn (November, n = 26) in Gangcha County (altitude: 3650 m; 37°9′3″N, 100°28′40″E), Qinghai, China (Fig. 1a). This area is covered by a typical alpine meadow and is characterized by a continental plateau climate. We trapped adult plateau pikas using live‐trapping and locked them in cages previously sterilized with 75% alcohol. Fresh feces were collected in 2‐mL tubes (Sigma‐Aldrich, St. Louis, MO, USA), immediately frozen in liquid nitrogen before being sent for analysis to the Northwest Plateau Institute of Biology, Chinese Academy of Sciences, Xining, China.
Figure 1.

Sample collection and seasonal variation in gut microbial diversity of plateau pikas. (a) The sampling site and photos of plateau pikas (Authors’ own). (b) Principal co‐ordinate analysis (PCoA) based on Bray–Curtis distances of the relative abundance of operational taxonomic units (OTUs). (c) Observed OTUs. (d) Shannon index. (e) Abundance‐based coverage estimator (ACE) index. Differences are denoted as follows: * P < 0.05; ** P < 0.01; *** P < 0.001. Jan, Apr, Jul, and Nov are short for January, April, July, and November (similarly in the following tables and figures).
Data on environmental factors
Air temperature (monthly mean temperature) and precipitation (monthly precipitation) at sampling sites were obtained from climate data from the Gangcha meteorological station. Fresh aerial parts of plants edible to plateau pika were harvested from 5 random 1 × 1 m2 quadrats in the sampling sites in 4 seasons. They were taken back to the laboratory and dried to a constant weight at 60°C. The dried samples were crushed and passed through a 0.25‐mm sieve and then sent to the Analysis and Measurement Center of Northwest Institute of Plateau Biology, Qinghai, China, to determine the concentration of crude fiber, crude protein, polysaccharides, crude fat, total carbohydrates, and lignin.
DNA extraction and sequencing
Microbial community genomic DNA was extracted from all the fecal samples using the E.Z.N.A.® soil DNA Kit (Omega Bio‐tek, Norcross, GA, USA) according to the manufacturer's instructions. The DNA extract was checked on 1% agarose gel, and DNA concentration and purity were determined with a NanoDrop 2000 UV–vis spectrophotometer (Thermo Scientific, Wilmington, USA). The hypervariable region V3‐V4 of the bacterial 16S rRNA gene was amplified with primer pairs 338F (5′‐ACTCCTACGGGAGGCAGCAG‐3′) and 806R (5′‐GGACTACHVGGGTWTCTAAT‐3′) using an ABI GeneAmp® 9700 PCR thermocycler (ABI, CA, USA). PCR amplification of the 16S rRNA gene was performed as follows: initial denaturation at 95°C for 3 min, followed by 27 cycles of denaturing at 95°C for 30 s, annealing at 55°C for 30 s, extension at 72°C for 45 s, and a single extension at 72°C for 10 min, ending at 4°C. The PCR mixtures contained 5 × TransStart FastPfu buffer 4 μL, 2.5 mM dNTPs, 2 μL forward primer (5 μM), 0.8 μL reverse primer (5 μM), 0.8 μL TransStart FastPfu DNA Polymerase 0.4 μM, template DNA 10 ng, and finally double distilled water (ddH2O) up to 20 μL. PCR reactions were performed in triplicate. The PCR product was extracted from 2% agarose gel and purified using the AxyPrep DNA Gel Extraction Kit (Axygen Biosciences, Union City, CA, USA) according to the manufacturer's instructions and quantified using a Quantus™ Fluorometer (Promega, Madison, WI, USA). Purified amplicons were pooled equimolarly and paired‐end sequenced on an Illumina MiSeq PE300 platform/NovaSeq PE250 platform (Illumina, San Diego, USA) according to the standard protocols by Majorbio Bio‐Pharm Technology Co. Ltd. (Shanghai, China).
Total genomic DNA was extracted from 16 fecal samples (January, n = 4; April, n = 5; July, n = 4; November, n = 3) using a QIAamp DNA Stool Mini Kit (Qiagen, Dusseldorf, Germany) according to the manufacturer's instructions. The DNA concentration was measured using a NanoDrop ND‐1000 (Thermo Scientific, Waltham, MA, USA). The DNA samples were interrupted using a Covaris ultrasonic crusher with a length of ∼350 bp. The libraries were prepared following the steps of end repair, a 3ʹ A tail addition, adapter ligation, and purification. Additionally, the assessment of library quality was conducted by using the Qubit 2.0 Fluorometer (Thermo Fisher, Waltham, MA, USA) and Agilent Bioanalyzer 2100 System. Next, the qualifying libraries were sequenced on an Illumina HiSeq 2500 platform with a method of paired‐end reads.
16S rRNA data processing
The raw gene sequencing reads were de‐multiplexed, quality‐filtered, and merged using fastp version 0.20.0 (Chen et al. 2018) and FLASH version 1.2.7 (Magoč & Salzberg 2011) with the following criteria: (i) the 300 bp reads were truncated at any site receiving an average quality score < 20 over a 50 bp sliding window, and the truncated reads shorter than 50 bp, as well as reads containing ambiguous characters were discarded; (ii) only overlapping sequences longer than 10 bp were assembled according to their overlapped sequences, the maximum mismatch ratio of the overlap region was 0.02, and reads that could not be assembled were discarded; (iii) samples were distinguished according to the barcode and primers, and the sequence direction was adjusted, with exact barcode matching and 2 nucleotide mismatches in primer matching. Operational taxonomic units (OTUs) with a 97% similarity cut‐off were clustered using UPARSE version 7.1 (Edgar 2013), and chimeric sequences were identified and removed. The archaea, mitochondria, and chloroplast OTUs were removed. The taxonomy of each OTU representative sequence was analyzed using RDP Classifier version 2.2 against the SILVA SSU 138 database (Glöckner et al. 2017). To balance the differences in sequencing depth among different samples, we conducted a normalization based on the minimum value of sequence counts among all samples.
Metagenomic data processing
Raw data were processed to acquire clean data for subsequent analysis, producing metagenomic joined reads. The data were analyzed on the free online platform of Majorbio Cloud Platform (www.majorbio.com). The paired‐end Illumina reads were trimmed of adaptors, and low‐quality reads (length < 50 bp or with a quality value <20 or having N bases) were removed by fastp. Qualifying DNA samples were randomly interrupted using a Covaris ultrasonic crusher and produced approximately 350 bp libraries. Finally, the sequencing produced an average of 540 million metagenome jointed reads (∼12 Gb) per sample. Summary information from the raw sequences to the final functional annotation was shown in Table S2, Supporting Information. The Diamond v0.9.9 software was used to blast Unigenes to databases based on the parameter setting of blastp (Buchfink et al. 2015). The databases included the Kyoto Encyclopedia of Genes and Genomes (KEGG) and the Carbohydrate‐Active Enzymes database (CAZy). For the blast result of each sequence, the best blast hit was used for subsequent analysis (Karlsson et al. 2013).
Statistical analysis
Statistical analyses were performed using R v3.5.3. The R package “vegan” (Dixon 2003) was used to calculate differences in the alpha diversity, relative abundance of major bacterial taxa and functional pathways, and to perform Adonis (permutational MANOVA) analysis. Canonical correlation analysis (CCA) and variance partitioning analysis (VPA) based on a distance‐based linear model were used to measure the effects of external factors on gut microbiota, and Mantel test was used to analyze the correlation between the matrices. Venn diagrams were used to show seasonal distribution of functional pathways and CAZymes. The above analyses were also completed with the “vegan” package. The resulting P‐values from post hoc pairwise comparisons following Kruskal–Wallis tests were corrected by the false discovery rate (FDR) method. A principal co‐ordinate analysis (PCoA) was completed using the “vegan” and “ade4” packages (Arumugam et al. 2011). Heatmaps were plotted using R package “pheatmap”. The correlation test among variables was conducted using the “corrplot” package. The visualization process of the above analysis was mainly realized using the “ggplot2” package in R and graphpad prism v7.0 software. OTUs distributed in all seasons were selected and the top 200 of them were chosen for Spearman's correlation analysis. This was done by screening out significant correlations (FDR P < 0.05) with an absolute coefficient value greater than 0.6 from the results, and then drawing the co‐occurrence networks using gephi v0.9.2 software (Jacomy et al. 2014). Linear discriminant analysis was analyzed and visualized using LEfSe software. The results of correlation tests among different variables were shown by Circos diagrams, drawn using Circos v0.69‐9 software (Krzywinski et al. 2009).
RESULTS
Seasonal variation in gut microbial diversity
From the fecal samples of the plateau pikas, 4 580 036 high‐quality sequences of the 16S rRNA gene were clustered into 9435 OTUs after data processing. A PCoA based on the Bray–Curtis distances of OTU relative abundances showed that the distribution of fecal samples from the 4 seasons showed a significant separation, which was confirmed by Adonis analysis (R 2 = 0.132, P < 0.001) (Fig. 1b). Although the gut microbiota of the plateau pikas also had annual differences (R 2 = 0.070, P < 0.001), its R 2 value was far less than that of seasonal factors. It is worth noting that the intra‐group Bray–Curtis distances of individuals in January and July were lower than in April and November (mean ± SEM, Jan: 0.517 ± 0.008, Apr: 0.652 ± 0.016, Jul: 0.571 ± 0.010, Nov: 0.609 ± 0.013; Kruskal–Wallis test, χ2 = 66.891, P < 0.001). Meanwhile, the observed OTUs (Kruskal–Wallis test, χ2 = 16.186, P = 0.001) (Fig. 1c), Shannon index (Kruskal–Wallis test, χ2 = 40.846, P < 0.001) (Fig. 1d), and abundance‐based coverage estimator (ACE) index (Kruskal–Wallis test, χ2 = 14.754, P = 0.002) (Fig. 1e) in January were the highest.
Gut microbial taxonomic difference among seasons
At the phylum level, the relative abundance of Firmicutes in January was significantly higher than that in April and July (Fig. 2a,b; Table S3, Supporting Information). The relative abundance of Bacteroidota in November was significantly higher than that in April. The relative abundances of Firmicutes and Bacteroidota showed opposite trends (Fig. 2c). The relative abundances of the major families were also significantly different among 4 seasons (Fig. 2d). The relative abundances of Muribaculaceae in November was significantly higher than that in the other 3 seasons, and the relative abundances of Lachnospiraceae, Prevotellaceae, and Ruminococcaceae in January were significantly higher than those seen in April and July (Fig. 2e–g; Table S4, Supporting Information). Additionally, the highest relative abundances of Akkermansiaceae and Erysipelotrichaceae occurred in July and January, respectively.
Figure 2.

Differences in relative abundance of major phyla (top 6) and major families (top 10) among seasons. (a) Taxonomic compositions at phylum level over 4 seasons. (b) Seasonal differences in relative abundance of major phyla (mean ± SEM). (c) Changes respective to each sampling month in relative abundances of the top 2 phyla. (d) Taxonomic compositions at family level over 4 seasons. Panels (e) and (f) show changes respective to each sampling month in relative abundances of the top 6 families. (g) Seasonal differences in relative abundance of major families. Differences are denoted as follows: * P < 0.05; ** P < 0.01; *** P < 0.001.
Seasonal differences in gut microbiota co‐occurrence networks
The gut microbiota of the plateau pikas had the most complex network structure with 189 nodes and 2512 links in April, 186 nodes and 1842 links in November, 170 nodes and 923 links in July, and 158 nodes and 777 links in January (Fig. 3). Several other important network topological properties such as average degree, average weighted degree, and density also showed differences in the network structures of the plateau pikas (Table S5, Supporting Information). It is worth noting that in April and July, the positive correlation in the networks occupied an absolute dominant position (more than 97%), whereas in January and November, the negative correlation increased (more than 25%).
Figure 3.

Co‐occurrence networks of the top 200 operational taxonomic units (OTUs) among seasons. Nodes represent OTUs and their sizes indicate different relative abundance. Links between the nodes represent a significant and strong correlation between 2 OTUs (Spearman's correlation greater than 0.6 or lower than −0.6). Line color reflects direction (green: negative; red: positive).
Effects of environmental factors on the seasonal variation of gut microbiota
Among the 4 months, July had the highest air temperature and precipitation, whereas January had the lowest (Fig. 4a). The vegetation contained the highest crude protein in July; the highest crude fiber, crude fat, total carbohydrates, and lignin concentrations in January; and the most polysaccharides in November. A CCA based on an OTU table was used to assess the effect of environmental factors on gut microbiota (Fig. 4b). Climatic factors (air temperature and precipitation) and 3 dietary factors (crude protein, crude fiber, and polysaccharides) had significant effects on seasonal changes of gut microbiota in the plateau pikas. The direction of vectors, the distribution of samples, and the results of Mantel tests all demonstrated external influences on microbial communities (Table S6, Supporting Information). The vector representing fiber had an acute angle with the April samples and some January samples, while the vector representing polysaccharides had an acute angle with the November samples and a part of the July samples. Vectors representing crude protein, precipitation, and air temperature mainly pointed to the July samples. Meanwhile, a VPA was performed to quantify the relative contributions of the different environmental factors to changes in the bacterial community structure using the “varpart” procedure (Fig. 4c). Air temperature, precipitation, and nutrition from vegetation explained 2%, 2%, and 7% of the observed variation, respectively. A combination of air temperature and nutrition explained 1%, and a combination of all 3 factors explained 1%.
Figure 4.

The effects of environmental factors on the seasonal variation of gut microbiota. (a) Environmental factors among seasons (Mean ± SEM). Differences are denoted as follows: * P < 0.05; ** P < 0.01; *** P < 0.001. (b) Canonical correlation analysis (CCA) plots with a doubled vector length. (c) Variance partitioning analysis (VPA) of the 3 types of factors.
Seasonal differences in gut microbial functions
Through the PCoA based on the Bray–Curtis distance of relative abundance of the KEGG Orthologs (KOs), we found that there was a separation between the January and July individuals, and a pairwise Adonis test revealed these 2 groups to be almost significantly different (R 2 = 0.295, P = 0.063) (Fig. 5a). Individuals from April and November were distributed between that of January and July. The individuals in July had the highest enrichment in genes for amino acid metabolism (Kruskal–Wallis test, χ2 = 8.929, P = 0.030) (Fig. 5b), whereas individuals in January had the highest enrichment in genes for energy metabolism (Kruskal–Wallis test, χ2 = 6.712, P = 0.073). Gut bacteria of plateau pikas shared 4201 KOs over the seasons, and the number of KOs unique to January, April, July, and November were 64, 1277, 18, and 26, respectively (Fig. 5c). The clustering heatmap based on relative abundance of level‐2 KEGG pathways showed that individuals from January, April, and November (withered period of vegetation) were clustered into one group, while July (vigorous growth period of vegetation) was a separate group (Fig. 5d). Additionally, the LEfSe method was used to compare the level‐3 KEGG pathways among the 4 seasons, finding the enrichment of genes on protein digestion and absorption and histidine metabolism in July (Fig. 5e).
Figure 5.

Seasonal difference in gut microbial functions. (a) Principal co‐ordinate analysis (PCoA) based on Bray–Curtis distances of the relative abundance of KOs. (b) Relative abundance of level‐2 KEGG pathways. (c) Venn diagram for distribution of KOs among seasons. (d) Heatmap with cluster analysis of functions. (e) LEfSe analysis of seasonal differences in relative abundance of level‐3 KEGG pathways.
AAs (axillary activity enzymes), CBMs (carbohydrate‐binding modules), CEs (carbohydrate esterases), GHs (glycoside hydrolases), GTs (glycoside transferases), and PLs (polysaccharide lyases) were annotated. Through the PCoA based on Bray–Curtis distances of relative abundance of the level‐2 CAZymes, we found that there was a significant separation between all 4 seasons (Adonis, R 2 = 0.299, P = 0.018) (Fig. 6a). Gut bacteria of plateau pikas shared 278 CAZymes over the seasons, and the number of CAZymes unique to January, April, July, and November were 1, 9, 1, and 0, respectively (Fig. 6b). The clustering heatmap based on relative abundance of level‐1 (Class) CAZymes showed that individuals from January, July, and November were clustered into one group, while April was a separate group (Fig. 6c). The abundance of AAs in July was significantly higher than that in January and April (Kruskal–Wallis test, χ2 = 11.926, P = 0.008), while the abundances of CBMs (χ2 = 10.746, P = 0.013), CEs (χ2 = 8.410, P = 0.038) and PLs (χ2 = 12.094, P = 0.007) were the highest in April (Fig. 6d). The LEfSe method used to compare the level‐2 (Family) CAZymes among the 4 seasons was shown in Fig. 6e and April had the most seasonal enriched CAZymes.
Figure 6.

Seasonal difference in gut microbial carbohydrate‐active enzymes (CAZymes). (a) PCoA based on Bray–Curtis distances of the relative abundance of level‐2 CAZymes. (b) Venn diagram for distribution of CAZymes among seasons. (c) Heatmap with cluster analysis of CAZymes. (d) Differences in abundance of the 6 level‐1 CAZymes among seasons. (e) LEfSe analysis of seasonal differences in relative abundance of level‐2 CAZymes.
Correlations between various indicators
By using Mantel test to analyze the matrix of various data, we also found that the environmental factors were significantly correlated with the relative abundance of gut microbial families (r = 0.447, P = 0.002) (Fig. 7a). Meanwhile, the relative abundance of gut microbial families were significantly correlated with that of the level‐2 KEGG pathways (r = 0.181, P = 0.047) and the CAZymes (r = 0.212, P = 0.017). The relative abundance of the level‐2 KEGG pathways were also significantly correlated with the relative abundance of CAZymes (r = 0.496, P < 0.001). To further explore the specific interactions of various indicators, we analyzed Spearman's correlations and took P < 0.05 and the absolute values of coefficients greater than 0.7 as the standards to screen out strong correlations (positive: 36; negative: 27) (Fig. 7b). Among the environmental factors, gut microbial families, alpha diversity indices, and level‐2 KEGG pathways, the indicators with the most links were polysaccharides, Prevotellaceae, Shannon index and global and overview maps, respectively.
Figure 7.

Correlations between various indicators. (a) Mantel test (Spearman's correlations) for the correlations between each type of data; width of ribbons was determined using the correlation coefficient. (b) Spearman's correlations between different indicators: significant correlations were selected based on the coefficients (|r| > 0.7), Ribbon color reflects direction (green: negative; red: positive).
DISCUSSION
Seasonality of gut microbial diversity
In this study, we found that the sample centroids of the 4 seasons were separated from each other (Fig. 1b), suggesting that seasonal changes can affect variations in the microbial community composition of plateau pikas, and that this effect was much greater than the annual difference that may be influenced by macroclimatic changes (Fragiadakis et al. 2019). It is worth noting that the samples from January had the lowest Bray–Curtis distance. This phenomenon is common in the seasonal variation of gut microbiota in small animals, such as the ground squirrel (Dill‐McFarland et al. 2014) and wild mouse (Maurice et al. 2015). Food shortage and a stable physiological state of host usually reduced beta‐diversity of gut microbiota (Liu et al. 2019; Xiao et al. 2019). There was a large difference in environmental variables between winter and summer (Fig. 4a). The group in January was very distinct from the group in July in PCoA plots. Differences in environmental conditions and host physiological status between winter and summer are usually markedly different in a year, making the 2 seasonal samples the furthest apart from each other (Dill‐McFarland et al. 2014; Xiao et al. 2019; Kešnerová et al. 2020).
Diversity is critical in maintaining the stability and function of the microbial community, and alpha diversity indices can reflect its overall structure, health, and metabolic ability (Werner et al. 2011; Clarke et al. 2014). Changes in environmental factors between the dry and wet seasons may be the main reason for the variations in alpha diversity of gut microbiota (Smits et al. 2017; Brice et al. 2019; Jin et al. 2021). The gut microbiota of lizards showed a reduction in alpha diversity following an increase in ambient air temperature (Bestion et al. 2017), whereas cold exposure could increase the alpha diversity of gut microbiota (Zhang et al. 2018a; Khakisahneh et al. 2020). Our previous study also showed that the alpha diversity of both yak (Bos grunniens) and plateau pika was higher in winter than in summer (Fu et al. 2021). Meanwhile, studies on the Hadza people (Smits et al. 2017) and white‐faced capuchins (Orkin et al. 2019) have shown that gut microbial diversity is higher in the dry season than in the rainy season. In the Qinghai−Tibet Plateau, there was not only cold but also had the lowest precipitation, and the vegetation had the highest crude fiber and lignin content in winter (Fig. 4a). The combination of low temperature, drought, and the cellulose content in food contributed to the increase in gut microbial diversity of plateau pikas (Fig. 1c–e).
Changes in gut microbial composition
The seasonal variation in relative abundance of gut microbial taxa (Fig. 2b,g) is often affected by changes in food nutrients driven by seasonal shifts (Carey et al. 2013; Smits et al. 2017; Kešnerová et al. 2020). Muribaculaceaeare (also known as S24‐7) is functionally distinct from neighboring families and versatile with respect to complex carbohydrate degradation (Lagkouvardos et al. 2019), and its higher abundance in autumn can help plateau pikas better deal with dietary polysaccharides. Lachnospiraceae, Ruminococcaceae, and Prevotellaceae are major components of fecal microbial communities in most herbivores and are vital for the digestion and fermentation of fiber such as cellulose and lignin. Thus, their relative abundances in hosts usually increase with the content of dietary fiber (Li et al. 2018; Dai et al. 2021; Tett et al. 2021). Meanwhile, these microbial taxa play an important role in the utilization rate of assimilated nutrients (Krajmalnik‐Brown et al. 2012; Tett et al. 2021), and could help hosts obtain energy from the relatively harsh environments of winter. In contrast to the gut microbiota of other plateau mammals such as the Tibetan wild ass (Equus kiang) (Gao et al. 2020) and yak (Gong et al. 2020), the abundance of Verrucomicrobiota in the intestines of the plateau pikas was very high, and had the highest relative abundance in summer. Akkermansia, the dominant resident genus of phylum Verrucomicrobiota, is well characterized to be an obligate host mucin degrader and usually be promoted by plant secondary compounds in food (Zhang et al. 2018b; Dong et al. 2021; Ren et al. 2021)—for example, berberine promoted Akkermansia growth via stimulating mucin secretion in colon of mice (Dong et al. 2021). In July, the diet of plateau pikas contains poisonous weeds, such as Oxytropis ochrocephala, which are often more abundant and are not eaten by livestock (Lu et al. 2014; Ren et al. 2021). These weeds have high contents of secondary compounds, explaining why the relative abundance of Verrucomicrobiota and Akkermansiaceae in summer was much higher than that in other seasons
Our results showed that the simplest co‐occurrence network of the plateau pikas’ gut microbiota was in winter (Fig. 3), as a new study has shown that positive network cohesion and complexity have a clear negative relationship with environmental stress (Hernandez et al. 2021). The plateau pika may face the same problem during winter and autumn, which results in harsh environments on the Qinghai−Tibet Plateau (Zu et al. 2018), causing greater gut bacteria competition than in summer and spring. In summer, plants grow luxuriantly; thus, there were more abundant food resources (Zhu et al. 2019), and plateau pika holds a more complex microbial network than winter. Spring and autumn can be regarded as transitional periods between winter and summer; although food supply is not nearly as abundant as in summer, changing environment can make microbial community more complex (Tang et al. 2021). Spring is a particularly important stage for seasonal environmental change in the plateau, as it is the key season for the transition of vegetation from the withering to the growing period (Zhu et al. 2019). Additionally, spring is an important period during which plateau pikas move from the non‐reproductive to the reproductive stage (Li et al. 1998; Qu et al. 2012). The physiological states of host may explain why the gut microbiota of the plateau pikas had the most complex network in spring.
Factors affecting gut microbial variation
Seasonal variation in gut microbiota of the plateau pikas was also supported by the CCA (Fig. 4b). This showed that air temperature, precipitation, and the contents of nutrients in vegetation significantly affected the microbial community, demonstrating that seasonal variation in animal gut microbiota is a complex process influenced by mixed factors (Bestion et al. 2017; Siles & Margesin 2017; Li et al. 2020). The direction of the vectors was roughly in accordance with the seasonal variation of the variables they represented. For example, higher crude protein and a climate of higher temperature and humidity made the gut microbiota transform into the summer type, while higher fiber made the gut microbiota transfer to the spring or winter type. The VPA showed that vegetative nutrition had the greatest influence on gut microbiota (Fig. 4c), demonstrating that changes in diet play an important role in driving wild mammal gut microbial communities (Orkin et al. 2019; Kešnerová et al. 2020). Many other studies also suggest that seasonal variation in the gut microbiota of wild herbivore species could be driven at least in part by dietary shifts, and some herbivores are highly dependent on gut microorganisms to digest and synthesize nutrients. Therefore, seasonal variations in gut microbiota of these species reflected insights regarding the resilience of herbivores and their intestinal ecosystem to environmental changes. The gut microbiota of animals can be affected by other factors such as reproductive and metabolic physiology, which also demonstrate changes on the time axis with seasonal variation (Jones et al. 2019; Wu et al. 2020). For example, the ACE and Chao1 index of dholes (Cuon alpinus) increased from estrus to non‐estrus with changes in gut microbial structure and function (Wu et al. 2020). Plateau pika has seasonal reproductive characteristics (Li et al. 1998) and these may affect their internal bacteria. Both hibernating and non‐hibernating animals will make adaptive changes in metabolic physiological characteristics for overwintering, which then may have an impact on their gut microbiota (Hou et al. 2021; Speakman et al. 2021). Additionally, dispersal patterns also play a role in influencing microbial communities, sometimes to an even greater extent than other selective pressures (Stothart et al. 2021), and could be further reflected in geographic, family, or host associations (Grant et al. 2019; Hildebrand et al. 2021). Plateau pikas have interspecific coprophagy (Speakman et al. 2021) and there were differences in convergence of their gut microbiota with those of the sympatric yak between winter and summer (Fu et al. 2021), indicating a seasonal variation in their gut microbial dispersal patterns corrected by hosts.
Gut microbial function and dietary nutrition
The winter and summer individuals were most separated in the PCoA using the Bray–Curtis distance metric of KOs (Fig. 5a), indicating that the difference in gut microbial function between these 2 seasons was the largest. This is similar to the trend of gut microbial function in other animals such as amphibians and mice (Maurice et al. 2015; Tong et al. 2020), as the difference in the external environment between winter and summer is usually the highest. Additionally, the relative abundance of genes involved in energy metabolism was the highest in winter, whereas the relative abundance of genes involved in amino acid metabolism was the highest in summer (Fig. 5b). This was also consistent with the seasonal variation in vegetation nutrients and the results of the CCA. Plateau pikas are non‐hibernating and need to maintain a body temperature of more than 39°C; therefore, the gut microbiota must adapt to different food conditions and high‐efficiency energy harvesting strategies to increase thermogenesis and maintain a high body temperature in alpine meadows (Wang et al. 2006; Arthur et al. 2008; Smith et al. 2019). Seasonal variation in microbial CAZymes was also supported by PCoA using the Bray–Curtis distance metric (Fig. 6a). These changes of CAZymes caused by diet and the habitat environment were also found in giant pandas (Ailuropoda melanoleuca) (Jin et al. 2021). More AAs can help plateau pikas face the diverse food conditions in summer, and higher abundance of CBMs and CEs are more suitable for unstable, low carbohydrate, and high fiber food conditions in spring (Willmann et al. 2019; Sun et al. 2020), so that they can get enough energy in the process of turning to a new breeding period. The correlation analysis (Fig. 7) further revealed the relationship between the different strategies of energy harvest and the gut microbiota of plateau pikas. With the change of seasons, the relative abundance of plateau pikas’ gut microbiota was affected by external environmental factors, causing the functional pathways and CAZymes to respond to these changes also. The changes of gut bacterial composition and enzyme system promote the degradation of food, which can provide more energy for the host, and are helpful for the host to improve the heat production capacity and maintain high body temperature. It is similar to the phenomenon where migratory birds usually change their gut microbial functions with the change of food conditions on their route (Cao et al. 2020), proving that gut microbiota changes with vegetative nutrition and serves the host's adaptability to the environment.
CONCLUSION
We found that the gut microbial compositions and functional profile of the plateau pikas in the 4 seasons were significantly different. The highest alpha diversity, the highest relative abundance of Firmicutes, and the simplest co‐occurrence network structure of gut microbiota occurred in winter, whereas the highest relative abundance of Proteobacteria and the most complex network structures were seen in spring. The highest relative abundance of Verrucomicrobiota and Spirochaetota were observed in summer and autumn, respectively. Air temperature, precipitation, and the contents of crude protein, crude fiber, and polysaccharide in vegetation had a significant driving effect on the seasonal changes in gut microbiota. Diet provided a higher contribution to microbial variation than climatic factors. Metagenomic analysis revealed that the functional pathways and CAZymes were also different among the seasons, and these functional variations were consistent with changes in dietary nutrition.
CONFLICT OF INTEREST
The authors declare no conflict of interest.
Supporting information
Table S1 Distribution of individuals with respect to sampling time
Table S2 The basic information of the 16 samples for metagenomic sequencing
Table S3 Differences in relative abundance of major phyla (top 6) among seasons
Table S4 Differences in relative abundance of major families (top 10) among seasons
Table S5 Network indices of gut microbiota in 4 seasons
Table S6 Spearman's correlations of environmental variables with gut bacterial community structure as determined by Mantel test
ACKNOWLEDGMENTS
We acknowledge the assistance of the Analysis and Measurement Center of the Northwest Institute of Plateau Biology. This work was supported by the Grant from CAS No.152111KYSB20160089; Qinghai innovation platform construction project by Chinese Academy of Sciences (2021‐ZJ‐Y01); the project of western light for interdisciplinary team; Science and Technology Department of Qinghai Province Major Project “Sanjiangyaun National Park Animal Genome Program”; and the Natural Science Foundation of Qinghai Province (2019‐ZJ‐7024).
Fan C, Zhang L, Jia S et al. (2022). Seasonal variations in the composition and functional profiles of gut microbiota reflect dietary changes in plateau pikas. Integrative Zoology 17, 379–95.
Chao Fan, Liangzhi Zhang, and Shangang Jia contributed equally to this work.
REFERENCES
- Amato KR, Leigh SR, Kent A et al. (2015). The gut microbiota appears to compensate for seasonal diet variation in the wild black howler monkey (Alouatta pigra). Microbial Ecology 69, 434–43. [DOI] [PubMed] [Google Scholar]
- Arthur AD, Pech RP, Davey C et al. (2008). Livestock grazing, plateau pikas and the conservation of avian biodiversity on the Tibetan plateau. Biological Conservation 141, 1972–81. [Google Scholar]
- Arumugam M, Raes J, Pelletier E et al. (2011). Enterotypes of the human gut microbiome. Nature 473, 174–80. [DOI] [PMC free article] [PubMed] [Google Scholar]
- Bestion E, Jacob S, Zinger L et al. (2017). Climate warming reduces gut microbiota diversity in a vertebrate ectotherm. Nature Ecology and Evolution 1, 161. [DOI] [PubMed] [Google Scholar]
- Brice KL, Trivedi P, Jeffries TC et al. (2019). The Koala (Phascolarctos cinereus) faecal microbiome differs with diet in a wild population. PeerJ 7, e6534. [DOI] [PMC free article] [PubMed] [Google Scholar]
- Buchfink B, Xie C, Huson DH (2015). Fast and sensitive protein alignment using DIAMOND. Nature Methods 12, 59–60. [DOI] [PubMed] [Google Scholar]
- Cao J, Hu Y, Liu F et al. (2020). Metagenomic analysis reveals the microbiome and resistome in migratory birds. Microbiome 8, 26. [DOI] [PMC free article] [PubMed] [Google Scholar]
- Carey HV, Walters WA, Knight R (2013). Seasonal restructuring of the ground squirrel gut microbiota over the annual hibernation cycle. American Journal of Physiology. Regulatory, Integrative and Comparative Physiology 304, R33–42. [DOI] [PMC free article] [PubMed] [Google Scholar]
- Chen S, Zhou Y, Chen Y et al. (2018). fastp: An ultra‐fast all‐in‐one FASTQ preprocessor. Bioinformatics 34, 884–90. [DOI] [PMC free article] [PubMed] [Google Scholar]
- Clarke SF, Murphy EF, O'Sullivan O et al. (2014). Exercise and associated dietary extremes impact on gut microbial diversity. Gut 63, 1913–20. [DOI] [PubMed] [Google Scholar]
- Dai QD, Ma J, Cao G et al. (2021). Comparative study of growth performance, nutrient digestibility, and ruminal and fecal bacterial community between yaks and cattle‐yaks raised by stall‐feeding. AMB Express 11, 98. [DOI] [PMC free article] [PubMed] [Google Scholar]
- Dill‐McFarland KA, Neil KL, Zeng A et al. (2014). Hibernation alters the diversity and composition of mucosa‐associated bacteria while enhancing antimicrobial defence in the gut of 13‐lined ground squirrels. Molecular Ecology 23, 4658–69. [DOI] [PubMed] [Google Scholar]
- Dixon P (2003). Vegan, a package of r functions for community ecology. Journal of Vegetation Science 14, 927–30. [Google Scholar]
- Dong CR, Yu JQ, Yang YA et al. (2021). Berberine, a potential prebiotic to indirectly promote Akkermansia growth through stimulating gut mucin secretion. Biomedicine & Pharmacotherapy 139, 111595. [DOI] [PubMed] [Google Scholar]
- Edgar RC (2013). UPARSE: Highly accurate OTU sequences from microbial amplicon reads. Nature Methods 10, 996–8. [DOI] [PubMed] [Google Scholar]
- Fragiadakis GK, Smits SA, Sonnenburg ED et al. (2019). Links between environment, diet, and the hunter‐gatherer microbiome. Gut Microbes 10, 216–27. [DOI] [PMC free article] [PubMed] [Google Scholar]
- Fu H, Zhang L, Fan C et al. (2021). Environment and host species identity shape gut microbiota diversity in sympatric herbivorous mammals. Microbial Biotechnology 14, 1300–15. [DOI] [PMC free article] [PubMed] [Google Scholar]
- Gao H, Chi X, Li G et al. (2020). Gut microbial diversity and stabilizing functions enhance the plateau adaptability of Tibetan wild ass (Equus kiang). Microbiologyopen 9, 1150–61. [DOI] [PMC free article] [PubMed] [Google Scholar]
- Glöckner FO, Yilmaz P, Quast C et al. (2017). 25 years of serving the community with ribosomal RNA gene reference databases and tools. Journal of Biotechnology 261, 169–76. [DOI] [PubMed] [Google Scholar]
- Gong G, Zhou S, Luo R et al. (2020). Metagenomic insights into the diversity of carbohydrate‐degrading enzymes in the yak fecal microbial community. BMC Microbiology 20, 302. [DOI] [PMC free article] [PubMed] [Google Scholar]
- Grant ET, Kyes RC, Kyes P et al. (2019). Fecal microbiota dysbiosis in macaques and humans within a shared environment. PLoS ONE 14, e0210679. [DOI] [PMC free article] [PubMed] [Google Scholar]
- Hernandez DJ, David AS, Menges ES et al. (2021). Environmental stress destabilizes microbial networks. The ISME Journal 15, 1722–34. [DOI] [PMC free article] [PubMed] [Google Scholar]
- Hildebrand F, Gossmann TI, Frioux C et al. (2021). Dispersal strategies shape persistence and evolution of human gut bacteria. Cell Host & Microbe 29, 1167–76. [DOI] [PMC free article] [PubMed] [Google Scholar]
- Hisada T, Endoh K, Kuriki K (2015). Inter‐ and intra‐individual variations in seasonal and daily stabilities of the human gut microbiota in Japanese. Archives of Microbiology 197, 919–34. [DOI] [PMC free article] [PubMed] [Google Scholar]
- Hou ZH, Dong YX, Shi FM et al. (2021). Seasonal shifts in cold tolerance and the composition of the gut microbiome of Dendroctonus valens LeConte occur concurrently. Forests 12, 888. [Google Scholar]
- Jacomy M, Venturini T, Heymann S et al. (2014). ForceAtlas2, a continuous graph layout algorithm for handy network visualization designed for the Gephi software. PLoS ONE 9, e98679. [DOI] [PMC free article] [PubMed] [Google Scholar]
- Jin L, Huang Y, Yang S et al. (2021). Diet, habitat environment and lifestyle conversion affect the gut microbiomes of giant pandas. Science of the Total Environment 770, 145316. [DOI] [PubMed] [Google Scholar]
- Jones GS, Feigelson HS, Falk RT et al. (2019). Mammographic breast density and its association with urinary estrogens and the fecal microbiota in postmenopausal women. PLoS ONE 14, e0216114. [DOI] [PMC free article] [PubMed] [Google Scholar]
- Karlsen C, Ottem KF, Brevik ØJ et al. (2017). The environmental and host‐associated bacterial microbiota of Arctic seawater‐farmed Atlantic salmon with ulcerative disorders. Journal of Fish Diseases 40, 1645–63. [DOI] [PubMed] [Google Scholar]
- Karlsson FH, Tremaroli V, Nookaew I et al. (2013). Gut metagenome in European women with normal, impaired and diabetic glucose control. Nature 498, 99–103. [DOI] [PubMed] [Google Scholar]
- Kešnerová L, Emery O, Troilo M et al. (2020). Gut microbiota structure differs between honeybees in winter and summer. The ISME Journal 14, 801–14. [DOI] [PMC free article] [PubMed] [Google Scholar]
- Khakisahneh S, Zhang XY, Nouri Z et al. (2020). Gut microbiota and host thermoregulation in response to ambient temperature fluctuations. mSystems 5, e00514‐20. [DOI] [PMC free article] [PubMed] [Google Scholar]
- Krajmalnik‐Brown R, Ilhan ZE, Kang DW et al. (2012). Effects of gut microbes on nutrient absorption and energy regulation. Nutrition in Clinical Practice 27, 201–14. [DOI] [PMC free article] [PubMed] [Google Scholar]
- Krzywinski M, Schein J, Birol I et al. (2009). Circos: An information aesthetic for comparative genomics. Genome Research 19, 1639–45. [DOI] [PMC free article] [PubMed] [Google Scholar]
- Lagkouvardos I, Lesker TR, Hitch TCA et al. (2019). Sequence and cultivation study of Muribaculaceae reveals novel species, host preference, and functional potential of this yet undescribed family. Microbiome 7, 28. [DOI] [PMC free article] [PubMed] [Google Scholar]
- Li DT, Wang P, Wang PP et al. (2018). Gut microbiota promotes production of aromatic metabolites through degradation of barley leaf fiber. The Journal of Nutritional Biochemistry 58, 49–58. [DOI] [PubMed] [Google Scholar]
- Li G, Yin B, Li J et al. (2020). Host‐microbiota interaction helps to explain the bottom‐up effects of climate change on a small rodent species. The ISME Journal 14, 1795–808. [DOI] [PMC free article] [PubMed] [Google Scholar]
- Li H, Qu J, Li T et al. (2016). Pika population density is associated with the composition and diversity of gut microbiota. Frontiers in Microbiology 7, 758. [DOI] [PMC free article] [PubMed] [Google Scholar]
- Li H, Zhou R, Zhu J et al. (2019). Environmental filtering increases with elevation for the assembly of gut microbiota in wild pikas. Microbial Biotechnology 12, 976–92. [DOI] [PMC free article] [PubMed] [Google Scholar]
- Li ZW, Sun RY, Du JZ (1998). Seasonal reproductive cycles in male plateau pika (Ochotona curzoniae). Acta Theriologica Sinica 18, 42–9. [Google Scholar]
- Liu P, Cheng A, Huang S et al. (2019). Variations in gut microbiota of Siberian flying squirrels correspond to seasonal phenological changes in their Hokkaido subarctic forest ecosystem. Microbial Ecology 78, 223–31. [DOI] [PubMed] [Google Scholar]
- Liu Z, Luo G, Du R et al. (2020). Effects of spaceflight on the composition and function of the human gut microbiota. Gut Microbes 11, 807–19. [DOI] [PMC free article] [PubMed] [Google Scholar]
- Lu H, Wang S, Wang W et al. (2014). Effect of swainsonine in Oxytropis kansuensis on Golgi α‐mannosidase II expression in the brain tissues of Sprague‐Dawley rats. Journal of Agricultural and Food Chemistry 62, 7407–12. [DOI] [PubMed] [Google Scholar]
- Magnúsdóttir S, Heinken A, Kutt L et al. (2017). Generation of genome‐scale metabolic reconstructions for 773 members of the human gut microbiota. Nature Biotechnology 35, 81–9. [DOI] [PubMed] [Google Scholar]
- Magoč T, Salzberg SL (2011). FLASH: Fast length adjustment of short reads to improve genome assemblies. Bioinformatics 27, 2957–63. [DOI] [PMC free article] [PubMed] [Google Scholar]
- Maurice CF, Knowles SCL, Ladau J et al. (2015). Marked seasonal variation in the wild mouse gut microbiota. The ISME Journal 9, 2423–34. [DOI] [PMC free article] [PubMed] [Google Scholar]
- Muegge BD, Kuczynski J, Knights D et al. (2011). Diet drives convergence in gut microbiome functions across mammalian phylogeny and within humans. Science 332, 970–4. [DOI] [PMC free article] [PubMed] [Google Scholar]
- Orkin JD, Campos FA, Myers MS et al. (2019). Seasonality of the gut microbiota of free‐ranging white‐faced capuchins in a tropical dry forest. The ISME Journal 13, 183–96. [DOI] [PMC free article] [PubMed] [Google Scholar]
- Qu J, Liu M, Yang M et al. (2012). Reproduction of plateau pika (Ochotona curzoniae) on the Qinghai–Tibetan plateau. European Journal of Wildlife Research 58, 269–77. [Google Scholar]
- Ren S, Fan C, Zhang L et al. (2021). The plant secondary compound swainsonine reshapes gut microbiota in plateau pikas (Ochotona curzoniae). Applied Microbiology and Biotechnology 105, 6419–33. [DOI] [PMC free article] [PubMed] [Google Scholar]
- Pech RP, Arthur AD, Zhang Y et al. (2007). Population dynamics and responses to management of plateau pikas Ochotona curzoniae . Journal of Applied Ecology 44, 615–24. [Google Scholar]
- Siles JA, Margesin R (2017). Seasonal soil microbial responses are limited to changes in functionality at two Alpine forest sites differing in altitude and vegetation. Scientific Reports 7, 2204. [DOI] [PMC free article] [PubMed] [Google Scholar]
- Smith AT, Badingqiuying, Wilson MC et al. (2019). Functional‐trait ecology of the plateau pika Ochotona curzoniae in the Qinghai–Tibetan Plateau ecosystem. Integrative Zoology 14, 87–103. [DOI] [PubMed] [Google Scholar]
- Smits SA, Leach J, Sonnenburg ED et al. (2017). Seasonal cycling in the gut microbiome of the Hadza hunter‐gatherers of Tanzania. Science 357, 802–6. [DOI] [PMC free article] [PubMed] [Google Scholar]
- Speakman JR, Chi Q, Ołdakowski Ł et al. (2021). Surviving winter on the Qinghai–Tibetan Plateau: Pikas suppress energy demands and exploit yak feces to survive winter. PNAS 118, e2100707118. [DOI] [PMC free article] [PubMed] [Google Scholar]
- Stothart MR, Greuel RJ, Gavriliuc S et al. (2021). Bacterial dispersal and drift drive microbiome diversity patterns within a population of feral hindgut fermenters. Molecular Ecology 30, 555–71 [DOI] [PubMed] [Google Scholar]
- Sun J, Liao X, D'Souza AW et al. (2020). Environmental remodeling of human gut microbiota and antibiotic resistome in livestock farms. Nature Communications 11, 1427. [DOI] [PMC free article] [PubMed] [Google Scholar]
- Tang H, Zhang N, Ni H et al. (2021). Increasing environmental filtering of diazotrophic communities with a decade of latitudinal soil transplantation. Soil Biology and Biochemistry 154, 108–19. [Google Scholar]
- Tett A, Pasolli E, Masetti G et al. (2021). Prevotella diversity, niches and interactions with the human host. Nature Reviews Microbiology 19, 585–99. [DOI] [PMC free article] [PubMed] [Google Scholar]
- Tong Q, Hu ZF, Du XP et al. (2020). Effects of seasonal hibernation on the similarities between the skin microbiota and gut microbiota of an Amphibian (Rana dybowskii). Microbial Ecology 79, 898–909. [DOI] [PubMed] [Google Scholar]
- Wang J, Zhang Y, Wang D (2006). Seasonal thermogenesis and body mass regulation in plateau pikas (Ochotona curzoniae). Oecologia 149, 373–82. [DOI] [PubMed] [Google Scholar]
- Wang W, Hu H, Zijlstra RT et al. (2019). Metagenomic reconstructions of gut microbial metabolism in weanling pigs. Microbiome 7, 48. [DOI] [PMC free article] [PubMed] [Google Scholar]
- Wang Y, Zhou R, Yu Q et al. (2020). Gut microbiome adaptation to extreme cold winter in wild plateau pika (Ochotona curzoniae) on the Qinghai–Tibet Plateau. FEMS Microbiology Letters 367, fnaa134. [DOI] [PubMed] [Google Scholar]
- Wang Z, Zeng J, Han Y et al. (1980). Energy dynamics of some small mammals in an alpine meadow ecosystem: I. digestibility and assimilation of natural foods on the mouse hare and the mole rat in an alpine meadow ecosystem. Acta Zoologica Sinica 26,184–95. [Google Scholar]
- Werner JJ, Knights D, Garcia ML et al. (2011). Bacterial community structures are unique and resilient in full‐scale bioenergy systems. PNAS 108, 4158–63. [DOI] [PMC free article] [PubMed] [Google Scholar]
- Willmann M, Vehreschild MJGT, Biehl LM et al. (2019). Distinct impact of antibiotics on the gut microbiome and resistome: A longitudinal multicenter cohort study. BMC Biology 17, 76. [DOI] [PMC free article] [PubMed] [Google Scholar]
- Wu XY, Shang YQ, Wei QG et al. (2020). Gut microbiota in dholes during estrus. Frontiers in Microbiology 11, 575731. [DOI] [PMC free article] [PubMed] [Google Scholar]
- Xiao G, Liu S, Xiao Y et al. (2019). Seasonal changes in gut microbiota diversity and composition in the greater horseshoe bat. Frontiers in Microbiology 10, 2247. [DOI] [PMC free article] [PubMed] [Google Scholar]
- Zhang NN, Guo WH, Hu H et al. (2018b). Effect of a polyphenol‐rich canarium album extract on the composition of the gut microbiota of mice fed a high‐fat diet. Molecules 23, 2188. [DOI] [PMC free article] [PubMed] [Google Scholar]
- Zhang XY, Sukhchuluun G, Bo TB et al. (2018a). Huddling remodels gut microbiota to reduce energy requirements in a small mammal species during cold exposure. Microbiome 6, 103. [DOI] [PMC free article] [PubMed] [Google Scholar]
- Zhu W, Zhang D, Jiang N et al. (2019). Spatiotemporal variations of the start of thermal growing season for grassland on the Qinghai‐Tibetan Plateau during 1961–2014. International Journal of Biometeorology 63, 639–47. [DOI] [PubMed] [Google Scholar]
- Zu J, Zhang Y, Huang K et al. (2018). Biological and climate factors co‐regulated spatial‐temporal dynamics of vegetation autumn phenology on the Tibetan Plateau. International Journal of Applied Earth Observation and Geoinformation 69, 198–205. [Google Scholar]
Associated Data
This section collects any data citations, data availability statements, or supplementary materials included in this article.
Supplementary Materials
Table S1 Distribution of individuals with respect to sampling time
Table S2 The basic information of the 16 samples for metagenomic sequencing
Table S3 Differences in relative abundance of major phyla (top 6) among seasons
Table S4 Differences in relative abundance of major families (top 10) among seasons
Table S5 Network indices of gut microbiota in 4 seasons
Table S6 Spearman's correlations of environmental variables with gut bacterial community structure as determined by Mantel test