

Abstract
Background:
Sleep deprivation (SD) is a biological stress condition for the brain, and the pathogenesis of SD is closely related to elevated oxidative stress, mitochondrial dysfunction, a major cause of neurodegeneration. This oxidative stress-mediated cell death is attributed to rise in calcium ion influx which further excites or alters the neurotransmitters level by activating neuronal nitric oxide (NO) synthase (nNOS) release of NO in mouse SD model. This study indicates that the nitrergic neurons are possible therapeutic targets for the amelioration of SD-induced cognitive dysfunction and behavioral alterations.
Purpose:
SD is considered as a risk factor for various neurodegenerative diseases. SD leads to biochemical, behavioral, and neurochemical alterations in animals. This study was designed to explore the possible involvement of a nitrergic neuron system in six days SD-induced morphological and neurodegenerative changes in mice.
Methods:
Using nNOS immunohistochemistry, we have investigated the effects of SD on nNOS positive neurons. Immunohistochemical study for the distribution of nNOS positive neuronal cell bodies was carried out in the hippocampus, prefrontal cortex (PFC), and amygdaloid nuclei of mice brain.
Results:
Sleep-deprived animals showed a significantly increased number of nNOS positive neurons and altered neuronal cytomorphology as compared with the control group.
Conclusion:
These results indicate that total SD may induce morphological changes in nNOS positive neurons in the brain, thus increasing NO synthesis, which is implicated in SD-induced neuronal cell death.
Keywords: Sleep deprivation, Neuronal nitric oxide synthase, Nitric oxide, Neurotoxicity, Neurodegeneration
Introduction
Sleep deprivation (SD) is a common problem across the globe. Various hypotheses and findings suggest that insufficient sleep may compromise neuronal functions. Sleep loss not only increases the neurodegenerative processes but also compromises natural neuroprotection in the brain, possibly by inducing excitatory pathways. Previous studies showed the expression of certain molecules, such as Ca2+/calmodulin-dependent protein kinase (CAMKII) and calcineurin that take part in calcium-dependent neurodegenerative and neuroprotective pathways, is altered in sleep-deprived animals.1, 2 The production of NO in response to excitatory stimuli requires an intracellular Ca2+ ion influx, which is a calmodulin-dependent process in intact neurons. 3 The SD activates various oxidative stress pathways leading to loss of membrane integrity, rise in intracellular calcium, elevated free radical production, and progressive proteolysis. 4 This leads to nitric oxide (NO) synthase (NOS) activation, subsequent enhanced NO production which combines with superoxide to form peroxynitrite radicals, implicated in cell death.5, 6 Excitatory effect of NO on the sleep/wake pattern in the brain, may primarily affect the neuronal structures regulating wakefulness and indirectly the sleep. 7 NO serves as a neurotransmitter when produced by neurons and as a component of the defense systems when synthesized by immune or glial cells and is cytotoxic in excess. 8 When an excessive amount of NO is generated, by the inducible form of NO synthase, leads to cytotoxic changes in cells. 9 NO is implicated in the pathophysiology of Parkinson’s, Alzheimer’s, Huntington’s, brain ischemia, and epilepsy. 10 This study aimed to assess SD-induced changes on the nitrergic neurons in the hippocampus, prefrontal cortex (PFC), and amygdala (Amg) regions of the mice brain.
Methods
Animals
Swiss albino adult, male mice weighing 25±5 g were used for this study. All the mice were fed with standard pellet diet and given water ad libitum. Animals were housed in polyurethane cages and maintained under standard laboratory conditions. All experiments and protocols were approved by IAEC (Reg. No. 973/ac/06/CPCSEA).
Animals were divided into two groups consisting of six animals in each group. Group A, control, allowed normal sleep and Group B, sleep deprived, deprived of sleep for six days.
Sleep Deprivation Protocol
SD was induced by the flowerpot/single platform technique, the classical and commonly employed method in SD studies. 11 Mice were placed on top of an upside-down flowerpot, which was placed in a bucket of water. The system allows nonrapid eye movement (NREM) sleep but prevents rapid eye movement (REM) sleep. During paradoxical or REM sleep, because of muscle atonia, mice fall off the platform and are awakened and then climb back up and reenter into NREM sleep. Because muscle tone is maintained during the NERM sleep, therefore, animals can sleep on top of the flower pot/platform. The flowerpot technique primarily targets REM sleep but a substantial loss of NREM sleep is also reported.12, 13
Along with the flowerpot method, gentle handling (GH) procedure was also used for total SD for six days. The six days SD model is the most accepted system for total SD with REM SD with significant consequences. Typical sleep behavior symptoms such as cornering, curling, eye closing, and so on. were continuously observed, and GH was applied when the animals attempted to sleep. GH requires experimenter intervention to keep the animal awake. Gentle tapping the cage or physical stimulation of animals using a soft brush or by hands disrupts the sleep. GH effectively suppresses nearly all sleep activity in rats and mice and can reduce NREM sleep by 92% and REM sleep by 100%.14, 15 During the experiment, mice had free access to food and water.
Immunohistochemical Study of Nitrergic Neurons
Animals were transcardially perfused with 4% paraformaldehyde in 0.1 M phosphate buffer (pH 7.4). The brains were dissected out and postfixed in the same fixative. After equilibrating the brains in 30% sucrose, coronal sections of 40 µ (bregma −1.8 to −5.8) were cut through entire hippocampus using vibratome (VT1000S; Leica).
Immunohistochemical Staining
NO-mediated neurotoxicity was assessed using the nNOS marker, which is a family of the enzyme catalyzing the production of NO from L-arginine. Sections were incubated in H2O2, blocked in blocking solution (containing 0.1% Triton X 100, 2% BSA, and 2% normal serum), and then incubated in primary antibody (monoclonal anti nNOS antibody, diluted 1:600, Millipore Corporation, USA) for 24 h at 4°C. Sections were rinsed in phosphate buffer saline (PBS) and subsequently incubated with biotinylated goat antirabbit (GAR) secondary antibody (10 mg/mL, Vector laboratories, USA) for 2 h, then incubated with avidin-biotinylated-HRP conjugate and developed in diaminobenzidine tetrahydrochloride (DAB). Sections were dehydrated using alcohol series and mounted in DPX. Photomicrographs were taken using an Olympus BX51 microscope and analyzed using Image PRO software.
Cell Counting
Brain areas (hippocampus, PFC, and Amg) selected for our study are the major areas for the action of NO in sleep facilitation. Areas were identified using the brain atlas and slides were examined under Olympus BX51 microscope. Images were captured and nNOS positive cell count was performed using the Image J. nNOS neurons in every tenth serial section of the forebrain region (PFC, hippocampus, and Amg) of each control, and sleep-deprived mouse was screened. In order to obtain an unbiased estimate of cell numbers, Abercrombie’s correction factor was applied to total cell count, which compensates for the over counting of sectioned profiles, using the equation:
P = A* [M / (M + L)],
where P is the corrected value, A is the raw density measure, M is the thickness of the section (in micrometers), and L is the average diameter of cell bodies along the axis perpendicular to the plane of section. 16
Morphological Variables
In addition to cell numbers, following morphological variables describing the soma were also extracted using the Image-J.
| S. No. | Morphological Variable Name | Abbreviation | Formula |
| 1 | Somatic perimeter (µm) | SP | Perimeter of the soma |
| 2 | Somatic area (µm2) | SA | Area of soma |
| 3 | Somatic aspect ratio | SAR | Max diameter of soma/min diameter of soma |
| 4 | Somatic compactness | SCom | [((4/ύ)*area)1/2]/max diameter |
| 5 | Somatic form factor | SFF | (4ύ*area)/(perimeter2) |
| 6 | Somatic roundness | SRo | (4*area)/(ύ* max diameter2) |
Statistical Analysis
Descriptive statistics were applied to all groups, results are expressed as the mean ± SEM. Data comparisons were carried out using one-way analysis of variance (ANOVA) and differences among groups were evaluated using the two-tailed paired t tests. ANOVA was followed by Tukey’s test. The level of significance for all tests was P < .05. The tests were conducted using SPSS and the results were plotted in Excel.
Results
nNOS Enzyme Activity (Qualitative Analysis)
nNOS immunohistochemistry was done in different brain areas. nNOS positive neurons are found in the cerebral cortex, the hippocampus (mainly the CA1 and CA3 layers), and the dentate gyrus (in granule cells) 17 and intensely stained neurons have been also observed in the Amg. 10
Hippocampus
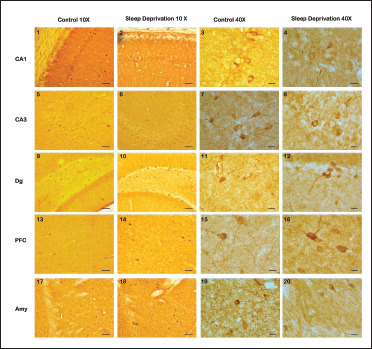
In hippocampus, nNOS reactivity was seen in CA1, CA3, and DG sub-regions of animals. The nNOS immunohistochemistry revealed a drastic increment in nNOS positive cells with intensely stained neuron cell bodies and fibers in SD group compared with the control where few and two types of nNOS positive neurons were recognizable; darkly stained cell bodies with clearly visible dendrites and diffusely stained cell bodies without visible dendrites. Few nNOS positive cells were also observed in the hilus and granular cell layer within the dentate gyrus. Scattered neuron cell bodies were also observed in the CA1 area and the CA3 area of the hippocampus (Figure 1, parts 1–8). In the dentate gyrus, bipolar and tripolar cell bodies and fibers were detected in the molecular and granular layer (Figure 1, parts 9–12).
Figure 1. Representative Photomicrographs Showing Immunohistochemical Staining of nNOS Positive Neurons in Different Brain Regions of Control and SD Mice. (1–4): CA1 Subregion of Hippocampus in Control (1, 3) and Sleep-Deprived Mice (2, 4; at 10× and 40× Magnifications). (5–8): CA3 Subregion of Hippocampus in Control (1, 3) and Sleep-Deprived Mice (2, 4; at 10× and 40× Magnifications). (9–12): PFC Region of Brain in Control (13, 15) and Sleep-Deprived Mice (14, 16; at 10× and 40× Magnifications). (17–20): Amygdaloid Nuclei (BMA and Cem) of Brain in Control and Sleep-Deprived Mice (at 10× and 40× Magnifications).
Prefrontal Cortex (PFC)
The frontal lobe of cerebral cortex, that is, PFC showed less number of stained cells with the low reactive intensity of nNOS positive neurons and very few fibers were observed in control brain. In SD group animal’s brains, the number of nNOS stained neuronal cells was increased and increase in the intensity of stained neuronal cell bodies and fibers were also observed (Figure 1, parts 13–16).
Amygdala (Amg)
In the amygdaloidal area, darkly stained fibers were observed. In control brain, Amg region as well, few nNOS positive cells were observed. In the basal amygdalate nucleus (BMA) and central amygdalate nucleus (CeM) of the Amg region in comparison with the control group, SD group showed more, intensely stained nNOS positive cells, showed the higher activity of NO neurotransmitter. A dense network of nNOS positive fibers and many medium-sized darkly stained monopolar fusiform, bipolar oval-shaped, and tripolar pyramidal-shaped cells were observed, especially in basomedial amygdaloidal nucleus (BMA) of the anterior AMg central AMg nucleus (CeM) in the SD brain (Figure 1, parts 17–20).
Neuronal Cell Count
nNOS positive neuron cell bodies were counted in specific areas of the cerebral cortex (PFC region), subregions of the hippocampus (CA1, CA3, and DG), and various nuclei of amygdale region (BMA and CeM) of the control and the sleep-deprived group. Quantitative analysis of nNOS positive neuronal cells in the hippocampus, PFC, and AMg (Figure 2, Table 1) shows that the number of nNOS positive neurons has been increased significantly in the sleep-deprived group in comparison with control and the values are highly significant.
Figure 2. Quantitative Analysis of nNOS Positive Neuronal Cells in Different Brain Areas of Mice Brain of Control and Sleep-Deprived Groups.
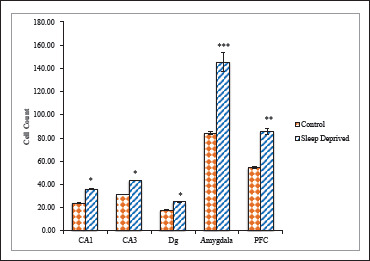
Notes. Values depicted as Mean ± SEM; *(P < .01), **(P < .001), ***(P < .0001).
Table 1. Effect of Sleep Deprivation on nNOS Activity in Different Brain Regions, P < .0001 Shows High Significance and P < .001, P < .01 Show Less Significance Respectively.
| Brain Areas | Control | Sleep Deprived | |
| Hippocampus | CA1 | 24.0 ± 0.57 | 36.0 ± 0.6; P < .01 |
| CA3 | 31.0 ± 0.6 | 43.33 ± 0.88; P < .01 | |
| Dg | 17.67 ± 1.45 | 25.0 ± 1.15; P < .01 | |
| Prefrontal Cortex (PFC) | 54.33 ± 0.88 | 85.67 ± 2.02; P < .001 | |
| Amygdala | 84.23 ± 1.45 | 145.33 ± 8.14; P < .0001 | |
In all the areas studied, a significant increase in the number of nNOS positive cell bodies was observed in the SD group compared with the control. Cells were higher in number in CA3 in comparison to CA1 and DG sub regions of hippocampus (Figure 2). The Amg, however, had a more significant increase.
Morphological Variables
There were significant effects of SD on hippocampal CA1, CA3, Dg, Amg, and PFC neuronal morphology compared with control (S-2).
Size as a neuronal somatic feature could be analyzed based on somatic area (SA) and somatic perimeter (SP). For both parameters, neurons in SD group exhibited significantly lower values compared with neurons in control group (Figures 3 and 4).
Figure 3. Cell Area of nNOS Positive Neuronal Cells in Different Brain Areas of Mice Brain of Control and Sleep-Deprived Groups.
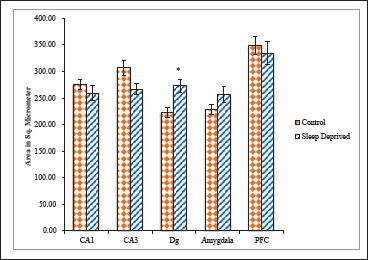
Notes. Values depicted as Mean ± SEM; *(P < .01).
Figure 4. Cell Perimeter of nNOS Positive Neuronal Cells in Different Brain Areas of Mice Brain of Control and Sleep-Deprived Groups.
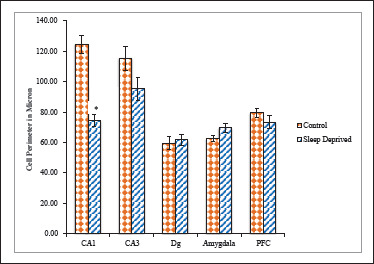
Notes. Values depicted as Mean ± SEM; *(P < .01).
SA of CA1 neurons in SD group was 258.79 ± 14.59 µm2 while it was 275.42 ± 10.24 µm2 for control group. SD group showed significantly lesser SP 74.36 ± 3.77 µm whereas it was 124.57 ± 5.82 µm for control group CA1 neurons. SA of CA3 neurons in SD group was 266.40 ± 10.72 µm2 while it was 306.73 ± 13.96 µm2 for control group. SD group showed lesser SP 95.13 ± 7.58 µm whereas it was 115.44 ± 7.90 µm for control group CA3 neurons. SA of Dg neurons in SD group was significantly higher 272.94 ± 12.06 µm2 while it was 222.75 ± 9.71 µm2 for control group. SD group showed higher SP 61.63 ± 3.67 µm whereas it was 59.61 ± 3.99 µm for control group Dg neurons. SA of Amg neurons in SD group was higher 255.78 ± 15.71 µm2 while it was 228.28 ± 9.80 µm2 for control group. SD group showed higher SP 69.62 ± 3.03 µm whereas it was 62.66 ± 1.81 µm for control group Dg neurons. SA of PFC neurons in SD group was 334.71 ± 20.90 µm2 while it was 348.95 ± 17.62 µm2 for control group. SD group showed lesser SP 73.28 ± 4.29 µm whereas it was 79.49 ± 3.12 µm for control group PFC neurons.
Because larger somas might indicate greater cellular information integration; consequently, decreased amount of information processing by CA1, CA3 pyramidal cells could result in decreased generation of hippocampal-dependent memories.
Table 2. Effect of Sleep Deprivation on nNOS Activity in Different Brain Regions.
| Morphological Variable | Somatic Area (µm2) | Somatic Perimeter (µm) | Somatic Aspect Ratio | Somatic Form Factor | Somatic Round Ness | Somatic Compactness | ||||||
| Brain Area | Control | Sleep Deprived | Control | Sleep Deprived | Control | Sleep Deprived | Control | Sleep Deprived | Control | Sleep Deprived | Control | Sleep Deprived |
| CA1 | 275.42 ± 10.25 | 258.79 ± 14.60 | 124.57 ± 5.82 | 74.36 ± 3.77* | 1.52 ± 0.09 | 1.86 ± 0.07 | 0.28±0.05 | 0.88 ± 0.24* | 1.05 ± 0.15 | 0.58 ± 0.05* | 0.97 ± 0.06 | 0.74 ± 0.03* |
| CA3 | 306.73 ± 13.96 | 266.40 ± 10.72 | 115.44 ± 7.91 | 95.14 ± 7.58 | 1.38 ± 0.06 | 1.47 ± 0.17 | 0.48±0.08 | 0.80 ± 0.30 | 1.22 ± 0.10 | 0.39 ± 0.05* | 1.07 ± 0.05 | 0.60 ± 0.04* |
| Dg | 222.76 ± 9.72 | 272.94 ± 12.06* | 59.61 ± 4.00 | 61.63 ± 3.67 | 1.92 ± 0.11 | 1.19 ± 0.04* | 1.52±0.60 | 1.14 ± 0.15 | 0.46 ± 0.04 | 1.17 ± 0.09* | 0.66 ± 0.03 | 1.06 ± 0.04* |
| Amg | 228.29 ± 9.80 | 255.79 ± 15.02 | 62.67 ± 1.81 | 69.62 ± 3.04 | 1.23 ± 0.09 | 1.91 ± 0.21* | 0.78 ± 0.06 | 0.67 ± 0.02 | 1.60 ± 0.47 | 0.80 ± 0.05 | 1.13 ± 0.11 | 0.88 ± 0.03 |
| PFC | 348.96 ± 17.62 | 334.71 ± 20.91 | 79.49 ± 3.12 | 73.29 ± 4.29 | 2.17 ± 0.15 | 1.92 ± 0.12 | 0.72±0.03 | 0.85 ± 0.04 | 0.63 ± 0.09 | 0.46 ± 0.04 | 0.75 ± 0.05 | 0.66 ± 0.03 |
Note: Differences between groups considered significant when P < .05
* Differences between groups considered significant when P < .01
Morphological shapes of cell bodies were analyzed based on somatic aspect ratio (SAR), somatic form factor (SFF), somatic roundness (SRo), and somatic compactness (SCom). SD group exhibited significantly higher SAR (1.85 ± 0.07) than control group (1.52 ± 0.08). In other hippocampal sub region, CA3 SD group showed higher SAR (1.46 ± 0.17) in comparison to control (1.38 ± 0.06). Whereas in Dg sub region of SD group exhibited significantly lower SAR (1.19 ± 0.04) than control group (1.91 ± 0.10). The SD group showed significantly higher SAR (1.90 ± 0.21) than control group (1.22 ± 0.08) in Amg area of brain. PFC region of SD group showed lower SAR (1.92 ± 0.11) in comparison to control (2.17 ± 0.14; Figure 5).
Figure 5. Somatic Aspect Ratio of nNOS Positive Neuronal Cells in Different Brain Areas of Mice Brain of Control and Sleep-Deprived Groups.
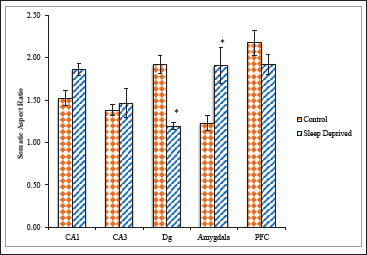
Notes. Values depicted as Mean ± SEM; *(P < .01).
Likewise, SFF and SRo emphasize the roundness of the soma, with a value further from 1.00 indicates a less circular soma. However, value for SRo could distinguish pyramidal soma from round ones, while SFF only distinguishes circular-shaped neurons from irregular shaped ones. The SD group showed a significantly higher SFF in CA1, CA3 sub regions of hippocampus (0.87 ± 0.23; 0.79 ± 0.30), respectively, further nearby to the value 1.00 compared with control group (0.27 ± 0.04; 0.47 ± 0.08). Whereas in Dg sub region of hippocampus lesser SFF (1.13 ± 0.14) was reported compared with control group (1.52 ± 0.59). The AMg region of SD group also exhibited lower SFF (0.67 ± 0.02) compared with control group (0.78 ± 0.06). The SD group showed a significantly higher SFF in PFC (0.84 ± 0.04), further nearby to the value 1.00 compared with control group (0.71 ± 0.02; Figure 6).
Figure 6. Somatic Form Factor of nNOS Positive Neuronal Cells in Different Brain Areas of Mice Brain of Control and Sleep-Deprived Groups.
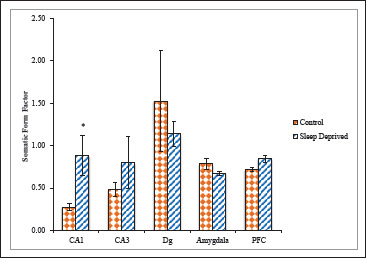
Notes. Values depicted as Mean ± SEM; *(P < .01).
In comparison to the value of SRo of control group (1.05 ± 0.14; 1.21 ± 0.10), the value for SD group (0.57 ± 0.04; 0.39 ± 0.04) was significantly lower in CA1 and CA3 sub regions of hippocampus and further not away from 1.00. The results demonstrated greater roundness of SD group, hence, possibly reflecting no better retention of pyramidal shape of CA1, CA3 neuronal somas. Whereas in Dg sub region of hippocampus the SRo value of SD group was significantly higher (1.16 ± 0.08) compared with control group (0.46 ± 0.04). The Amg and PFC areas of brain exhibited lower SRo values (0.79 ± 0.04; 0.46 ± 0.04), respectively, in comparisons to control (1.59 ± 0.46; 0.63 ± 0.08; Figure 7).
Figure 7. Roundness of nNOS Positive Neuronal Cells in Different Brain Areas of Mice Brain of Control and Sleep-Deprived Groups.
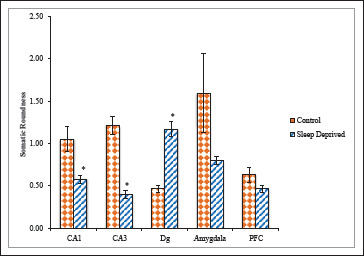
Notes. Values depicted as Mean ± SEM; *(P < .01).
The SD group showed significantly reduced SCom in CA1 and CA3 (0.74 ± 0.02; 0.59 ± 0.03), compared with control groups (0.96 ± 0.06; 1.07 ± 0.04). Hence hippocampal CA1, CA3 neurons in SD group did not retain their pyramidal soma shape than those in control groups. Therefore, findings from the selected measurements of the CA1, CA3 hippocampal neuronal soma morphological characteristics indicated potential neurodegenerative effect of SD. Whereas in Dg area significantly increased SCom (1.05 ± 0.03) compared with control groups (0.66 ± 0.02) was reported. The SD group also displayed significantly reduced SCom in AMg and PFC (0.88 ± 0.02; 0.66 ± 0.03) regions, compared with control groups (1.12 ± 0.10; 0.75 ± 0.04) respectively, (Figure 8).
Figure 8. Compactness of nNOS Positive Neuronal Cells in Different Brain Areas of Mice Brain of Control and Sleep-Deprived Groups.
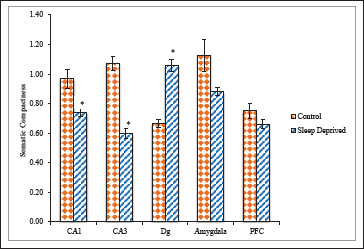
Notes. Values depicted as Mean ± SEM; *(P < .01).
Discussion
NO affects almost every physiological process, including the regulation of sleep mainly in REM sleep (REMS) regulation. NO derived from the neuronal NOS isoform (nNOS) is confirmed as a powerful sleep facilitating agent. 18 It is known that NO acts at the central nervous system as neuromodulatory neurotransmitter and is an intracellular multifunctional molecule involved in both physiological and neurodegenerative processes of the CNS.19, 20 In this investigation, we demonstrated that total SD of six days increased the number of nNOS positive neurons in all examined areas CA1, CA3, and DG of the hippocampus, as well as in PFC and few amygdaloid nuclei (BMA and CeM) in SD mice brain. This enhanced activation of nNOS results in enhanced release of NO neurotransmitter, which ultimately leads to cellular toxicity, the important factor for neurodegeneration or massive neuronal loss because of SD. Whereas another study from Hsu et al. (2003) contradicted our present findings that TSD of five days inhibits the NADPH-d and NOS reactivities in hippocampus CA1, CA2, CA3, and Dg areas in rat. 21
One important function of sleep is to relieve the brain from cellular stress associated with SD. Earlier it has been showed that prolonged SD may result in the harmful cellular consequences from excitotoxicity and oxidative mechanisms which sensitize the brain toward neurodegeneration.22, 23 SD result in oxidative damage such as increased lipid peroxidation, nitrite level, and depletion of catalase activity, and reduced glutathione levels in the mouse brain, and also result in anxiety-like behavior. 24 The accumulation of NO leads to an increase in reactive oxidative species form peroxynitrite molecule that serves as a mediator of neurodegeneration leading to cell apoptosis. 4
Another study by Chanana and Kumar suggested that the complex interaction between reactive oxygen species (ROS) and NO produces generation of reactive nitrogen species (RNS) which creates oxidative stress and brings about neuronal DNA damage and neurodegeneration because of 72 h of SD. 25 Earlier study, conducted in our laboratory also concluded that total SD of six days cause neuronal neurodegeneration in the PFC, AMg (BMA and CeM), and hippocampal sub regions (CA1, CA3, CA4, and Dg). 26
The study from Wu et al. supported our results that, in different brain regions of Sprague-Dawley rats after SD-induced using flowerpot technique, NO level, and NOS activity were increased in frontal cortex and hippocampus after SD compared with normal control and tank control. They concluded that nNOS/NO plays an important role in learning and memory and in modulation of sleep. 27 nNOS production is a calmodulin-dependent process and its activity is dependent on intracellular calcium ions concentration, therefore, it must be preceded by elevation of intracellular Ca2+ concentration in neurons further leading to the activation of nNOS may eventually lead to the increased excitability. 21
An earlier study reported that SD influences frontal executive functions regulated by PFC, emphasizes the sensitivity of the PFC to sleep. 28 Kalinchuk et al. (2006) reported increased NO generation in the basal forebrain during SD. High production of NO is an important indicator of neurodegeneration. Increased NO concentration raises intracellular Ca2+ and Na+ levels and might be responsible for mitochondrial dysfunction. 29 In another study doubling of the basal forebrain concentration of nitrite and nitrate (NO2 and NO3; NOx), was observed after 11 h SD. These studies are in agreement with our study that SD for six days gradually increases NO level as indicated by the increase of nNOS positive neurons in PFC of SD mice, which plays an important role in cognition including control of attention and working memory. 30
AMg, the “emotional brain” is responsible for processing of mood and emotion, might be more affected by SD. 31 In an earlier study it has been shown that SD of six days leads to neuronal loss and cell death in the AMg, thus affects not only mood and emotions but is also responsible for various behavioral changes such as anxiety, depression, and so on. 25 In present investigation we observed enhanced nNOS activity in two nuclei of AMg region namely BMA and CeM show significant increment in nNOS positive neurons or NO reactivity. Hence proves that SD leads to bias cognitive processing and poor judgment as well as anxiety, which are mainly regulated by AMg.
The pilot studies from Majumdar and Mallick (2005) stated that there was no significant change in neuronal sizes was observed after four days of REMSD as compared with free-moving control (FMC) rats, however, significant changes were observed only after six and ten days of deprivation. 32 This study supports our findings that total SD which includes REM SD resulted in change in neuronal size, shape in different brain areas. Because change in cellular size is an initial step toward degeneration, we hypothesized that total SD would increase degeneration and our preliminary results support the contention. 25 In our opinion, this study is of great significance that this is the first study conducted on a large number of nitrergic neurons with adequate appropriate controls in which SD was observed to affect neuronal morphology and structure in adult animals.
As mentioned above this study concludes that the increased nNOS activity and altered neurotransmitter NO levels lead to oxidative stress in brain which plays a pivotal role in cognitive impairment, behavioral alterations regulated by hippocampus, PFC, and AMg, respectively. This SD-induced oxidative stress ultimately results in neurodegeneration. This implicates consideration of NO as a tentative therapeutic target.
Declaration of Conflicting Interests: The authors declared no potential conflicts of interest with respect to the research, authorship, and/or publication of this article.
Funding: The authors disclosed receipt of the following financial support for the research, authorship, and/or publication of this article: Authors wish to thank UGC-BSR (F.7-124/2007) for financial assistance.
ORCID iDs: Reena Chittora https://orcid.org/0000-0002-9757-8831
Sunil Dutt Shukla https://orcid.org/0000-0002-4467-3106
Maheep Bhatnagar https://orcid.org/0000-0002-9757-8831
Authors’ Contribution
R.C. and M.B. were responsible for the conceptualization of the research and deciding on the methodology to be followed.
R.C. carried out the investigations and analysis of the data was done by R.C. and S.D.
S.D. and A.J. revised it critically for important intellectual content.
The manuscript was prepared by R.S. and reviewed by M.B. and A.J. The overall mentorship and supervision were provided by M.B.
Statement of Ethics
All experiments and protocols were approved by IAEC (Reg. No. 973/ac/06/CPCSEA).
References
- 1.Wang GP, Huang LQ, Wu HJ, et al. Calcineurin contributes to spatial memory impairment induced by rapid eye movement sleep deprivation. Neuroreport 2009; 20(13): 1172–1176. [DOI] [PubMed] [Google Scholar]
- 2.Alhaider IA, Aleisa AM, Tran TT, et al. Sleep deprivation prevents stimulation-induced increases of levels of P-CREB and BDNF: Protection by caffeine. Mol Cell Neurosci 2011; 46(4): 742–751. [DOI] [PubMed] [Google Scholar]
- 3.Kiss JP. Role of nitric oxide in the regulation of monoaminergic neurotransmission. Brain Res Bull 2000; 52(6): 459–466. [DOI] [PubMed] [Google Scholar]
- 4.Villafuerte G, Miguel-Puga A, Rodríguez E, et al. Sleep deprivation and oxidative stress in animal models: A systematic review. Oxid Med Cell Longev . 2015; 2015:234952. [DOI] [PMC free article] [PubMed] [Google Scholar]
- 5.Christopherson KS, Bredt DS. Nitric oxide in excitable tissues: Physiological roles and disease. J Clin Invest 1997; 100(10): 2424–2429. [DOI] [PMC free article] [PubMed] [Google Scholar]
- 6.Bolaños JP, Almeida A, Stewart V, et al. Nitric oxide-mediated mitochondrial damage in the brain: Mechanisms and implications for neurodegenerative diseases. J Neurochem 1997; 68(6): 2227–2240. [DOI] [PubMed] [Google Scholar]
- 7.Dzoljic MR, de Vries R, van Leeuwen R. Sleep and nitric: Oxide: effects of 7-nitro indazole, inhibitor of brain nitric oxide synthase. Brain Res 1996; 718(1–2): 145–150. [DOI] [PubMed] [Google Scholar]
- 8.Cespuglio R, Amrouni D, Meiller A, et al. Nitric oxide in the regulation of the sleep-wake states. Sleep Med Rev 2012; 16(3): 265–279. [DOI] [PubMed] [Google Scholar]
- 9.Calabrese V, Mancuso C, Calvani M, et al. Nitric oxide in the central nervous system: Neuroprotection versus neurotoxicity. Nat Rev Neurosci 2007; 8(10): 766. [DOI] [PubMed] [Google Scholar]
- 10.Chuang YC, Chen SD, Liou CW, et al. Contribution of nitric oxide, superoxide anion, and peroxynitrite to activation of mitochondrial apoptotic signaling in hippocampal CA3 subfield following experimental temporal lobe status epilepticus. Epilepsia 2009; 50(4): 731–746. [DOI] [PubMed] [Google Scholar]
- 11.Sayan H, Gelir E, Babul A. Brain stem and cerebral cortex histamine concentrations in the REM sleep deprived rats. Turk J Med Sci 2001; 31(6): 499–502. [Google Scholar]
- 12.Grahnstedt S, Ursin R. Platform sleep deprivation affects deep slow wave sleep in addition to REM sleep. Behav Brain Res 1985; 18(3): 233–239. [DOI] [PubMed] [Google Scholar]
- 13.Machado RB, Hipólide DC, Benedito-Silva AA, et al. Sleep deprivation induced by the modified multiple platform technique: Quantification of sleep loss and recovery. Brain Res 2004; 1004(1–2): 45–51. [DOI] [PubMed] [Google Scholar]
- 14.Colavito V, Fabene PF, Grassi Zucconi G, et al. Experimental sleep deprivation as a tool to test memory deficits in rodents. Front Syst Neurosci 2013; 7: 106. [DOI] [PMC free article] [PubMed] [Google Scholar]
- 15.Franken P, Dijk DJ, Tobler I, et al. Sleep deprivation in rats: Effects on EEG power spectra, vigilance states, and cortical temperature. Am J Physiol Regul 1991; 261(1): R198–R208. [DOI] [PubMed] [Google Scholar]
- 16.Abercrombie M. Estimation of nuclear population from microtome sections. Anat Rec 1946; 94(2): 239–247. [DOI] [PubMed] [Google Scholar]
- 17.Gautier-Sauvigné S, Colas D, Parmantier P, et al. Nitric oxide and sleep. Sleep Med Rev 2005; 9(2): 101–113. [DOI] [PubMed] [Google Scholar]
- 18.Chen L, Majde JA, Krueger JM. Spontaneous sleep in mice with targeted disruptions of neuronal or inducible nitric oxide synthase genes. Brain Res 2003; 973(2): 214–222. [DOI] [PubMed] [Google Scholar]
- 19.Colas D, Gharib A, Bezin L, et al. Regional age-related changes in neuronal nitric oxide synthase (nNOS), messenger RNA levels and activity in SAMP8 brain. BMC Neurosci 2006; 7(1): 81. [DOI] [PMC free article] [PubMed] [Google Scholar]
- 20.Lores-Arnaiz S, Bustamante J, Czernizyniec A, et al. Exposure to enriched environments increases brain nitric oxide synthase and improves cognitive performance in prepubertal but not in young rats. Behav Brain Res 2007; 184(2): 117–123. [DOI] [PubMed] [Google Scholar]
- 21.Hsu JC, Lee YS, Chang CN, et al. Sleep deprivation inhibits expression of NADPH-d and NOS while activating microglia and astroglia in the rat hippocampus. Cells Tissues Organs 2003; 173(4): 242–254. [DOI] [PubMed] [Google Scholar]
- 22.Cirelli C, Gutierrez CM, Tononi G. Extensive and divergent effects of sleep and wakefulness on brain gene expression. Neuron 2004; 41(1): 35–43. [DOI] [PubMed] [Google Scholar]
- 23.Vyazovskiy VV, Cirelli C, Pfister-Genskow M, et al. Molecular and electrophysiological evidence for net synaptic potentiation in wake and depression in sleep. Nat Neurosci 2008; 11(2): 200. [DOI] [PubMed] [Google Scholar]
- 24.Vollert C, Zagaar M, Hovatta I, et al. Exercise prevents sleep deprivation associated anxiety like behavior in rats: Potential role of oxidative stress mechanisms. Behav Brain Res 2011; 224(2): 233–240. [DOI] [PubMed] [Google Scholar]
- 25.Chanana P, Kumar A. Possible involvement of nitric oxide modulatory mechanisms in the neuroprotective effect of centella asiatica against sleep deprivation induced anxiety like behavior, oxidative damage and neuroinflammation. Phytother Res 2016; 30(4): 671–680. [DOI] [PubMed] [Google Scholar]
- 26.Chittora R, Jain A, Prasad J, et al. An ameliorative effect of recovery sleep on total sleep deprivation induced neurodegeneration. Biol Rhythm Res 2016; 47(3): 425–436. [Google Scholar]
- 27.Wu X, Yang LQ, Wang XF. The effects of sleep deprivation on brain levels of nitric oxide synthase and nitric oxide in rat. Chin J Clin Psychol 2002; 10(2): 106–107. [Google Scholar]
- 28.Muzur A, Pace-Schott EF, Hobson JA. The prefrontal cortex in sleep. Trends Cogn Sci 2002; 6(11): 475–481. [DOI] [PubMed] [Google Scholar]
- 29.Mallick BN, Pandi-Perumal SR, McCarley RW, et al. (eds). Rapid Eye Movement Sleep: Regulation and Function . Cambridge University Press, 2011. [Google Scholar]
- 30.Kalinchuk AV, McCarley RW, Porkka-Heiskanen T, et al. The time course of adenosine, nitric oxide (NO) and inducible NO synthase changes in the brain with sleep loss and their role in the nonrapid eye movement sleep homeostatic cascade. J Neurochem 2011; 116(2): 260–272. [DOI] [PMC free article] [PubMed] [Google Scholar]
- 31.Simon EB, Oren N, Sharon H, et al. Losing neutrality: The neural basis of impaired emotional control without sleep. J Neurosci 2015; 35(38): 13194–13205. [DOI] [PMC free article] [PubMed] [Google Scholar]
- 32.Majumdar S, Mallick BN. Cytomorphometric changes in rat brain neurons after rapid eye movement sleep deprivation. Neuroscience 2005; 135(3): 679–690. [DOI] [PubMed] [Google Scholar]