

Summary
Diatoms are successful phytoplankton clades able to acclimate to changing environmental conditions, including e.g. variable light intensity. Diatoms are outstanding at dissipating light energy exceeding the maximum photosynthetic electron transfer (PET) capacity via the nonphotochemical quenching (NPQ) process. While the molecular effectors of NPQ as well as the involvement of the proton motive force (PMF) in its regulation are known, the regulators of the PET/PMF relationship remain unidentified in diatoms.
We generated mutants of the H+/K+ antiporter KEA3 in the model diatom Phaeodactylum tricornutum.
Loss of KEA3 activity affects the PET/PMF coupling and NPQ responses at the onset of illumination, during transients and in steady‐state conditions. Thus, this antiporter is a main regulator of the PET/PMF coupling. Consistent with this conclusion, a parsimonious model including only two free components, KEA3 and the diadinoxanthin de‐epoxidase, describes most of the feedback loops between PET and NPQ.
This simple regulatory system allows for efficient responses to fast (minutes) or slow (e.g. diel) changes in light environment, thanks to the presence of a regulatory calcium ion (Ca2+)‐binding domain in KEA3 modulating its activity. This circuit is likely tuned by the NPQ‐effector proteins, LHCXs, providing diatoms with the required flexibility to thrive in different ocean provinces.
Keywords: diatoms, ion channels, nonphotochemical quenching, photosynthesis, phytoplankton, proton motive force
Introduction
Diatoms are key ecological players and very efficient CO2 sinks in contemporary oceans (Tréguer et al., 2018; Falciatore et al., 2020). They thrive in diverse environmental niches (Malviya et al., 2016), proliferate on ice (Thomas & Dieckmann, 2002) and generally dominate phytoplankton communities in upwelling turbulent environments (Margalef, 1978; Tréguer et al., 2018; Falciatore et al., 2020). A likely key factor for diatom ecological success in challenging environments is their photosynthetic flexibility. The photosynthetic electron flow is optimized by the peculiar three‐dimensional (3D) organization of photosynthetic complexes within diatom thylakoid membranes, which are organized as parallel interconnected layers (Flori et al., 2017). Light energy is collected by a diatom‐specific light‐harvesting apparatus (Büchel, 2020), in which pigments (i.e. chlorophyll a and c, β‐carotene, fucoxanthin, diadinoxanthin (DD), diatoxanthin (DT)) are embedded in antenna complexes, which either absorb sunlight (LHCF and LHCR families) or mediate photoprotective responses through thermal dissipation of excess light (nonphotochemical quenching (NPQ)) (LHCX family) (Büchel, 2020; Falciatore et al., 2020). Diatoms display very high NPQ levels (Lavaud et al., 2002b; Ruban et al., 2004), regulated by the reversible enzymatic conversion of DD into DT through the xanthophyll cycle (XC, Stransky & Hager, 1970; Jakob et al., 2001; Blommaert et al., 2021). Accumulation of violaxanthin–antheraxanthin–zeaxanthin (the XC pigments of plants) is also observed under specific conditions (Lohr & Wilhelm, 1999). In diatoms, LHCX proteins also modulate the extent of NPQ (Bailleul et al., 2010; Lepetit et al., 2017; Buck et al., 2019), like the NPQ effectors PsbS and LHCSRs proteins in Viridiplantae (Niyogi & Truong, 2013; Giovagnetti & Ruban, 2018; Büchel, 2020; Falciatore et al., 2020).
In Viridiplantae, the proton motive force (PMF) sets the NPQ response (Wraight & Crofts, 1970), activating the XC enzymes and inducing the protonation of specific amino acids on PsbS and LHCSRs during ∆pH formation (Li et al., 2004; Zaks et al., 2012; Niyogi & Truong, 2013; Ballottari et al., 2016; Matuszyńska et al., 2016; Davis et al., 2017). In diatoms, the role of the PMF on NPQ regulation is less understood. The XC is pH‐sensitive (Jakob et al., 2001; Blommaert et al., 2021). A pH‐related modulation of the function of LHCX proteins is instead less likely to occur, although it cannot be completely ruled out (Shinkle et al., 2010; Taddei et al., 2016; Falciatore et al., 2020; Buck et al., 2021; Giovagnetti et al., 2022). It has been previously proposed that the mechanism of DT‐dependent NPQ may not rely on the presence of the ∆pH, DT being able to fully exert its quenching capacity in the absence of a proton gradient (Goss et al., 2006). This proposal was criticized by Lavaud & Kroth (2006), who proposed the existence of a pH control beyond the XC. Given the crucial role of PMF on NPQ regulation, here we re‐examined the coupling between photosynthetic activity and the PMF in diatoms, combining photophysiological, genetic and computational approaches in the model species Phaeodactylum tricornutum. We found that the luminal pH, which regulates NPQ through the pH dependence of the DD de‐epoxidase, is in turn modulated by the H+/K+ antiporter KEA3. Although evolutionarily related to the KEA1–3 family in plants (Armbruster et al., 2014; Kunz et al., 2014; Szabò & Spetea, 2017; Wang et al., 2017), the diatom KEA3 protein contains an EF hand motif that is absent in the Viridiplantae orthologues. We show that this domain controls KEA3 activity in diatoms, providing a possible link between intracellular calcium ion (Ca2+) concentration and responses to fast (minutes) or slow (e.g. diel) changes in light environment.
Materials and Methods
Strains and cells growth
Phaeodactylum tricornutum Pt1 and Pt4 cells were grown in ESAW (enriched seawater artificial water; Berges et al., 2001) supplemented with NaNO3 (468 mg l−1) and NaH2PO4·H2O (30 mg l−1), at 20°C and shaking at 100 rpm. Both ecotypes are wild‐type (WT) P. tricornutum cells, Pt1 being isolated in Plymouth (UK) and Pt4 in the Baltic Sea (De Martino et al., 2007). Cells were exposed to a light intensity of 40 µmol photons m−2 s−1 and a 12 h : 12 h, light : dark photoperiod. Phaeodactylum tricornutum Pt1 cultures were also grown in sterile artificial seawater f/2 medium (Guillard & Ryther, 1962) at 18°C, and shaking at 100 rpm, with cells exposed either to a 14 h : 10 h, light : dark photoperiod (40 μmol photons m−2 s−1) or intermittent light (IL, 40 μmol photons m−2 s−1, with cycles of 5 min : 55 min light : dark) (Giovagnetti & Ruban, 2017).
Bioinformatics
The gene Phatr3_J39274 was identified as the most likely homologue of AtKEA3 (AtKEA3, At4g04850) by Blast on the genome of P. tricornutum. Sequence alignment and phylogenetic reconstructions were performed using the function ‘build’ of Ete3 v.3.1.1 (Huerta‐Cepas et al., 2016) as implemented on GenomeNet (https://www.genome.jp/tools/ete/). Alignment was performed with Mafft v.6.861b with the default options (Katoh & Standley, 2013). The protein sequences used in this work are available in Supporting Information Table S1. The protein encoded by Phatr3_J39274 will be named here as PtKEA3 or KEA3.
The domains of PtKEA3 were identified using the following web tools: InterPro (https://www.ebi.ac.uk/interpro/), ASAFind (https://rocaplab.ocean.washington.edu/tools/asafind/) and SignalP v.4.1 (http://www.cbs.dtu.dk/services/SignalP‐4.1/) (Bendtsen et al., 2004; Gruber et al., 2015).
Molecular biology
All primers used in this work are described in Table S2. Target sites for CRISPR‐Cas9 were identified within the Phatr3_J39274 gene using the PhytoCRISP‐Ex web tool (https://www.phytocrispex.biologie.ens.fr/CRISP‐Ex/). Adapters were designed according to the protocol of Allorent et al. (2018). The gene coding for zeocin resistance was inserted into the plasmid pKSdiaCas9_sgRNA (Addgene; plasmid #74923) by Gibson cloning (Gibson et al., 2009) to create the plasmid pKSdiaCAs9_sgRNA_ZeoR. The adapters were then inserted into the plasmid pKSdiaCas9_sgRNA_ZeoR. The resulting plasmids were coated on tungsten beads and used for biolistic transformation of the cells with the PDS‐100/He system (Bio‐Rad, Hercules, CA, USA; 1672257). DNA from zeocin (100 µg ml−1 final) resistant transformants was extracted, amplified by PCR and sequenced for mutant identification.
To complement knockout (KO) mutants, genomic DNA was extracted from WT Pt1 cells and the gene Phatr3_J39274 was amplified by PCR using the Phusion™ Polymerase (Thermo Fisher, Waltham, MA, USA). The coding sequence (CDS) was fused to an enhanced green fluorescent protein (eGFP) encoding DNA sequence at the C‐terminal and inserted into a vector containing a gene for blasticidin resistance under the control of the Fcp promoter. The resulting plasmids were used for biolistic transformation of the mutant kea3‐1 using the same procedure as for the construction of KO‐mutants. Transformants were selected on ESAW supplemented with zeocin (100 µg ml−1) and blasticidin (12 µg ml−1).
Quantitative polymerase chain reaction (qPCR)
Total RNA for quantitative polymerase chain reaction (qPCR) was extracted from cell cultures of WT, kea3‐1 and kea 3‐2 KO and kea3‐1/KEA3‐eGFP OE strains. KEA3 expression was normalized on three house‐keeping genes (RPS, TBP and EF1‐a). See Methods S1 for additional information.
Protein analysis
Total protein content was isolated from cell cultures in mid‐exponential phase in 50 mM HEPES buffer supplemented with EDTA‐free protein inhibitor cocktail (Roche, Basel, Switzerland). Cell walls were broken by three 30‐s cycles at 600 g in the presence of micro glass beads (200–400 µm diameter; Sigma‐Aldrich, St Louis, MO, USA; Precellys, Bertin Technologies, Montigny‐le‐Bretonneux, France). The protein extracts were clarified by centrifugation and proteins were precipitated for 20 min at −20°C in 80% (v/v) acetone. After centrifugation, the pellet was solubilized for 5 min at 4°C in 50 mM Tris (pH 7.6) and 2% sodium dodecyl sulphate (SDS), supplemented with EDTA‐free protein inhibitor cocktail. For PtKEA3 protein detection, extracts enriched in membrane proteins were prepared as follows. After cell rupture, total protein extracts were centrifuged (12 000 g , 90 s, 4°C) and the pellets (containing membranes) were washed twice with 50 mM HEPES, 50 mM sodium chloride (NaCl). Finally, membrane proteins were solubilized with Tris‐SDS solution as previously described. Samples were prepared according to standard protocols for sodium dodecyl sulphate–polyacrylamide gel electrophoresis (SDS‐PAGE).
For Blue Native‐PAGE, chloroplasts were isolated as in Flori et al. (2017). Thylakoids were collected by centrifugation (10 000 g , 10 min) and stored in 25 mM Bis‐Tris (pH 7), 20% glycerol at −80°C. thylakoids (100 µg of proteins) were solubilized with 0.75% n‐dodecyl‐α‐d‐maltoside (Anatrace, Maumee, OH, USA) at room temperature (RT) for 20 min. Unsolubilized membrane particles were then pelleted by centrifugation (20 000 g , 20 min) and discarded. Prior to gel running 1 : 10 v/v BN‐loading buffer (500 mM aminocaproic acid, 30% sucrose, 5% Blue Comassie G‐250, 100 mM Bis‐Tris (pH 7)) was added to the supernatant. Gels (NativePAGE™, 4–16%, Bis‐Tris; Invitrogen, Carlsbad, CA, USA) were run as described in (Järvi et al., 2011) (cathode buffer: 50 mM Tricine, 15 mM Bis‐Tris (pH 7), 0.01% Blue Comassie G‐250; anode buffer: 50 mM Bis‐Tris (pH 7)). A mix of Conalbumine (76 kDa), aldolase (158 kDa) and thyroglubuline (660 kDa) (Bio‐Rad) was used as molecular weight marker. After run, single lines were excised from the gel and were soaked with 138 mM Tris pH 6.8, 4.3% SDS for 40 min, followed by 1 min with the same solution supplemented with 20% glycerol prior loading onto 8.5% acrylamide gel for subsequent SDS‐PAGE.
For denaturing gels, polypeptides were separated by SDS‐PAGE and transferred to a polyvinylidene fluoride (PVDF) membrane for immunodetection following standard protocols.
To investigate the effects of Ca2+ on PtKEA3 migration in SDS‐PAGE gels, polyacrylamide gels were supplemented with either 1 mM calcium chloride (CaCl2) and 10 mM EGTA (ethylene glycol‐bis(β‐aminoethyl ether)‐N,N,N′,N′‐tetraacetic acid) or 1 mM magnesium chloride (MgCl2). In such conditions, the Western blot cathode buffers were supplemented with 1 mM MgCl2, 1 mM CaCl2 or 10 mM EGTA for the respective gels.
Localization by confocal imaging
Algae were visualized with a TCS SP8 confocal microscope (Leica Biosystems, Nussloch, Germany) upon excitation at 488 nm and detection at 500–550 (GFP fluorescence) and 630–690 nm (chlorophyll fluorescence), respectively. See Methods S1 for additional information.
Recombinant protein expression and purification: Production of α‐KEA3 antibody
The C‐terminal sequence of PtKEA3 corresponding to amino acids 580–853 was fused to a His‐tag and expressed in Escherichia coli Rosetta 2 cells. The recombinant protein was purified on a nickel column and used as an antigen for the immunization of a guinea pig. See Methods S1 for additional information.
Chlorophyll fluorescence measurements and NPQ induction in the dark by pH shift
To image chlorophyll fluorescence, 200 µl of cell suspension were placed on wells of a 96‐well plate at a cell concentration of 2 × 10⁶ cells ml−1. If needed, nigericin (Nig) or ammonium chloride (NH4Cl) were added to the cell suspension at this stage. Cells were dark‐adapted for 10 min prior to measurements. Wells were imaged for fluorescence emission using a Speedzen III fluorescence imaging setup (JBeam Bio, La Rochelle, France). Maximum fluorescence (F m) and F m′ were measured using saturating red pulses (3000 µmol photons m−2 s−1, duration 250 ms) followed by blue light (λ = 470 nm) detection pulses. NPQ was calculated as (F m − F m′)/F m′ and effective quantum yield of photosystem II (ΦPSII) as (F m′ − F s)/F m′ (Maxwell & Johnson, 2000).
For measurements of NPQ induction in the dark, cells were concentrated by centrifugation (5 min, 3000 g ) and the pellet was resuspended in fresh ESAW at the density of 107 cells ml−1. The external pH was acidified by sequential additions of acetic acid up to 5 mM, and then neutralized using potassium hydroxide (KOH) up to 2.5 mM. Fluorescence was measured with a PAM‐101 fluorimeter (Walz, Effeltrich, Germany) after pH equilibration. NPQ was calculated upon reaching steady state fluorescence levels.
Spectroscopic assessment of the PMF
Spectroscopic measurements (electro chromic shift (ECS), cytochromes c 6 + f redox changes) were performed as described earlier (Bailleul et al., 2015).
The 9‐aminoacridine (9‐aa) fluorescence was measured to determine ∆pH using a dual PAM spectrofluorometer (Walz). A full description of these techniques is available in Methods S1, together with the methods used to calibrate the ∆pH : ∆Ψ ratio and cytochrome b6f pH dependence.
Pigment analysis by high‐performance liquid chromatography (HPLC)
Pigment analysis was done as described in Allorent et al. (2013) from cells harvested in mid‐exponential phase. See Methods S1 for additional information.
Statistical analysis
When applicable, significant differences between groups were analysed using a Kruskal and Wallis test followed by a Dunn’s test corrected for multiple comparisons by the Benjamini–Hochberg procedure. Threshold for significance was set to P < 0.05.
Mathematical model
Modelling of NPQ was done adapting to diatoms an ordinary differential equations (ODEs)‐based kinetic model of electron transport chain, initially developed for higher plants (Matuszyńska et al., 2016). The model comprises a set of five ODEs following the dynamics of the reduced state of the plastoquinones (PQ), the stromal concentration of ATP, the luminal proton concentration (H), the fraction of epoxidized xanthophylls (DD), and the fraction of active ATPase, returning additionally the calculated fluorescence signal. Major changes to this model include (1) the modification of six parameters derived from plants to better fit diatoms, (2) the introduction of PMF partitioning using a new constant k KEA, (3) the shift from a four‐state model of NPQ (Horton et al., 2005; Holzwarth & Jahns, 2014) to a simpler model where NPQ only depends on the amount of DT and LHCX1, hence ensuring that NPQ is always proportional to XC de‐epoxidation (Goss et al., 2006), and (4) the introduction of a new parameter k ETC scaling NPQ activity under low light intensities, to account for the recently discovered high light‐dependency of the rate constant of the epoxidase enzyme (Blommaert et al., 2021). The model has been implemented using Modelbase software in Python (van Aalst et al., 2021) and the source code to solve the system numerically is available in GitRepository (https://gitlab.com/matuszynska/npq‐diatoms2020; doi: 10.5281/zenodo.5865038). See Methods S1 for additional information.
Results
NPQ is pH dependent in diatoms
We investigated the pH dependency of diatom NPQ in P. tricornutum using a previously established protocol to equilibrate the pH across algal internal compartments (Finazzi & Rappaport, 1998; Tian et al., 2019). Cells were exposed to a progressive acidification of the external medium pH in the presence of a permeant buffer (acetate). The pH equilibration was facilitated using the H+/K+ exchanger, Nig. Lowering the pH induced a significant fluorescence quenching (Fig. 1a), similar to that observed in untreated cells upon exposure to high light (HL). The acid‐induced quenching in the dark was accompanied by the conversion of DD into DT (Fig. 1b, red symbols) to a similar extent of that observed during light‐induced NPQ in nonpermeabilized cells (Fig. 1b, black symbols). Initial fluorescence levels were recovered upon reversing the external pH to its initial neutral level with KOH (Fig. 1a,b). We observed the same pH dependency of NPQ in two different ecotypes of P. tricornutum Pt1 and Pt4 (Fig. S1), even though they display different levels of NPQ (Bailleul et al., 2010).
Fig. 1.
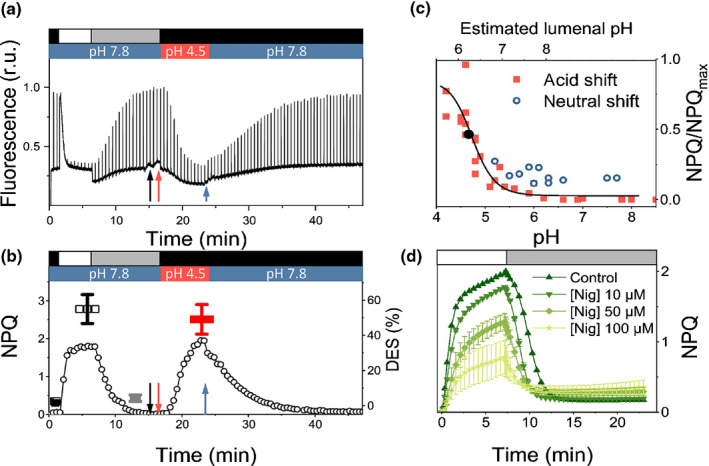
Nonphotochemical quenching (NPQ) in Phaeodactylum tricornutum is pH and ∆pH dependent. (a) Fluorescence quenching transients in P. tricornutum wild‐type (WT) cells exposed to high light (HL, 1200 µmol photons m−2 s−1, white box), low light (LL, 25 µmol photons m−2 s−1, grey box) and dark (black box) at different pH values. Arrows indicate addition of nigericin (20 µM, black), acetic acid (5 mM, red) and potassium hydroxide (2.5 mM, blue). (b) NPQ kinetics (circles) calculated from the fluorescence traces shown in (a). black symbol: de‐epoxidation state (DES) in the dark. White symbol: DES in HL. Grey symbol: DES upon NPQ relaxation in LL. Red symbol: DES at pH 4.5 (in the dark). n = 5–8. Mean ± SD. (c) The pH dependency of NPQ in the presence of 20 µM nigericin during an acidic (red squares) or a neutral (blue circles) shift. Black dot: apparent pKa of the NPQ vs pH relationship. The acid shift was done from an initial external pH of 7.8 to the indicated pH values. The pH neutral shift was done from an initial external pH of 4.5 to the indicated pH values. Data represent different experiments performed with six biological samples. (d) Nig sensitivity of NPQ in P. tricornutum cells. Different concentrations of Nig were added before measuring NPQ induction under HL (1200 µmol photons m−2 s−1, white box) and relaxation under LL (25 µmol photons m−2 s−1, grey box). n = 3. Mean ± SD.
The absolute pH dependency of quenching in P. tricornutum (apparent pKa of 4.7, Fig. 1c) was shifted towards more acidic values than in green algae (apparent pKa of 6.2 in Chlamydomonas reinhardtii; Tian et al., 2019). Thus, quenching could reflect photosystem II (PSII) photodamage, which is expected at such low lumen pH values (Krieger & Weis, 1993; Spetea et al., 1997; Kramer et al., 2003). However, we found a very similar relationship between NPQ and PSII photochemical quantum yield (F v/F m) during a HL to low light (LL) relaxation and the acid to neutral pH transition (Fig. S2). This suggests that PSII maintained the same photochemical capacity in HL and during the pH shift (i.e. upon acidification). Alternatively, the different pH dependence could reflect an incomplete pH equilibration between the lumen and the external medium during the experiment. Indeed, a calibration of the luminal pH during the pH shift using an independent probe (i.e. the pH dependence of cytochrome b6f turnover; Fig. S3) suggests that the pH luminal values are higher than the ones imposed to the cell medium. Despite this possible inaccuracy in assessing the absolute NPQ/pH relationship in permeabilized cells, the effect of acidification on fluorescence quenching clearly demonstrates the role of the pH component of the PMF on diatom NPQ. This notion was corroborated by testing how P. tricornutum NPQ kinetics is affected by adding two protonophores, Nig (Fig. 1d) and NH4Cl (Fig. S4), the latter having been often used to dissipate NPQ in diatoms (Lavaud et al., 2002a; Ruban et al., 2004; Goss et al., 2006). Both compounds suppressed NPQ in a dose‐dependent manner (Figs 1d, S4). High concentrations (i.e. 100 µM Nig and over 50 mM NH4Cl) were required to substantially inhibit fluorescence quenching, while inducing secondary effects.
The K+/H+ antiporter PtKEA3 drives the pH/NPQ relationship in P. tricornutum
Having established the crucial role of the pH component of the PMF on P. tricornutum NPQ kinetics, we decided to investigate how the PMF is regulated in diatoms, where this phenomenon is still largely ignored. The action mechanism of Nig (Fig. 1d), which is a K+/H+ exchanger, is similar to that of the K+/H+ antiporter KEA3 (Tsujii et al., 2019) previously suggested to modulate acclimation to light transients in Arabidopsis thaliana (Armbruster et al., 2014; Kunz et al., 2014; Szabò & Spetea, 2017; Wang et al., 2017). Based on phylogenetic sequence analysis (Fig. S5), we identified the Phatr3_J39274 gene as the most likely P. tricornutum homologue of the A. thaliana KEA3 encoding gene (ATG404850). The primary protein sequence contains typical elements of this family of antiporters: the cation/H+ exchange and regulator of K+ conductance (RCK) domains (Fig. S6). In addition to this, it harbours an EF hand, possibly involved in Ca2+ binding, which is not found in Viridiplantae (Fig. S5). Consistent with bioinformatic predictions (Gruber et al., 2015), which pinpoint a plastid targeting signal peptide, the gene product fused to eGFP localized in the chloroplast of P. tricornutum (Fig. 2a). To study the function of the Phatr3_J39274 gene‐encoded protein (PtKEA3), we generated knockout (KO) mutants using a CRISPR‐Cas9 approach (Allorent et al., 2018). We selected two clones (kea3‐1 and kea3‐2) encoding truncated proteins without the catalytic transmembrane domain (Fig. S6). The PtKEA3 protein, which migrated as a double band in SDS‐PAGE gels under standard conditions (see later for an explanation) was no longer detectable in the KO strains using a polyclonal antiserum (Figs 2b, S7). We complemented kea3‐1 with PtKEA3 fused to eGFP under the control of the FCP promoter (Siaut et al., 2007; Falciatore et al., 2020). This genotype, named kea3‐1/KEA3‐eGFP (Fig. 2b, see also Fig. S8 for other complemented lines) turned out to be an overexpressor (OE) of PtKEA3 at both transcriptional and translational levels (Fig. 2b,c), and will be referred to as an OE hereafter.
Fig. 2.
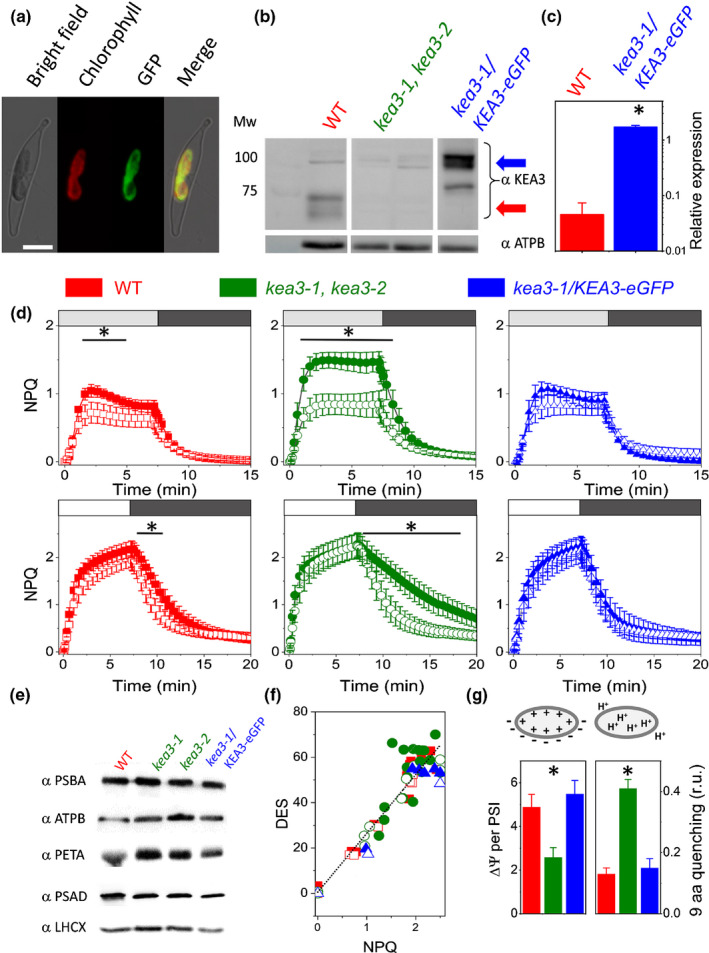
Molecular and physiological characterization of KEA3 mutants in Phaeodactylum tricornutum. (a) Localization of a full‐length PtKEA3:eGFP fusion protein expressed in P. tricornutum. Bright field, light microscope images; chlorophyll, chlorophyll auto‐fluorescence; eGFP, enhanced green fluorescence protein; merge, merged channel. Bar, 5 μm. (b) Immunodetection of KEA3 in total protein extracts from wild‐type (WT, red arrow) and kea3‐1, kea3‐2 and kea3‐1/KEA3‐eGFP (blue arrow) strains. A 30 μg total protein content was loaded per well. Note that the higher molecular weight in the complemented lines is due to the presence of eGFP. The antibody specificity is shown in Supporting Information Fig. S7. Loading control: β subunit of the plastidial ATP synthase complex (ATPB). Representative picture of an experiment repeated three times with similar results. (c) Quantitative polymerase chain reaction (qPCR) quantification of KEA3 messenger RNA (mRNA) steady state in WT (red) and complemented kea3‐1/KEA3‐eGFP genotypes (blue). n = 3 mean ± SD. Expression was normalized on three house‐keeping genes (RPS, TBP and EF1‐a). The asterisks indicate significant differences in expression between the WT and kea3‐1/KEA3‐eGFP genotypes (P < 0.05). (d) Nonphotochemical quenching (NPQ) features in WT (red), knockout (KO) (green) and complemented (blue) genotype under moderate light (ML: 125 µmol photons m−2 s−1, upper panels) and high light (HL: 1200 µmol photons m−2 s−1, lower panels) in control conditions (solid symbols) and upon addition of 10 µm nigericin (open symbols). White box: HL; light grey box: ML; dark grey box: low light (LL, 25 µmol photons m−2 s−1) to facilitate NPQ recovery. ML: n = 6 mean ± SD. HL: n = 15 mean ± SD. Asterisks indicate significant differences in NPQ between control and nigericin treated samples (P < 0.05). (e) Western blot analysis of photosynthetic complexes in WT and mutant genotypes. Total protein extracts were analysed by immunodetection using specific antisera. PSBA, photosystem II D1 protein, 25 µg protein loaded; Cyt f, cytochrome b6f complex PETA protein, 50 µg protein loaded; PSAD, photosystem I subunit, 20 µg protein loaded; LHCX, 20 µg protein loaded; ATPB, β subunit of ATPase, 20 µg protein loaded, as loading control. Representative picture of an experiment repeated three times with similar results. (f) Relationship between NPQ capacity and de‐epoxidation state (DES) in the different genotypes. Same colour code as in (c, d). n = 5 mean ± SD. Solid symbols: control; open symbols: Nig (10 µM). (g) Estimates of the two components of the transthylakoid proton motive force (PMF): the electric potential (charge gradient, left) via the electro chromic shift (ECS) signal (left; n = 6 mean ± SD) and the pH gradient (proton gradient, right) via the quenching of 9‐aminoacridine (9‐aa) fluorescence (n = 4 mean ± SD). Raw data are shown in Fig. S12. Asterisks indicate significant differences in ΔΨ or ΔpH signals between the kea3‐1, kea3‐2 (pooled data from the two lines), the WT and the kea3‐1/KEA3‐eGFP genotypes (P < 0.05).
The kea3‐1 and kea 3‐2 KO mutant cells showed an altered NPQ response at moderate light (ML, 125 µmol photons m−2 s−1), where fluorescence quenching was higher than in the WT and complemented lines (Fig. 2d). Addition of 10 µM Nig restored WT‐like NPQ values in the KO mutants, while being almost without effect in the other strains (Fig. 2d). This Nig dose was chosen to avoid the loss of electron flow recovery under LL, which is observed at higher concentrations and likely reflects damage to the photosynthetic apparatus (Fig. S9). Differences in the NPQ extent and Nig sensitivity were lost under HL (above 450 µmol photons m−2 s−1; Figs 2d, S10). However, kea3‐1 and kea 3‐2 KO strains displayed faster induction kinetics of NPQ onset under HL, while under LL, NPQ relaxation was slower in KO strains than in WT and OE cells (Fig. S11), in line with earlier results in plants (Armbruster et al., 2014). The NPQ phenotype of KO mutants was not due to changes in the accumulation of specific photosynthetic complexes, for which we could detect comparable levels of representative proteins in all strains (Fig. 2e). This also included the main and constitutive NPQ effector in P. tricornutum (LHCX1; Bailleul et al., 2010), hence excluding a different accumulation of this protein as the cause of the change in NPQ capacity observed in the mutants. The Stern–Volmer (S–V) relationship between the NPQ extent and de‐epoxidation state (DES, Fig. 2f) was also similar in all genotypes, both in the absence and presence of NIg. This result, already reported in the case of WT P. tricornutum cells treated with NH4Cl (Goss et al., 2006), suggests that PtKEA3 modulates the relationship between NPQ and the PMF without altering the S–V relationship between fluorescence quenching and the de‐epoxidation state.
Overall, these data indicate that: (1) Nig is effective in modulating P. tricornutum NPQ in vivo; (2) its effect is enhanced upon inactivation of the PtKEA3 H+/K+ antiporter; (3) overexpressing PtKEA3 makes NPQ Nig‐insensitive. Based on previous observations in plants (Armbruster et al., 2014; Kunz et al., 2014; Wang et al., 2017; Galvis et al., 2020), a plausible explanation for the different effect of Nig on NPQ between WT and mutants would be that the ΔpH is enhanced upon removal of the PtKEA3 antiporter. The consequently increased ΔpH would trigger a larger, Nig‐sensitive NPQ in the KO mutants. We tested this possibility by comparing the two components of the PMF (i.e. the electric field – ΔΨ – and the proton gradient – ΔpH; Witt, 1979) in vivo. We measured changes in the ΔΨ with the ECS signal, a modification of the absorption spectrum of specific pigments that senses the transmembrane electric field (Witt, 1979; Figs 2g, S12; see also Methods S1). In parallel, we implemented the use of the fluorescent probe 9‐aa to estimate changes in the ΔpH (Schuldiner et al., 1972) in living cells (Figs 2g, S12; Methods S1). We observed complementary changes in the two PMF components in the different genotypes. In particular, the increased ΔpH in light‐exposed kea3‐1 and kea 3‐2 KO cells was paralleled by a similar decrease in the ΔΨ component in the light (Fig. 2g), while the kea3‐1/KEA3‐eGFP OE mutant displayed a WT‐like partitioning of the PMF.
PtKEA3 controls NPQ by modulating XC dynamics in diatoms
Although the ΔΨ/ΔpH changes observed may account for the NPQ phenotype of the kea3‐1 and kea 3‐2 KO mutant under ML (Fig. 2d,g), they do not explain why NPQ becomes similar in all genotypes under HL. We hypothesize that although the proton fluxes might be different in the different genotypes, the luminal pH may become acidic enough to trigger similar NPQ responses under HL. We tested this possibility by adapting a computational model that recapitulates NPQ features of plants (Matuszyńska et al., 2016) to diatoms (Fig. 3a; Methods S1; Table S3). Initially, to account for the fact that the quencher formation depends only on the de‐epoxidation state of the XC we abandoned the four‐state quenching model introduced in Matuszyńska et al. (2016). Here, the quencher formation (Q) was calculated as Q = [Dt] × [LHCX], where [Dt] is a dynamic variable representing the concentration of diatoxanthin and [LHCX] is not a dynamic variable anymore, but a parameter corresponding to the amount of available LHCX proteins. In our case, the amount of LHCX1 was similar in all strains (Fig. 2e), advocating for the choice of a shared parameter for LHCX. To simulate the activity of PtKEA3, we introduced a partitioning of the PMF between its ΔΨ and ΔpH components. While both can contribute to ATP synthesis (Witt, 1979), only the latter is able to modulate NPQ. We simulated the consequences of the absence and overaccumulation of PtKEA3 in the KO and OE mutant strains, respectively, by modifying the ratio (K KEA3) between the ΔΨ and ΔpH according to the changes in the two PMF components observed in the different genotypes (Fig. 2g). This led us to satisfactorily recapitulate the main experimental features of NPQ in the different strains including the higher NPQ extent in KO mutants under ML (Fig. 3b) and the light dependency of NPQ (Fig. 3c) in the three genotypes, where NPQ became comparable under HL. Based on these results, we conclude that: (1) steady state NPQ is regulated by pH under different light conditions; (2) this regulation mainly depends on changes in the ΔΨ to ΔpH ratio; (3) based on the mutant phenotypes found in this study, PtKEA3 appears to be a key regulator of the ΔpH/XC/NPQ relationship in P. tricornutum.
Fig. 3.
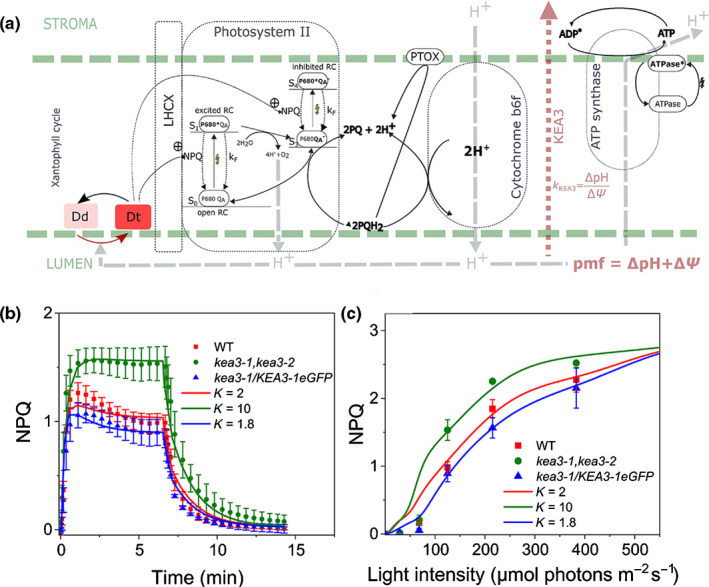
Mathematical model recapitulating nonphotochemical quenching (NPQ) features of diatoms. (a) General features of the computational model used to describe diatom NPQ. Based on a previous model for NPQ in plants (Matuszyńska et al., 2016), the model used here adopts some modifications (see also ‘the Materials and Methods section’ and the Supporting Information Methods S1) including: (1) a more neutral pK for diadinoxanthin de‐epoxidase (6.3) relative to violaxanthin de‐epoxidase; (2) partitioning of the proton motive force (PMF) between the ΔΨ and the ΔH is included via the K KEA3 parameter (K KEA3 = ΔpH/ΔΨ). (b) Simulations of NPQ kinetics of wild‐type (WT) and mutants under moderate light (raw data from Fig. 2d (symbols ± SD) were simulated (lines) considering changes in the ΔpH : ΔΨ ratio calculated based on Cruz et al. (2001)). (c) Light dependency of NPQ in the different genotypes. Raw data from Fig. S10 (symbols ± SD) were simulated (lines) considering the same changes in the ΔpH/ΔΨ as in (b).
Regulation of PtKEA3 and diatom physiological responses
Having established the role of PtKEA3 on P. tricornutum NPQ, we looked for a possible growth phenotype of cells depleted in PtKEA3 under different light conditions. KO mutants did not display specific growth impairments under different light conditions including ML (Table S4), in which we observed differences in the NPQ phenotype at steady‐state (Fig. 2d). Growing cells in f/2 medium with a 14 h : 10 h, light : dark photoperiod, as already used in other studies (Giovagnetti & Ruban, 2017), substantially modified the NPQ responses of P. tricornutum (Table S4), without changing the mutant growth capacity. Cells grown in these conditions became more sensitive to inhibition of NPQ by protonophores (Table S5). When grown under IL, all genotypes displayed a reduced growth rate compared to the 14 h : 10 h, light : dark or the 12 h : 12 h, light : dark photoperiods (Table S4), in line with the substantial (seven fold) decrease in the daily dose of photons received (Lavaud et al., 2002b; Giovagnetti & Ruban, 2017). At this light, however, cells lacking PtKEA3 showed a growth retard when compared to the WT and OE lines (Table S4), possibly due to very high levels of NPQ formed (> 8), which could compete with PSII light‐harvesting capacity for available photons (Giovagnetti & Ruban, 2017; Buck et al., 2019). Regardless of the variability in growth, NPQ extent and protonophore sensitivity induced by light regimes and growth media, the consequences of the KEA3 mutation on NPQ were similar in all tested conditions (Figs 2d, S13; Table S4), with the KEA3 KO phenotype also preserved in response to HL exposure in f/2‐grown cultures (Fig. 2d; Table S4).
Besides the role of PtKEA3 in modulating transient NPQ responses and acclimation to different light regimes, which is in line with previous results in plants (Armbruster et al., 2016; Li et al., 2021), we found a unique feature of PtKEA3 in P. tricornutum, i.e. its possible role in diel modulation of NPQ. This is suggested by the observation that the NPQ amplitude and sensitivity to Nig increases at the end of the light phase in WT cells (Fig. 4a), while remaining Nig sensitive and insensitive, respectively, in KO and OE mutants throughout the light phase of the day. Analysis of available transcriptomic data suggests a rationale for this observation, showing that KEA3 transcripts decreased significantly at the end of the light phase in WT cells (Chauton et al., 2013). A decreased PtKEA3 accumulation in the WT at the end of the light phase should make these cells more alike to KO mutants, explaining their enhanced Nig sensitivity. We confirmed a decrease in PtKEA3 transcripts in WT cells from the beginning to the end of the light phase (Fig. 4b). However, we could not detect any change in the PtKEA3 accumulation between samples collected either in the morning or in the evening (Fig. 4c), suggesting that changes in the Nig sensitivity of NPQ cannot be simply explained by changes in PtKEA3 abundance. Recent work has suggested that the plant KEA3 is regulated through its dimerization through the C terminus RCK domain (Uflewski et al., 2021), in line with earlier findings in the bacterial K+ efflux system KefC (Roosild et al., 2009). We tested this possibility and found the same oligomerization of KEA3 in thylakoids isolated from cells harvested either in the morning or in the afternoon (Fig. 4d).
Fig. 4.
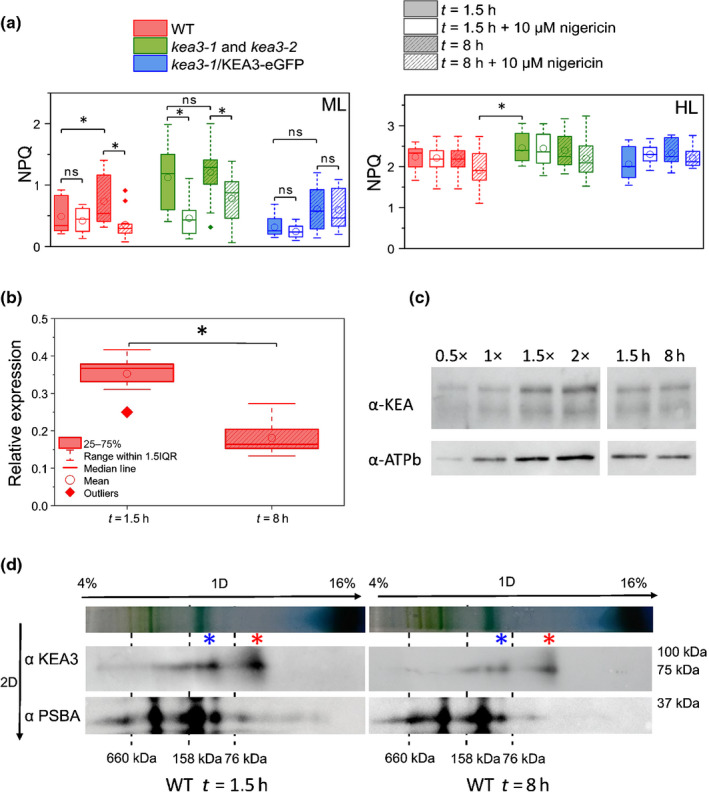
Role of PtKEA3 in promoting diel variations in the ΔpH sensitivity of nonphotochemical quenching (NPQ) in Phaeodactylum tricornutum. Cells were grown in a 12 h : 12 h, photoperiod and harvested either 1.5 or 8 h after the onset of illumination. (a) Variation in NPQ amplitude and nigericin sensitivity measured in wild‐type (WT), kea3‐1 and kea3‐2 (pooled data from the two lines) and kea3‐1/KEA3‐eGFP cells after 1.5 h (solid, open) and 8 h (dashed) of exposure to moderate light (ML, 125 µmol photons m−2 s−1, left) and high light (HL, 1200 µmol photons m−2 s−1, right). n = 7–16. ns, not significant. (b) Quantification of PtKEA3 messenger RNA (mRNA) accumulation by quantitative polymerase chain reaction (qPCR) after 1.5 h (solid) and 8 h (dashed) of light exposure to ML light (inset) in WT cells. n = 3. Expression was normalized on three house‐keeping genes (RPS, TBP and EF1‐a). The asterisk indicates significant differences in KEA3 expression levels (P < 0.05). (c) Immunodetection of PtKEA3 protein in WT cells steady state in the thylakoids after 1.5 and 8 h of illumination. The sensitivity of the Western blot analysis using progressive dilutions of the sample is shown. Representative picture of an experiment repeated three times with similar results. ATPB immunodetection was used as loading control. (d) Oligomerization state of KEA3 in WT cells harvested 1.5 or 8 h after the onset of illumination during the day. Thylakoid membranes of WT were solubilized with α‐dodecyl maltoside (α‐DM) and loaded on 4–16% acrylamide BN gel (top arrows). A mix of thyroglobuline (660 kDa), aldolase (158 kDa) and Conalbumine (76 kDa) was used as molecular weight markers (dashed lines). KEA3 was detected on two‐dimensional (2D) denaturizing condition using α‐KEA3 antiserum and α‐PSBA antiserum was used as running control. Molecular weight markers are reported on the right. Red asterisk: KEA3 monomer; blue asterisk: KEA3 dimer. Representative picture of an experiment repeated three times with similar results.
Overall, these data raise the question of how the function of this protein is regulated in diatoms. The KEA3 protein is predicted to contain a peculiar EF hand domain in P. tricornutum, similarly to other proteins involved in cell energetic metabolism (Prihoda et al., 2012). This Ca2+ binding domain is located close to the RCK domain (Fig. S6), i.e. in a position where it could modulate the activity of the antiporter (Wang et al., 2017; Galvis et al., 2020). We therefore investigated the role of this domain on the function of PtKEA3. As mentioned earlier, two PtKEA3 bands are observed by immunodetection after separation by SDS‐PAGE, both in the WT and in OE lines (Figs 2b, 5a). We assessed the nature of these bands, and their possible relationship to Ca2+ binding, using two OE clones, exploiting the fact that signals were larger and easier to analyse in these genotypes. We found that addition of 1 mM CaCl2 to the gel led to the appearance of only a single band, corresponding to the lower band of the control (blue asterisk) (Fig. 5b). Conversely, addition of the Ca2+‐chelator EGTA (10 mM) to the calcium‐supplemented gel restores a control‐like distribution of the two bands (Fig. 5c). Replacement of CaCl2 with 1 mM MgCl2 had no consequences on the protein migration compared to standard conditions (Fig. 5d). These findings indicate that (1) Ca2+ binds to PtKEA3 and alters the protein mobility in the gel in agreement with previous findings with other Ca2+ binding proteins bearing EF‐hand motifs (Ishitani et al., 2000; Kamthan et al., 2015), (2) the effect of this ion is specific (as indicated by the lack of effect of MgCl2) and can be reversed to some extent by Ca2+ chelation. These in vitro data on binding of Ca2+ to PtKEA3 suggests a possible role of this ion in controlling protein conformational changes and therefore activity, as previously reported in the case of other EF‐hand‐bearing Ca2+ binding proteins (Ishitani et al., 2000; Kamthan et al., 2015). To test this possibility, we generated two P. tricornutum KEA3 mutant lines lacking the EF‐hand motif (Fig. S6). Although these cells still accumulate the PtKEA3 messenger RNA (mRNA) to WT‐like levels (Fig. 5e), they displayed similar characteristics as the kea3‐1 and kea 3‐2 KO mutants, their NPQ being higher and more Nig‐sensitive than in the WT (Fig. 5f). This phenotypic trait suggests that the antiporter was inactive in these genotypes, indicating that Ca2+ could modulate PtKEA3 activity via the EF‐hand found in diatoms, unlike the plant KEA3 (Uflewski et al., 2021). Based on previously reported changes in the cellular Ca2+ concentration during the day in plants (Love et al., 2004), it is tempting to propose that intracellular variations/fluctuations in the concentration of this ion may be involved in the diurnal changes in PtKEA3 activity/NPQ observed in P. tricornutum.
Fig. 5.
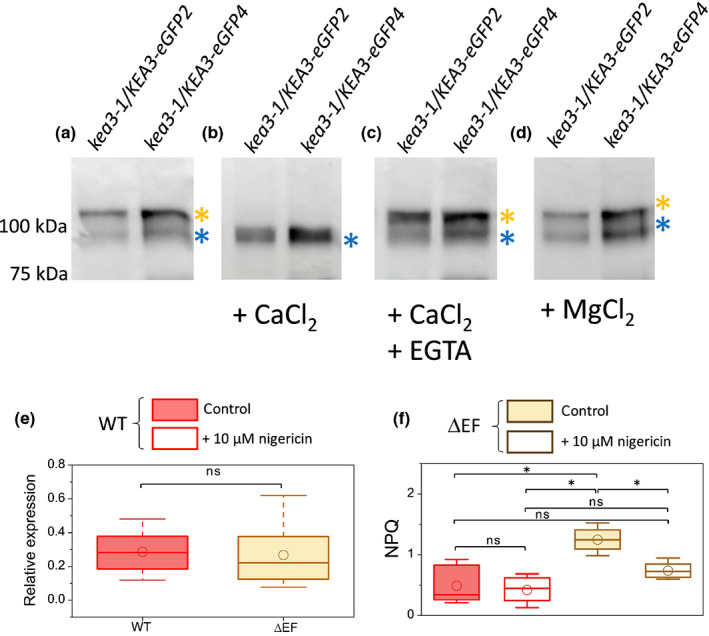
Calcium ion (Ca2+) binding controls KEA3 activity in Phaeodactylum tricornutum through an EF‐hand motif. Immunodetection of KEA3 of total protein extracts from two different kea3‐1/KEA3‐eGFP overexpressing strains (Supporting Information Fig. S8). The polypeptides were separated by SDS‐PAGE and revealed with an antibody directed against enhanced green fluorescent protein (eGFP) (Miltenyi Biotech, Cambridge, MA, USA). (a) Control conditions: kea3‐1/KEA3‐eGFP appears as a doublet (orange and blue asterisks). (b) In the presence of 1 mM calcium chloride (CaCl2), only a single band is visible. (c) The Ca2+‐chelator EGTA (10 mM) suppresses the effect of Ca2+, restoring the presence of two bands in the gel. (d) Replacement of CaCl2 with 1 mM magnesium chloride (MgCl2) has no consequences on the polypeptide migration. Representative picture of an experiment repeated three times with similar results. (e) Quantification of KEA3 messenger RNA (mRNA) accumulation by quantitative polymerase chain reaction (qPCR) in the wild‐type (WT) (red) and in two KEA mutants lacking the EF calcium binding motif (ΔEF‐1 and ΔEF‐2, pooled data from the two lines). Expression was normalized on three house‐keeping genes (RPS, TBP and EF1‐a) n = 3. ns, not significant. (f) Nonphotochemical quenching (NPQ) amplitude and nigericin sensitivity measured in the wild‐type (WT) and in ΔEF lines (ΔEF‐1 and ΔEF‐2, pooled data from the two lines). n = 12–27. Asterisks indicate significant differences in NPQ (P < 0.05). Statistical parameters concerning (a, f) are the same as in Fig. 4(b). ns, not significant.
Discussion
Nonphotochemical quenching has been extensively studied in diatoms, not only because of the ecological relevance of this microorganism, but also because of its peculiar features when compared to plants. Diatoms harbour unique NPQ protein effectors (LHCX) and XC (reviewed in Falciatore et al., 2020). The amplitude of NPQ in P. tricornutum largely exceeds that observed in plants and green microalgae (Lavaud et al., 2002b; Giovagnetti & Ruban, 2017; Taddei et al., 2018). Diatoms have been proposed to develop different quenching sites depending on environmental conditions (Chukhutsina et al., 2014; Giovagnetti & Ruban, 2017; Taddei et al., 2018). Yet, despite the significant progress made to understand the mechanism of diatom NPQ, the relationship between fluorescence quenching and thylakoid membrane energization, which is an essential feature of plant NPQ (Wraight & Crofts, 1970), is still debated in these organisms (Goss et al., 2006; Lavaud & Kroth, 2006).
In Viridiplantae, the proton gradient activates both the XC and NPQ effectors (PsbS in vascular plants, LHCSR and PsbS in mosses and green algae; Niyogi & Truong, 2013; Giovagnetti & Ruban, 2018). Due to their different apparent pKa, these PMF targets lead to complex NPQ responses to the proton gradient (Zaks et al., 2012; Matuszyńska et al., 2016). In P. tricornutum, the NPQ/pH relationship appears to be satisfactorily recapitulated with a simple computational model, including only two elements: PtKEA, which modulates the composition of the PMF established by photosynthetic electron transfer (PET), and the XC activity (more precisely, the diadinoxanthin de‐epoxidase), which translates the proton gradient into a NPQ response (Fig. 3). Consistent with this model, the pH dependence of NPQ reported in Fig. 1 prompts that of the diatom diadinoxanthin de‐epoxidase (Jakob et al., 2001). A pH‐dependent regulation of LHCXs cannot be entirely excluded, since the pH dependency of NPQ found in P. tricornutum (Fig. 1) is similar to that reported in C. reinhardtii (Tian et al., 2019), where LHCSR3 is instead protonated and is a major target of the ΔpH regulation (Ballottari et al., 2016). However, two pieces of evidence are against this possibility: (1) recent data (Buck et al., 2021; Giovagnetti et al., 2022) have questioned the involvement of LHCXs (and specifically the constitutive isoform, LHCX1) in the pH dependency of NPQ. Moreover, (2) we observed that the pH dependency of NPQ is the same in Pt1 (our reference ecotype) and the Pt4 ecotype, although the latter displays significantly reduced levels of LHCX1 and thus a lower extent of NPQ (Fig. S1; Bailleul et al., 2010). Conversely, one would expect different pH profiles in the two ecotypes if LHCX1 and the diadinoxanthin de‐epoxidase (the activity of which is comparable between Pt1 and Pt4; Bailleul et al., 2010) respond to pH with different profiles, because of the diminished contribution of LHCX1 in Pt4.
The phenotype of the kea3‐1 and kea 3‐2 KO mutants, which show altered NPQ transients (Figs 2, S11) in line with previous conclusions in plants (Armbruster et al., 2014; Kunz et al., 2014), as well as during steady state (Fig. 2), fully supports our model. We noted, however, that some of the NPQ transients (and in particular the slower NPQ relaxation in KO strains) are not well reproduced by simulations based on this parsimonious model (Fig. 3b). This finding is consistent with the idea that other effectors may fine tune NPQ responses in P. tricornutum during transients, as recently found in plants (Li et al., 2021). Consistent with this possibility, several proteins have been invoked in the modulation of the partitioning between the ΔΨ and ΔpH components of the PMF in plants (e.g. TPK3, KEA3, CLCe, VCCN1, PHT4;1, PAM71/CCHA1) (reviewed by Szabò & Spetea, 2017; Li et al., 2021) and have homologues encoded by diatom genomes (e.g. TPK3, CLCe, VCCN1; Marchand et al., 2018). Thus, such candidates could play a role in the PMF regulation in these organisms under specific conditions.
In principle, the simple PMF/NPQ regulatory circuit proposed here for diatoms is in contradiction with the notion that these organisms display a panoply of responses to environmental challenges, which are often coupled to a large flexibility of their NPQ (Falciatore et al., 2020). Our data suggest a possible rationale for this apparent inconsistency. PtKEA3 contains a RCK domain (Roosild et al., 2002; Cao et al., 2013), which could make it sensitive to changes in the stromal nucleotide (ATP, ADP, AMP, and NAD(P)H) contents (Armbruster et al., 2016; Wang et al., 2017; Galvis et al., 2020; Uflewski et al., 2021, for a discussion). The role of NADPH and ascorbate as co‐factors for the diatoxanthin epoxidase and diadinoxanthin de‐epoxidase, respectively (Goss et al., 2006; Blommaert et al., 2021), may provide diatoms with a sophisticated regulatory control over the cellular redox state, PMF and NPQ.
Moreover, and in contrast to plants, PtKEA3 contains an EF hand domain, which is only found in other diatom KEA3 homologues, opening the possibility of a diatom‐specific Ca2+ regulation of the PMF. Indeed, PtKEA3 binds Ca2+ in vitro, and mutants lacking the EF hand display a similar NPQ phenotype as kea3‐1 and kea 3‐2 KO lines (Fig. 5). These in vitro findings suggest the existence of a Ca2+‐dependent regulation of PtKEA3 in vivo, which could explain the daily changes in NPQ observed in P. tricornutum (Fig. 4), based on circadian changes in Ca2+ previously reported in plants (Love et al., 2004). The Ca2+ is known to mediate responses to fluid motion, osmotic stress, and iron (Falciatore et al., 2000). Thus this ion could facilitate photoprotective responses to variable environmental conditions experienced by phytoplankton in turbulent waters.
A previous study has already shown a link between intracellular Ca2+ and NPQ in green microalgae (Petroutsos et al., 2011). However, the mechanism shown in green algae differs from the one reported here in diatoms: while in P. tricornutum Ca2+ seems to affect the PMF, i.e. the ‘trigger’ of NPQ, via PtKEA3, this ion modulates the accumulation of the LHCSR3 protein, i.e. the NPQ ‘effector’ in C. reinhardtii.
While redox state and Ca2+ regulation would provide fast environmental responses, the presence of numerous LHCX isoforms (e.g. four in P. tricornutum and up to 11 in Fragilariopsis cylindrus; Taddei et al., 2016; Mock et al., 2017) could mediate either fast (LHCX1) or long‐term (LHCX2‐3) light‐harvesting control in response to different environmental factors. Indeed, LHCXs not only catalyse responses to light changes (i.e. light intensity and spectrum, and duration of light exposure; Coesel et al., 2009; Taddei et al., 2018), but also to nutrient limitation (iron (LHCX2) and nitrogen (LHCX3, LHCX4); Taddei et al., 2016).
Altogether, the presence of short‐ and long‐term regulatory mechanisms plugged to a parsimonious NPQ/PMF regulatory circuit may contribute to the required functional diversity/flexibility of light‐harvesting regulation for diatoms to thrive in different aquatic environments, where light acclimation is often a major determinant for growth and survival (Lin et al., 2016).
Author contributions
CS, MS, VG, HH, BB, FC, GA and GF designed research; CS, MS, VG, AM, EG, XZ, CG, YP, LB, JA, HH, FC, GA and GF performed research; CS, MS, VG, AM, XZ, CG, HH, AVR, BB, FC, GA and GF analysed data; CS, VG, AM, and GF wrote the manuscript.
Supporting information
Fig. S1 Nonphotochemical quenching extent and pH dependency in the Phaeodactylum tricornutum Pt1 and Pt4 ecotypes.
Fig. S2 The pH‐induced fluorescence quenching does not affect the Stern–Volmer relationship between nonphotochemical quenching and photosystem II photochemical quantum yield.
Fig. S3 Calibration of the luminal pH in Phaeodactylum tricornutum cells as a function of medium acidification.
Fig. S4 Ammonium chloride (NH4Cl) sensitivity of nonphotochemical quenching in Phaeodactylum tricornutum cells.
Fig. S5 KEA mid‐point rooted phylogeny inferred using maximum likelihood analysis.
Fig. S6 Molecular characteristics of the knockout (KO) mutant genotypes employed in this work.
Fig. S7 Specificity of the custom antibody against KEA3.
Fig. S8 Molecular and physiological characterization of the complemented kea3‐1/KEA3‐eGFP genotype.
Fig. S9 Consequences of nigericin concentrations on nonphotochemical quenching and photosynthetic electron flow in wild‐type (WT), kea3‐1 and kea3‐2 knockout (KO) mutants and kea3‐1/KEA3‐eGFP complemented mutant.
Fig. S10 Light dependency of nonphotochemical quenching in wild‐type (WT), kea3‐1 and kea3‐2 kockout (KO) and kea3‐1/KEA3‐eGFP overexpressor (OE) genotypes.
Fig. S11 Nonphotochemical quenching transients in wild‐type (WT), kea3‐1 and kea3‐2 knockout (KO) mutants and kea3‐1/KEA3‐eGFP genotypes.
Fig. S12 Characterization of the proton motive force (PMF) in living cells of Phaeodactylum tricornutum.
Fig. S13 Nonphotochemical quenching features of the kea3‐1 and kea3‐2 knockout (KO) mutants compared to the wild‐type (WT) and kea3‐1/KEA3‐eGFP genotypes.
Methods S1 Detailed list of methods supplementary references.
Table S1 Accession number of proteins used in this study.
Table S2 List of primers used in this study.
Table S3 Parameters used in the model simulations.
Table S4 Nonphotochemical quenching features in response to high light (HL) and growth rates of Phaeodactylum tricornutum cells grown under different light and nutrient conditions.
Table S5 Protonophore sensitivity of nonphotochemical quenching in wild‐type (WT) cells grown in enriched seawater artificial water (ESAW) and f/2 media.
Please note: Wiley Blackwell are not responsible for the content or functionality of any Supporting Information supplied by the authors. Any queries (other than missing material) should be directed to the New Phytologist Central Office.
Acknowledgements
The authors would like to thank Dr Leonardo Magneschi (Ingenza Limited, UK), and Prof. Oliver Ebenhöh (University of Düsseldorf, Germany) for discussions and help in the first steps of this project. The authors would like to thank Dr Marcel Kunz (CEA Grenoble, France) for technical help with the HPLC facilities. This project received funding from the LabEx GRAL (ANR‐10‐LABX‐49‐01) and was financed within the University Grenoble Alpes graduate school (Ecoles Universitaires de Recherche; CBH‐EUR‐GS) (ANR‐17‐EURE‐0003). GF, MS and CG acknowledge the support by the European Research Council (ERC) Chloro‐mito (grant no. 833184). EG and GF received funding from the French Research Funding agency (ANR) grant ‘Momix’ (Projet‐ANR‐17‐CE05‐0029). GA and GF received funds from the HFSP ‘Photosynthesis light utilization dynamics and ion fluxes: making the link’. XZ and GF received funds form a CEA grant on carbon circular economy. GA received funds from the CNRS ‘Momentum’ program. VG received funds from The Leverhulme Trust (RPG‐2018‐199). AVR received funds from The Leverhulme Trust (RPG‐2018‐199), the Biotechnology and Biological Sciences Research Council (BB/R015694/1) and The Royal Society Wolfson Research Merit Award (WM140084). AM received funding from the Deutsche Forschungsgemeinschaft (DFG, German Research Foundation) under Germany’s Excellence Strategy – EXC‐2048/1 – project ID 390686111 and DFG Research Grant MA 8103/1‐1. BB acknowledges the support by the ERC PhotoPHYTOMIX project (grant no. 715579). HH was supported by the Strategic Priority Research Program of the Chinese Academy of Sciences (no. XDPB18).
Data availability
The data supporting the findings of this study is available from the corresponding author upon reasonable request. All computational results are available on gitlab repository (https://gitlab.com/matuszynska/npq‐diatoms2020; doi: 10.5281/zenodo.5865038).
References
- van Aalst M, Ebenhöh O, Matuszyńska A. 2021. Constructing and analysing dynamic models with modelbase v.1.2.3: a software update. BMC Bioinformatics 22: 1–15. [DOI] [PMC free article] [PubMed] [Google Scholar]
- Allorent G, Guglielmino E, Giustini C, Courtois F. 2018. Generation of mutants of nuclear‐encoded plastid proteins using CRISPR/Cas9 in the diatom Phaeodactylum tricornutum . Methods in Molecular Biology 1829: 367–378. [DOI] [PubMed] [Google Scholar]
- Allorent G, Tokutsu R, Roach T, Peers G, Cardol P, Girard‐Bascou J, Seigneurin‐Berny D, Petroutsos D, Kuntz M, Breyton C et al. 2013. A dual strategy to cope with high light in Chlamydomonas reinhardtii . Plant Cell 25: 545–557. [DOI] [PMC free article] [PubMed] [Google Scholar]
- Armbruster U, Carrillo LR, Venema K, Pavlovic L, Schmidtmann E, Kornfeld A, Jahns P, Berry JA, Kramer DM, Jonikas MC. 2014. Ion antiport accelerates photosynthetic acclimation in fluctuating light environments. Nature Communications 5: 5439. [DOI] [PMC free article] [PubMed] [Google Scholar]
- Armbruster U, Leonelli L, Galvis VC, Strand D, Quinn EH, Jonikas MC, Niyogi KK. 2016. Regulation and levels of the thylakoid K+/H+ antiporter KEA3 shape the dynamic response of photosynthesis in fluctuating light. Plant and Cell Physiology 57: 1557–1567. [DOI] [PMC free article] [PubMed] [Google Scholar]
- Bailleul B, Berne N, Murik O, Petroutsos D, Prihoda J, Tanaka A, Villanova V, Bligny R, Flori S, Falconet D et al. 2015. Energetic coupling between plastids and mitochondria drives CO2 assimilation in diatoms. Nature 524: 366–369. [DOI] [PubMed] [Google Scholar]
- Bailleul B, Rogato A, De Martino A, Coesel S, Cardol P, Bowler C, Falciatore A, Finazzi G. 2010. An atypical member of the light‐harvesting complex stress‐related protein family modulates diatom responses to light. Proceedings of the National Academy of Sciences, USA 107: 18214–18219. [DOI] [PMC free article] [PubMed] [Google Scholar]
- Ballottari M, Truong TB, De Re E, Erickson E, Stella GR, Fleming GR, Bassi R, Niyogi KK. 2016. Identification of pH‐sensing sites in the light harvesting complex stress‐related 3 protein essential for triggering non‐photochemical quenching in Chlamydomonas reinhardtii . Journal of Biological Chemistry 291: 7334–7346. [DOI] [PMC free article] [PubMed] [Google Scholar]
- Bendtsen JD, Nielsen H, Von Heijne G, Brunak S. 2004. Improved prediction of signal peptides: SignalP 3.0. Journal of Molecular Biology 340: 783–795. [DOI] [PubMed] [Google Scholar]
- Berges JA, Franklin DJ, Harrison PJ. 2001. Evolution of an artificial seawater medium: improvements in enriched seawater, artificial water over the last two decades. Journal of Phycology 37: 1138–1145. [Google Scholar]
- Blommaert L, Chafai L, Bailleul B. 2021. The fine‐tuning of NPQ in diatoms relies on the regulation of both xanthophyll cycle enzymes. Scientific Reports 11: 1–16. [DOI] [PMC free article] [PubMed] [Google Scholar]
- Büchel C. 2020. Light harvesting complexes in chlorophyll c‐containing algae. Biochimica et Biophysica Acta – Bioenergetics 1861: 148027. [DOI] [PubMed] [Google Scholar]
- Buck JM, Kroth PG, Lepetit B. 2021. Identification of sequence motifs in Lhcx proteins that confer qE‐based photoprotection in the diatom Phaeodactylum tricornutum . The Plant Journal 108: 1721–1734. [DOI] [PubMed] [Google Scholar]
- Buck JM, Sherman J, Bártulos CR, Serif M, Halder M, Henkel J, Falciatore A, Lavaud J, Gorbunov MY, Kroth PG et al. 2019. Lhcx proteins provide photoprotection via thermal dissipation of absorbed light in the diatom Phaeodactylum tricornutum . Nature Communications 10: 4167. [DOI] [PMC free article] [PubMed] [Google Scholar]
- Cao Y, Pan Y, Huang H, Jin X, Levin EJ, Kloss B, Zhou M. 2013. Gating of the TrkH ion channel by its associated RCK protein TrkA. Nature 496: 317–322. [DOI] [PMC free article] [PubMed] [Google Scholar]
- Chauton MS, Winge P, Brembu T, Vadstein O, Bones AM. 2013. Gene regulation of carbon fixation, storage, and utilization in the diatom Phaeodactylum tricornutum acclimated to light/dark cycles. Plant Physiology 161: 1034–1048. [DOI] [PMC free article] [PubMed] [Google Scholar]
- Chukhutsina VU, Büchel C, Van Amerongen H. 2014. Disentangling two non‐photochemical quenching processes in Cyclotella meneghiniana by spectrally‐resolved picosecond fluorescence at 77 K. Biochimica et Biophysica Acta – Bioenergetics 1837: 899–907. [DOI] [PubMed] [Google Scholar]
- Coesel S, Mangogna M, Ishikawa T, Heijde M, Rogato A, Finazzi G, Todo T, Bowler C, Falciatore A. 2009. Diatom PtCPF1 is a new cryptochrome/photolyase family member with DNA repair and transcription regulation activity. EMBO Reports 10: 655–661. [DOI] [PMC free article] [PubMed] [Google Scholar]
- Cruz JA, Sacksteder CA, Kanazawa A, Kramer DM. 2001. Contribution of electric field (Δψ) to steady‐state transthylakoid proton motive force (pmf) in vitro and in vivo. Control of pmf parsing into Δψ and ΔpH by ionic strength. Biochemistry 40: 1226–1237. [DOI] [PubMed] [Google Scholar]
- Davis GA, Rutherford AW, Kramer DM. 2017. Hacking the thylakoid proton motive force for improved photosynthesis: modulating ion flux rates that control proton motive force partitioning into ΔΨ and ΔpH. Philosophical Transactions of the Royal Society of London. Series B: Biological Sciences 372: 20160381. [DOI] [PMC free article] [PubMed] [Google Scholar]
- De Martino A, Meichenin A, Shi J, Pan K, Bowler C. 2007. Genetic and phenotypic characterization of Phaeodactylum tricornutum (Bacillariophyceae) accessions. Journal of Phycology 43: 992–1009. [Google Scholar]
- Falciatore A, D’Alcalà MR, Croot P, Bowler C. 2000. Perception of environmental signals by a marine diatom. Science 288: 2363–2366. [DOI] [PubMed] [Google Scholar]
- Falciatore A, Jaubert M, Bouly JP, Bailleul B, Mock T. 2020. Diatom molecular research comes of age: model species for studying phytoplankton biology and diversity. Plant Cell 32: 547–572. [DOI] [PMC free article] [PubMed] [Google Scholar]
- Finazzi G, Rappaport F. 1998. In vivo characterization of the electrochemical proton gradient generated in darkness in green algae and its kinetic effects on cytochrome b 6 f turnover. Biochemistry 37: 9999–10005. [DOI] [PubMed] [Google Scholar]
- Flori S, Jouneau P‐H, Bailleul B, Gallet B, Estrozi LF, Moriscot C, Bastien O, Eicke S, Schober A, Bártulos CR et al. 2017. Plastid thylakoid architecture optimizes photosynthesis in diatoms. Nature Communications 8: 1–9. [DOI] [PMC free article] [PubMed] [Google Scholar]
- Galvis VC, Strand DD, Messer M, Thiele W, Bethmann S, Hübner D, Uflewski M, Kaiser E, Siemiatkowska B, Morris BA et al. 2020. H+ transport by K+ exchange antiporter3 promotes photosynthesis and growth in chloroplast ATP synthase mutants. Plant Physiology 182: 2126–2143. [DOI] [PMC free article] [PubMed] [Google Scholar]
- Gibson DG, Young L, Chuang RY, Venter JC, Hutchison CA, Smith HO. 2009. Enzymatic assembly of DNA molecules up to several hundred kilobases. Nature Methods 6: 343–345. [DOI] [PubMed] [Google Scholar]
- Giovagnetti V, Jaubert M, Shukla MK, Ungerer P, Bouly JP, Falciatore A, Ruban AV. 2022. Biochemical and molecular properties of LHCX1, the essential regulator of dynamic photoprotection in diatoms. Plant Physiology 188: 509–525. [DOI] [PMC free article] [PubMed] [Google Scholar]
- Giovagnetti V, Ruban AV. 2017. Detachment of the fucoxanthin chlorophyll a/c binding protein (FCP) antenna is not involved in the acclimative regulation of photoprotection in the pennate diatom Phaeodactylum tricornutum . Biochimica et Biophysica Acta – Bioenergetics 1858: 218–230. [DOI] [PubMed] [Google Scholar]
- Giovagnetti V, Ruban AV. 2018. The evolution of the photoprotective antenna proteins in oxygenic photosynthetic eukaryotes. Biochemical Society Transactions 46: 1263–1277. [DOI] [PubMed] [Google Scholar]
- Goss R, Ann Pinto E, Wilhelm C, Richter M. 2006. The importance of a highly active and DeltapH‐regulated diatoxanthin epoxidase for the regulation of the PS II antenna function in diadinoxanthin cycle containing algae. Journal of Plant Physiology 163: 1008–1021. [DOI] [PubMed] [Google Scholar]
- Gruber A, Rocap G, Kroth PG, Armbrust EV, Mock T. 2015. Plastid proteome prediction for diatoms and other algae with secondary plastids of the red lineage. The Plant Journal 81: 519–528. [DOI] [PMC free article] [PubMed] [Google Scholar]
- Guillard RR, Ryther JH. 1962. Studies of marine planktonic diatoms: I. Cyclotella nana Hustedt, and Detonula confervacea (Cleve) Gran. Canadian Journal of Microbiology 8: 229–239. [DOI] [PubMed] [Google Scholar]
- Holzwarth AR, Jahns P. 2014. Non‐photochemical quenching mechanisms in intact organisms as derived from ultrafast‐fluorescence kinetic studies. In: Demmig‐Adams B, Garab G, Adams W III, Govindjee, eds. Non‐photochemical quenching and energy dissipation in plants, algae and cyanobacteria. Berlin, Germany: Springer/Nature, 129–156. [Google Scholar]
- Horton P, Wentworth M, Ruban A. 2005. Control of the light harvesting function of chloroplast membranes: the LHCII‐aggregation model for non‐photochemical quenching. FEBS Letters 579: 4201–4206. [DOI] [PubMed] [Google Scholar]
- Huerta‐Cepas J, Serra F, Bork P. 2016. ETE 3: reconstruction, analysis, and visualization of phylogenomic data. Molecular Biology and Evolution 33: 1635–1638. [DOI] [PMC free article] [PubMed] [Google Scholar]
- Ishitani M, Liu J, Halfter U, Kim CS, Shi W, Zhu JK. 2000. SOS3 function in plant salt tolerance requires N‐myristoylation and calcium binding. Plant Cell 12: 1667–1677. [DOI] [PMC free article] [PubMed] [Google Scholar]
- Jakob T, Goss R, Wilhelm C. 2001. Unusual pH‐dependence of diadinoxanthin de‐epoxidase activation causes chlororespiratory induced accumulation of diatoxanthin in the diatom Phaeodactylum tricornutum . Journal of Plant Physiology 158: 383–390. [Google Scholar]
- Järvi S, Suorsa M, Paakkarinen V, Aro EM. 2011. Optimized native gel systems for separation of thylakoid protein complexes: novel super‐ and mega‐complexes. Biochemical Journal 439: 207–214. [DOI] [PubMed] [Google Scholar]
- Kamthan A, Kamthan M, Kumar A, Sharma P, Ansari S, Thakur SS, Chaudhuri A, Datta A. 2015. A calmodulin like EF hand protein positively regulates oxalate decarboxylase expression by interacting with E‐box elements of the promoter. Scientific Reports 5: 1–14. [DOI] [PMC free article] [PubMed] [Google Scholar]
- Katoh K, Standley DM. 2013. MAFFT multiple sequence alignment software version 7: improvements in performance and usability. Molecular Biology and Evolution 30: 772–780. [DOI] [PMC free article] [PubMed] [Google Scholar]
- Kramer DM, Cruz JA, Kanazawa A. 2003. Balancing the central roles of the thylakoid proton gradient. Trends in Plant Science 8: 27–32. [DOI] [PubMed] [Google Scholar]
- Krieger A, Weis E. 1993. The role of calcium in the pH‐dependent control of Photosystem II. Photosynthesis Research 37: 117–130. [DOI] [PubMed] [Google Scholar]
- Kunz H‐H, Gierth M, Herdean A, Satoh‐Cruz M, Kramer DM, Spetea C, Schroeder JI. 2014. Plastidial transporters KEA1, ‐2, and ‐3 are essential for chloroplast osmoregulation, integrity, and pH regulation in Arabidopsis. Proceedings of the National Academy of Sciences, USA 111: 7480–7485. [DOI] [PMC free article] [PubMed] [Google Scholar]
- Lavaud J, Kroth PG. 2006. In diatoms, the transthylakoid proton gradient regulates the photoprotective non‐photochemical fluorescence quenching beyond its control on the xanthophyll cycle. Plant and Cell Physiology 47: 1010–1016. [DOI] [PubMed] [Google Scholar]
- Lavaud J, Rousseau B, Etienne AL. 2002a. In diatoms, a transthylakoid proton gradient alone is not sufficient to induce a non‐photochemical fluorescence quenching. FEBS Letters 523: 163–166. [DOI] [PubMed] [Google Scholar]
- Lavaud J, Rousseau B, van Gorkom HJ, Etienne A‐L. 2002b. Influence of the diadinoxanthin pool size on photoprotection in the marine planktonic diatom Phaeodactylum tricornutum . Plant Physiology 129: 1398–1406. [DOI] [PMC free article] [PubMed] [Google Scholar]
- Lepetit B, Gélin G, Lepetit M, Sturm S, Vugrinec S, Rogato A, Kroth PG, Falciatore A, Lavaud J. 2017. The diatom Phaeodactylum tricornutum adjusts nonphotochemical fluorescence quenching capacity in response to dynamic light via fine‐tuned Lhcx and xanthophyll cycle pigment synthesis. New Phytologist 214: 205–218. [DOI] [PubMed] [Google Scholar]
- Li M, Svoboda V, Davis G, Kramer D, Kunz HH, Kirchhoff H. 2021. Impact of ion fluxes across thylakoid membranes on photosynthetic electron transport and photoprotection. Nature Plants 7: 979–988. [DOI] [PubMed] [Google Scholar]
- Li X‐P, Gilmore AM, Caffarri S, Bassi R, Golan T, Kramer D, Niyogi KK. 2004. Regulation of photosynthetic light harvesting involves intrathylakoid lumen pH sensing by the PsbS protein. Journal of Biological Chemistry 279: 22866–22874. [DOI] [PubMed] [Google Scholar]
- Lin H, Kuzminov FI, Park J, Lee SH, Falkowski PG, Gorbunov MY. 2016. Phytoplankton: the fate of photons absorbed by phytoplankton in the global ocean. Science 351: 264–267. [DOI] [PubMed] [Google Scholar]
- Lohr M, Wilhelm C. 1999. Algae displaying the diadinoxanthin cycle also possess the violaxanthin cycle. Proceedings of the National Academy of Sciences, USA 96: 8784–8789. [DOI] [PMC free article] [PubMed] [Google Scholar]
- Love J, Dodd AN, Webb AAR. 2004. Circadian and diurnal calcium oscillations encode photoperiodic information in Arabidopsis. Plant Cell 16: 956–966. [DOI] [PMC free article] [PubMed] [Google Scholar]
- Malviya S, Scalco E, Audic S, Vincent F, Veluchamy A, Poulain J, Wincker P, Iudicone D, de Vargas C, Bittner L et al. 2016. Insights into global diatom distribution and diversity in the world’s ocean. Proceedings of the National Academy of Sciences, USA 113: E1516–E1525. [DOI] [PMC free article] [PubMed] [Google Scholar]
- Marchand J, Heydarizadeh P, Schoefs B, Spetea C. 2018. Ion and metabolite transport in the chloroplast of algae: lessons from land plants. Cellular and Molecular Life Sciences 75: 2153–2176. [DOI] [PMC free article] [PubMed] [Google Scholar]
- Margalef R. 1978. Life‐forms of phytoplankton as survival alternatives in an unstable environment. Oceanologica Acta 1: 493–509. [Google Scholar]
- Matuszyńska A, Heidari S, Jahns P, Ebenhöh O. 2016. A mathematical model of non‐photochemical quenching to study short‐term light memory in plants. Biochimica et Biophysica Acta – Bioenergetics 1857: 1860–1869. [DOI] [PubMed] [Google Scholar]
- Maxwell K, Johnson GN. 2000. Chlorophyll fluorescence – a practical guide. Journal of Experimental Botany 51: 659–668. [DOI] [PubMed] [Google Scholar]
- Mock T, Otillar RP, Strauss J, McMullan M, Paajanen P, Schmutz J, Salamov A, Sanges R, Toseland A, Ward BJ et al. 2017. Evolutionary genomics of the cold‐Adapted diatom Fragilariopsis cylindrus . Nature 541: 536–540. [DOI] [PubMed] [Google Scholar]
- Niyogi KK, Truong TB. 2013. Evolution of flexible non‐photochemical quenching mechanisms that regulate light harvesting in oxygenic photosynthesis. Current Opinion in Plant Biology 16: 307–314. [DOI] [PubMed] [Google Scholar]
- Petroutsos D, Busch A, Janßen I, Trompelt K, Bergner SV, Weinl S, Holtkamp M, Karst U, Kudla J, Hippler M. 2011. The chloroplast calcium sensor CAS is required for photoacclimation in Chlamydomonas reinhardtii . Plant Cell 23: 2950–2963. [DOI] [PMC free article] [PubMed] [Google Scholar]
- Prihoda J, Tanaka A, De Paula WBM, Allen JF, Tirichine L, Bowler C. 2012. Chloroplast‐mitochondria cross‐talk in diatoms. Journal of Experimental Botany 63: 1543–1557. [DOI] [PubMed] [Google Scholar]
- Roosild TP, Castronovo S, Miller S, Li C, Rasmussen T, Bartlett W, Gunasekera B, Choe S, Booth IR. 2009. KTN (RCK) domains regulate K+ channels and transporters by controlling the dimer‐hinge conformation. Structure 17: 893–903. [DOI] [PMC free article] [PubMed] [Google Scholar]
- Roosild TP, Miller S, Booth IR, Choe S. 2002. A mechanism of regulating transmembrane potassium flux through a ligand‐mediated conformational switch. Cell 109: 781–791. [DOI] [PubMed] [Google Scholar]
- Ruban A, Lavaud J, Rousseau B, Guglielmi G, Horton P, Etienne AL. 2004. The super‐excess energy dissipation in diatom algae: comparative analysis with higher plants. Photosynthesis Research 82: 165–175. [DOI] [PubMed] [Google Scholar]
- Schuldiner S, Rottenberg H, Avron M. 1972. Determination of ΔpH in chloroplasts: 2. Fluorescent amines as a probe for the determination of ΔpH in chloroplasts. European Journal of Biochemistry 25: 64–70. [DOI] [PubMed] [Google Scholar]
- Shinkle JR, Edwards MC, Koenig A, Shaltz A, Barnes PW. 2010. Photomorphogenic regulation of increases in UV‐absorbing pigments in cucumber (Cucumis sativus) and Arabidopsis thaliana seedlings induced by different UV‐B and UV‐C wavebands. Physiologia Plantarum 138: 113–121. [DOI] [PubMed] [Google Scholar]
- Siaut M, Heijde M, Mangogna M, Montsant A, Coesel S, Allen A, Manfredonia A, Falciatore A, Bowler C. 2007. Molecular toolbox for studying diatom biology in Phaeodactylum tricornutum . Gene 406: 23–35. [DOI] [PubMed] [Google Scholar]
- Spetea C, Hideg É, Vass I. 1997. Low pH accelerates light‐induced damage of photosystem II by enhancing the probability of the donor‐side mechanism of photoinhibition. Biochimica et Biophysica Acta – Bioenergetics 1318: 275–283. [Google Scholar]
- Stransky H, Hager A. 1970. Das carotinoidmuster und die verbreitung des lichtinduzierten xanthophyllcyclus in verschiedenen algenklassen – II. Xanthophyceae. Archiv für Mikrobiologie 71: 164–190. [PubMed] [Google Scholar]
- Szabò I, Spetea C. 2017. Impact of the ion transportome of chloroplasts on the optimization of photosynthesis. Journal of Experimental Botany 68: 3115–3128. [DOI] [PubMed] [Google Scholar]
- Taddei L, Chukhutsina VU, Lepetit B, Stella GR, Bassi R, van Amerongen H, Bouly JP, Jaubert M, Finazzi G, Falciatore A. 2018. Dynamic changes between two LHCX‐related energy quenching sites control diatom photoacclimation. Plant Physiology 177: 953–965. [DOI] [PMC free article] [PubMed] [Google Scholar]
- Taddei L, Stella GR, Rogato A, Bailleul B, Fortunato AE, Annunziata R, Sanges R, Thaler M, Lepetit B, Lavaud J et al. 2016. Multisignal control of expression of the LHCX protein family in the marine diatom Phaeodactylum tricornutum . Journal of Experimental Botany 67: 3939–3951. [DOI] [PMC free article] [PubMed] [Google Scholar]
- Thomas DN, Dieckmann GS. 2002. Antarctic sea ice – a habitat for extremophiles. Science 295: 641–644. [DOI] [PubMed] [Google Scholar]
- Tian L, Nawrocki WJ, Liu X, Polukhina I, Van Stokkum IHM, Croce R. 2019. PH dependence, kinetics and light‐harvesting regulation of nonphotochemical quenching in Chlamydomonas . Proceedings of the National Academy of Sciences, USA 116: 8320–8325. [DOI] [PMC free article] [PubMed] [Google Scholar]
- Tréguer P, Bowler C, Moriceau B, Dutkiewicz S, Gehlen M, Aumont O, Bittner L, Dugdale R, Finkel Z, Iudicone D et al. 2018. Influence of diatom diversity on the ocean biological carbon pump. Nature Geoscience 11: 27–37. [Google Scholar]
- Tsujii M, Kera K, Hamamoto S, Kuromori T, Shikanai T, Uozumi N. 2019. Evidence for potassium transport activity of Arabidopsis KEA1‐KEA6. Scientific Reports 9: 1–13. [DOI] [PMC free article] [PubMed] [Google Scholar]
- Uflewski M, Mielke S, Correa Galvis V, von Bismarck T, Chen X, Tietz E, Ruß J, Luzarowski M, Sokolowska E, Skirycz A et al. 2021. Functional characterization of protonantiport regulation in the thylakoid membrane. Plant Physiology 187: 2209–2229. [DOI] [PMC free article] [PubMed] [Google Scholar]
- Wang C, Yamamoto H, Narumiya F, Munekage YN, Finazzi G, Szabo I, Shikanai T. 2017. Fine‐tuned regulation of the K+/H+ antiporter KEA3 is required to optimize photosynthesis during induction. The Plant Journal 89: 540–553. [DOI] [PubMed] [Google Scholar]
- Witt HT. 1979. Energy conversion in the functional membrane of photosynthesis. Analysis by light pulse and electric pulse methods. The central role of the electric field. Biochimica et Biophysica Acta – Reviews on Bioenergetics 505: 355–427. [DOI] [PubMed] [Google Scholar]
- Wraight CA, Crofts AR. 1970. Energy‐dependent quenching of chlorophyll a fluorescence in isolated chloroplasts. European Journal of Biochemistry 17: 319–327. [DOI] [PubMed] [Google Scholar]
- Zaks J, Amarnath K, Kramer DM, Niyogi KK, Fleming GR. 2012. A kinetic model of rapidly reversible nonphotochemical quenching. Proceedings of the National Academy of Sciences, USA 109: 15757–15762. [DOI] [PMC free article] [PubMed] [Google Scholar]
Associated Data
This section collects any data citations, data availability statements, or supplementary materials included in this article.
Supplementary Materials
Fig. S1 Nonphotochemical quenching extent and pH dependency in the Phaeodactylum tricornutum Pt1 and Pt4 ecotypes.
Fig. S2 The pH‐induced fluorescence quenching does not affect the Stern–Volmer relationship between nonphotochemical quenching and photosystem II photochemical quantum yield.
Fig. S3 Calibration of the luminal pH in Phaeodactylum tricornutum cells as a function of medium acidification.
Fig. S4 Ammonium chloride (NH4Cl) sensitivity of nonphotochemical quenching in Phaeodactylum tricornutum cells.
Fig. S5 KEA mid‐point rooted phylogeny inferred using maximum likelihood analysis.
Fig. S6 Molecular characteristics of the knockout (KO) mutant genotypes employed in this work.
Fig. S7 Specificity of the custom antibody against KEA3.
Fig. S8 Molecular and physiological characterization of the complemented kea3‐1/KEA3‐eGFP genotype.
Fig. S9 Consequences of nigericin concentrations on nonphotochemical quenching and photosynthetic electron flow in wild‐type (WT), kea3‐1 and kea3‐2 knockout (KO) mutants and kea3‐1/KEA3‐eGFP complemented mutant.
Fig. S10 Light dependency of nonphotochemical quenching in wild‐type (WT), kea3‐1 and kea3‐2 kockout (KO) and kea3‐1/KEA3‐eGFP overexpressor (OE) genotypes.
Fig. S11 Nonphotochemical quenching transients in wild‐type (WT), kea3‐1 and kea3‐2 knockout (KO) mutants and kea3‐1/KEA3‐eGFP genotypes.
Fig. S12 Characterization of the proton motive force (PMF) in living cells of Phaeodactylum tricornutum.
Fig. S13 Nonphotochemical quenching features of the kea3‐1 and kea3‐2 knockout (KO) mutants compared to the wild‐type (WT) and kea3‐1/KEA3‐eGFP genotypes.
Methods S1 Detailed list of methods supplementary references.
Table S1 Accession number of proteins used in this study.
Table S2 List of primers used in this study.
Table S3 Parameters used in the model simulations.
Table S4 Nonphotochemical quenching features in response to high light (HL) and growth rates of Phaeodactylum tricornutum cells grown under different light and nutrient conditions.
Table S5 Protonophore sensitivity of nonphotochemical quenching in wild‐type (WT) cells grown in enriched seawater artificial water (ESAW) and f/2 media.
Please note: Wiley Blackwell are not responsible for the content or functionality of any Supporting Information supplied by the authors. Any queries (other than missing material) should be directed to the New Phytologist Central Office.
Data Availability Statement
The data supporting the findings of this study is available from the corresponding author upon reasonable request. All computational results are available on gitlab repository (https://gitlab.com/matuszynska/npq‐diatoms2020; doi: 10.5281/zenodo.5865038).