

Abstract
Aim
To test whether a screening approach with more flexible urinary albumin creatinine ratio (UACR) and estimated glomerular filtration rate (eGFR) thresholds would decrease screen failure rate without negatively impacting on the event rate and overall study duration.
Methods
We performed a post‐hoc analysis of the ALTITUDE trial. We selected participants randomized to placebo with a UACR of >300 mg/g and an eGFR between 30 mL/min/1.73 m2 and 60 mL/min/1.73 m2 at the first visit (pre‐screening) for the trial. We then used less stringent lower UACR and higher eGFR thresholds for the following qualifying visit. For each scenario we calculated the number of eligible participants, the number of renal and cardiovascular endpoints, and the event rates. Based on this, we performed simulations for a future trial and estimated the duration of enrolment and total duration of this trial.
Results
The base scenario consisted of 848 participants (median UACR 1239 mg/g; median eGFR 44 mL/min/1.73 m2). Lowering the UACR and/or raising eGFR qualification thresholds increased the number of eligible participants, decreased screen failures and resulted in only a modest decrease in renal and cardiovascular event rates. For example, relaxing the UACR criterion from 300 mg/g to 210 mg/g at the qualifying visit, increased the number of eligible patients from 848 to 923, and increased the number of renal events from 117 to 122 events. The event rate showed a moderate decrease from 5.6 (4.6‐6.7) events per 100 patient‐years to 5.3 (4.4‐6.4) events per 100 patient‐years. In simulations, lowering the UACR and raising eGFR thresholds for inclusion accelerated patient enrolment and did not increase in the overall trial duration.
Conclusion
More flexible albuminuria and eGFR‐based inclusion criteria, in participants who met the inclusion criteria of a trial based on pre‐screening values prior to the clinical trial, decreases screen failure rates and accelerated patient enrolment leading to more efficient trial conduct without impacting the overall trial duration.
Keywords: albuminuria, chronic kidney disease, clinical trial design, eGFR, screen failure
1. INTRODUCTION
Chronic kidney disease (CKD) is present in approximately 700 million people around the world and is associated with substantial morbidity and mortality. 1 Despite the high prevalence, there are few proven effective therapies to slow progressive kidney function loss. End‐stage kidney disease (ESKD) is used as a clinical endpoint in clinical trials of CKD progression. However, ESKD is a late manifestation of CKD which requires large trials of long duration to assess drug efficacy and safety. 2 Therefore, clinical trials typically enroll patients with high‐risk CKD in order for sufficient endpoints to occur within the clinical trial. 3
Low estimated glomerular filtration rate (eGFR) and high albuminuria are risk markers of CKD 4 , 5 , 6 and are commonly used in clinical trials to enrich the population with participants more likely to progress to ESKD. However, both albuminuria and eGFR (serum creatinine) show a substantial within‐patient day‐to‐day variation. 7 , 8 , 9 , 10 , 11 The high intraindividual variation in albuminuria and eGFR contributes to high screen failure rates in clinical trials. Screen failures, commonly defined as individuals who undergo screening but are not enrolled in a clinical trial, cause a waste of effort and time for participants and investigators. Novel strategies to reduce screen failures in order to improve efficiency of clinical trial conduct in nephrology would be very valuable.
The day‐to‐day variation in albuminuria and eGFR can be attributed to a combination of progression of underlying disease, day‐to‐day biological variation due to changes in exercise, diet or hydration status and medication adherence, and measurement variation. This random variation is unlikely to impact the patients' risk with regard to kidney outcomes. We hypothesized that the use of less stringent albuminuria and eGFR inclusion criteria, in participants who met the inclusion criteria of a trial based on pre‐screening values prior to the clinical trial, may reduce screen failure rates, without decreasing the event rate and statistical power of a clinical trial.
The aim of this study, therefore, was to determine whether a screening approach with less stringent albuminuria and eGFR thresholds would decrease the screen failure rate without adversely impacting on overall power and study duration of clinical trials.
2. METHODS
2.1. Patients and study design
We performed a post‐hoc analysis of the ALTITUDE trial. The ALTITUDE trial was a randomized, double‐blind, placebo‐controlled trial that included 8561 participants with type 2 diabetes at high risk of kidney or cardiovascular outcomes. The inclusion criteria of this study were useful for our analysis as it was enriched for albuminuria, but also allowed participants with lower levels of albuminuria to be randomized based on the presence of other risk factors. The study design and principal results of the ALTITUDE trial have been published elsewhere. 12 , 13
For our analysis we selected participants at the first study visit (pre‐screening), who were randomly assigned to placebo treatment. We selected patients with a urinary albumin creatinine ratio (UACR) >300 mg/g and an eGFR between 30 mL/min/1.73 m2 and 60 mL/min/1.73 m2. We then used more flexible cut‐offs stepwise at the next visit at 3 months (qualifying visit; Figure 1). We used three different strategies for inclusion at the qualifying visit: firstly, stepwise lowering of UACR cut‐offs at the qualifying visit (eg, ≥300 mg/g [base scenario], ≥210 mg/g, ≥150 mg/g, ≥30 mg/g); secondly, stepwise increasing of eGFR cut‐offs at the qualifying visit (eg, 30‐60 mL/min/1.73 m2 [base scenario], 30‐66 mL/min/1.73 m2, 30‐75 mL/min/1.73 m2, 30‐90 mL/min/1.73 m2, ≥30 mL/min/1.73 m2), and lastly, a combination of lowering UACR and increasing eGFR inclusion criteria at the qualifying visit (eg, UACR ≥300 mg/g and eGFR 30‐60 mL/min/1.73 m2 [base scenario]; UACR ≥270 mg/g and eGFR 30‐66 mL/min/1.73 m2; UACR ≥225 mg/g and eGFR 30‐75 mL/min/1.73 m2; UACR ≥150 mg/g and eGFR 30‐90 mL/min/1.73 m2; UACR ≥ 0 mg/g and eGFR ≥30). See also Figure 1 for the design of this study.
FIGURE 1.

Study design for optimal use of albuminuria as a response marker for clinical trials. At the pre‐screening visit patients were selected based on urinary albumin creatinine ratio (UACR; 300‐500 mg/g) and estimated glomerular filtration rate (eGFR; 30‐60 mL/min/1.73 m2). At the qualifying visit at 3 months several inclusion strategies were tested based on relaxing UACR, eGFR and a combination of those thresholds
2.2. Measurements
At each visit three consecutive first‐morning‐void urine samples were collected for measurement of urinary albumin and urinary creatinine to compute the UACR. UACR and serum creatinine were measured at a central laboratory at Week 0 (pre‐screening visit) and Week 12 (qualifying visit). The Modification of Diet in Renal Disease formula 14 was used to calculate the eGFR.
2.3. Outcomes
The endpoints used for this study were composite cardiovascular and kidney events, as originally defined in the ALTITUDE trial. 12 , 13 The cardiovascular endpoint was a composite of the first occurrence of any of the following: cardiac death; resuscitated cardiac arrest; nonfatal myocardial infarction; nonfatal stroke; and unplanned hospitalization for heart failure. The kidney endpoint was a composite endpoint consisting of a sustained doubling of serum creatinine, ESKD, or death due to kidney‐related cause. The composite kidney‐cardiovascular endpoint was a combination of the individual composite cardiovascular and kidney endpoints.
2.4. Statistical analysis and simulations
Baseline characteristics are presented as mean ± SD or median (interquartile range) for variables with a nonparametric distribution. Categorical baseline characteristics are shown as proportions. Baseline characteristics were those recorded at the pre‐screening visit and are shown for the total eligible population and stratified by albuminuria (UACR ≥300 mg/g and <300 mg/g) at the qualifying visit. Differences in baseline characteristics were tested with unpaired t‐tests, Mann‐Whitney U‐tests or χ 2 tests as appropriate. To determine the within‐individual variability over time in UACR and eGFR we calculated the coefficient of variation in the placebo arm of the ALTITUDE trial using the UACR and eGFR values collected at pre‐screening, Month 3 and Month 6.
For each scenario the number of eligible participants, the number of renal and cardiovascular events and the event rates were determined. Event rates were calculated as events per 100 patient‐years. We then used these event rates to calculate the duration of a future clinical trial using statistical simulations. In these simulations we designed a clinical trial with enrolment of 5220 participants assuming a 24‐month inclusion period and 36‐month follow‐up period. Under these conditions, a total of 961 endpoints provided 90% power to detect a 20% relative risk reduction. We calculated the duration of enrolment and total duration of the clinical trial to accrue 961 endpoints assuming three scenarios with screen failure rates of 40%, 50% or 60%. Using nonlinear modelling the chance of reaching an event was calculated iteratively for each patient using the scale and shape parameter of Weibull fit of the survival models created from each of the UACR and eGFR screening scenarios. Statistical analyses were performed using STATA 15SE (StataCorp LLC, College Station, Texas) and R (version 3.4). A two‐sided P value <0.05 was considered to indicate statistical significance.
3. RESULTS
3.1. Baseline characteristics
Of the 8561 participants included in the ALTITUDE trial, 995 participants were assigned to placebo and had albuminuria of >300 mg/g and eGFR ≥30 mL/min/1.73 m2 and <60 mL/min/1.73 m2 at the pre‐screening visit (Table 1). These participants were eligible for the present analysis. Baseline characteristics from the pre‐screening visit are shown in Table 1. The base scenario was defined by participants who had an UACR >300 mg/g at the pre‐screening and qualifying visit (Week 12) and consisted of 848 participants (85.2%; median UACR 1239 mg/g; median eGFR 44 mL/min/1.73 m2). A total of 147 participants (14.8%) had a UACR >300 mg/g at the pre‐screening visit and a UACR <300 mg/g at the qualifying visit. These participants were thus excluded in the base scenario but would become potentially eligible when more flexible inclusion scenarios were used. Baseline characteristics recorded at pre‐screening of the 147 participants are shown in Table 1. Participants with a UACR >300 mg/g at the qualifying visit had a higher median UACR at pre‐screening compared to patients with a UACR <300 mg/g. The other baseline characteristics were not statistically different in either of the groups (Table 1).
TABLE 1.
Baseline characteristics recorded at the pre‐screening visit of the total eligible ALTITUDE population and stratified by albuminuria at the qualifying visit
| Variables | Baseline population (n = 995) | UACR ≥300 mg/g at the qualifying visit (n = 848) | UACR <300 mg/g at the qualifying visit (n = 147) | P* |
|---|---|---|---|---|
| Age, years | 62.3 ± 9.7 | 62.0 ± 9.7 | 63.9 ± 9.1 | 0.98 |
| Female, % | 30.3 | 29.4 | 35.4 | 0.14 |
| UACR, mg/g | 1059.1 (572.8‐1966.1) | 1238.5 (694.8‐2143.3) | 477.4 (368.8‐722.2) | <0.001 |
| eGFR, mL/min/1.73 m2 | 44.5 ± 8.1 | 44.3 ± 8.0 | 45.6 ± 8.4 | 0.95 |
| Systolic BP, mmHg | 139.8 ± 16.2 | 140.0 ± 16.3 | 139.7 ± 16.0 | 0.48 |
| Diastolic BP, mmHg | 75.5 ± 9.9 | 75.4 ± 10.0 | 76.1 ± 9.7 | 0.79 |
| HbA1c, % | 7.9 ± 1.6 | 7.9 ± 1.6 | 7.8 ± 1.6 | 0.22 |
| BMI, kg/m2 | 29.4 ± 6.1 | 29.3 ± 6.0 | 30.1 ± 6.7 | 0.94 |
| LDL cholesterol, mmol/L | 2.7 ± 1.0 | 2.7 ± 1.1 | 2.7 ± 0.9 | 0.34 |
| HDL cholesterol, mmol/L | 1.2 ± 0.4 | 1.2 ± 0.4 | 1.2 ± 0.3 | 0.84 |
| History of cardiovascular disease, % | 29.1 | 29.5 | 27.2 | 0.58 |
| Current smoker, % | 14.3 | 14.6 | 12.2 | 0.45 |
| Current drinker, % | 9.9 | 9.7 | 11 | 0.63 |
Note: The eligible population (n = 995) comprised patients who had a UACR >300 mg/g and an eGFR ≥30 and <60 mL/min/1.73 m2 at the pre‐screening visit. Values are shown as mean ± SD, median (25th‐75th percentile) or percentage.
Abbreviations: BMI, body mass index; BP, blood pressure; eGFR, estimated glomerular filtration rate; HbA1c, glycated haemoglobin; HDL, high‐density lipoprotein; LDL, low‐density lipoprotein; UACR, urinary albuminuria‐creatinine ratio.
* P < 0.05 for UACR <300 mg/g at the qualifying visit vs. UACR >300 mg/g at the qualifying visit.
During follow‐up, the median within‐individual variation over time in UACR was 31.8% (25th‐75th percentile 19.3‐51.9) and the within‐individual variation in eGFR was 9.0% (25th‐75th percentile 5.6‐13.7).
3.2. Effect of more flexible inclusion criteria on renal and cardiovascular events and event rates
Lowering the UACR qualification threshold increased the number of eligible participants who would otherwise fail the screening (Table 2). For example, when applying a UACR criterion at the qualifying visit of 210 mg/g (30% decrease from 300 mg/g) 75 additional participants (51% of all screen failures) qualified (Table 2).
TABLE 2.
Effect of lower urinary albuminuria‐creatinine ratio cut‐offs at the qualifying visit on patient eligibility, number of events and event rates for the renal endpoint, cardiovascular endpoint and composite renal and cardiovascular endpoint
| UACR cut‐offs, mg/g | Eligible patients, N (decrease in screen failures %) | Renal endpoint | Cardiovascular endpoint | Composite endpoint | |||
|---|---|---|---|---|---|---|---|
| Events, N | Event rate, % per year | Events, N | Event rate, % per year | Events, N | Event rate, % per year | ||
| 300 | 848 | 117 | 5.6 (4.6‐6.7) | 112 | 5.3 (4.3‐6.4) | 207 | 10.2 (8.9‐11.7) |
| 210 | 923 (−51) | 122 | 5.3 (4.4‐6.4) | 122 | 5.3 (4.4‐6.3) | 221 | 10.0 (8.7‐11.4) |
| 150 | 958 (−75) | 126 | 5.3 (4.4‐6.3) | 124 | 5.2 (4.3‐6.2) | 226 | 9.9 (8.6‐11.3) |
| 30 | 988 (−95) | 129 | 5.3 (4.4‐6.3) | 128 | 5.2 (4.3‐6.2) | 233 | 9.9 (8.6‐11.2) |
| 0 | 995 (−100) | 129 | 5.2 (4.4‐6.2) | 130 | 5.2 (4.4‐6.2) | 235 | 9.9 (8.7‐11.2) |
Note: Event rates are reported as number of events per 100 patient‐years with Poisson confidence intervals.
Abbreviation: UACR, urinary albuminuria‐creatinine ratio.
Lowering the UACR inclusion criterion at the qualifying visit increased the total number of eligible patients and the number of cardiovascular and renal events, indicating that participants who would otherwise be screen failures contribute cardiovascular and renal events. By lowering the UACR inclusion criterion only a modest decrease in average renal and cardiovascular event rate was observed due to the inclusion of participants with lower UACR values (Table 2). For example, using a UACR criterion of 210 mg/g at the qualifying visit resulted in an increase in the number of eligible patients from 848 to 923, and an increase in renal events from 117 events to 122 events. The event rate showed a moderate decrease from 5.6 (4.6‐6.7) events per 100 patient‐years to 5.3 (4.4‐6.4) events per 100 patient‐years (Table 2).
We also tested whether increasing eGFR thresholds would influence the number of renal and cardiovascular events and event rates. Relaxing the eGFR criterion resulted in an increase in the number of eligible participants (Table 3) and a decrease in the number of screen failures, while it only resulted in a modest, decrease in average renal and cardiovascular event rates (Table 3).
TABLE 3.
Effect of higher estimated glomerular filtration rate cut‐offs at the qualifying visit on patient eligibility, number of events and event rates for the renal endpoint, cardiovascular endpoint and composite renal and cardiovascular endpoint
| eGFR cut‐offs, mL/min/1.73 m2 | Eligible patients N (decrease in screen failures %) | Renal endpoint | Cardiovascular endpoint | Composite endpoint | |||
|---|---|---|---|---|---|---|---|
| Events (N) | Event rate (% per year) | Events (N) | Event rate (% per year) | Events (N) | Event rate (% per year) | ||
| 30‐60 | 843 | 96 | 4.5 (3.7‐5.5) | 104 | 4.9 (4.0‐5.9) | 189 | 9.3 (8.0‐10.7) |
| 30‐66 | 890 (−55) | 100 | 4.5 (3.6‐5.4) | 112 | 5.0 (4.1‐6.0) | 199 | 9.2 (8.0‐10.6) |
| 30‐75 | 916 (−85) | 101 | 4.4 (3.6‐5.3) | 115 | 5.0 (4.1‐6.0) | 202 | 9.1 (7.9‐10.5) |
| 30‐90 | 921 (−91) | 101 | 4.4 (3.6‐5.3) | 115 | 5.0 (4.1‐6.0) | 202 | 9.1 (7.9‐10.4) |
| ≥ 30‐all | 929 (−100) | 102 | 4.4 (3.6‐5.3) | 115 | 4.9 (4.1‐5.9) | 203 | 9.0 (7.8‐10.4) |
Note: Event rates are depicted as number of events per 100 patient‐years with Poisson confidence intervals.
Abbreviation: eGFR, estimated glomerular filtration rate.
Similar results were observed when relaxing both eGFR and UACR thresholds in that the number of screen failures decreased without considerably affecting the renal or cardiovascular event rates (Table 4).
TABLE 4.
Effect of lower UACR (mg/g) and higher eGFR (1.73 mL/min/1.73 m2) at the qualifying visit on patient eligibility, number of events and event rates for the renal endpoint, cardiovascular endpoint and composite renal and cardiovascular endpoint
| Combined UACR and eGFR cut‐offs | Eligible patients, N (decrease in screen failures %) | Renal endpoint | Cardiovascular endpoint | Composite endpoint | |||
|---|---|---|---|---|---|---|---|
| Events (N) | Event rate (% per year) | Events (N) | Event rate (% per year) | Events (N) | Event rate (% per year) | ||
| 300 mg/g and 30‐60 mL/min/1.73 m2 | 726 | 87 | 4.8 (3.8‐5.9) | 92 | 5.0 (4.1‐6.2) | 168 | 9.6 (8.2‐11.2) |
| 270 mg/g and 30‐66 mL/min/1.73 m2 (−10%) | 790 (−32) | 93 | 4.7 (3.8‐5.7) | 102 | 5.1 (4.2‐6.2) | 182 | 9.5 (8.2‐11.0) |
| 225 mg/g and 30‐75 mL/min/1.73 m2 (−25%) | 842 (−57) | 96 | 4.5 (3.7‐5.6) | 108 | 5.1 (4.2‐6.2) | 190 | 9.3 (8.1‐10.8) |
| 150 mg/g and 30‐90 mL/min/1.73 m2 (−50%) | 889 (−80) | 98 | 4.4 (3.6‐5.4) | 110 | 4.9 (4.1‐5.9) | 194 | 9.0 (7.8‐10.4) |
|
≥0 mg/g and ≥30‐all mL/min/1.73 m2 |
929 (−100) | 102 | 4.4 (3.6‐5.3) | 115 | 4.9 (4.1‐5.9) | 203 | 9.0 (7.8‐10.4) |
Note: Event rates are depicted as number of events per 100 patient‐years with Poisson confidence intervals.
Abbreviations: eGFR, estimated glomerular filtration rate; UACR, urinary albuminuria‐creatinine ratio.
3.3. Effect of lowering UACR, eGFR or UACR/eGFR criteria on trial duration
We performed simulations to test whether relaxing inclusion criteria by decreasing UACR thresholds and/or increasing eGFR thresholds, resulted in a change in trial duration. We used the observed event rates in the ALTITUDE trial and the increase in the number of eligible participants when using less stringent UACR or eGFR inclusion criteria as inputs for statistical simulation (Figure 2). Reducing the UACR threshold for inclusion did not result in an increase in trial duration for the renal and cardiovascular endpoint. This was true for the three scenarios assuming a 40%, 50% or 60% screen failure rate (Figure 2A,B). Similarly, when using less stringent eGFR inclusion criteria (Figure 2C,D) or a combination of less stringent UACR and eGFR criteria (Figure 2E,F), no increase in trial duration was observed. The results were not different when we modelled a clinical trial using a composite cardiovascular and renal endpoint (Figure S1).
FIGURE 2.
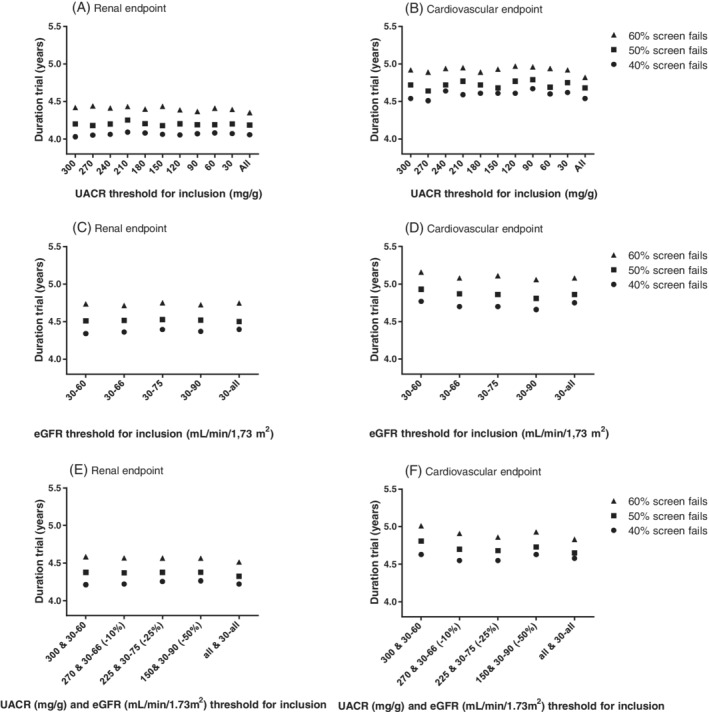
Effects of lowering urinary albumin creatinine ratio (UACR) inclusion criteria (A,B), increasing estimated glomerular filtration rate (eGFR) inclusion criteria (C,D) and more flexible UACR/eGFR criteria (E,F) on trial duration for the renal (A,C,E) and cardiovascular (B,D,F) endpoint
4. DISCUSSION
To improve clinical trials for progression of CKD we assessed the utility of a screening approach with more flexible albuminuria and eGFR thresholds to decrease screen failure rates, accelerate trial enrolment, and improve the feasibility of trial conduct. We observed that lowering of the albuminuria‐based and increasing of the eGFR‐based inclusion criteria, for participants who met the inclusion criteria of a trial based on pre‐screening values prior to the clinical trial, increases the number of eligible participants and decreases screen failure rates without the need to increase sample size or prolong trial duration. Our proposed approach thus simplifies enrolment of participants into a trial and increases efficiency of trial conduct.
The number of clinical trials undertaken in nephrology lags behind other therapeutic areas in medicine. 15 , 16 Moreover, clinical trials in nephrology compared to cardiology are often smaller, shorter in duration and less frequently involve clinically meaningful endpoints. 17 There are multiple reasons why trials in nephrology are less frequently undertaken, including lack of global clinical trial networks, higher than average adverse event rates, and endpoints being late manifestations of CKD progression, requiring large trials of long duration. In addition, screen failure rates in recent large kidney outcome trials are high, ranging between 45% and 60%. The high screen failure rates prolong clinical trial recruitment, increase costs and cause a waste of effort and time from participants and clinicians, which may temper interest in participating in future research. A large proportion of screen failures in clinical trials in nephrology are due to albuminuria and eGFR values not falling within the protocol‐specified range. 18 , 19 , 20 The high screen failure rate can be in part attributed to the large day‐to‐day variability in these laboratory variables. Indeed, in the ALTITUDE trial we found a within‐individual variability over time of 31.8% for albuminuria and 9.0% for eGFR. This variability was of similar magnitude to that observed in other studies. Waikar et al 10 , 11 reported a variability in eGFR of 6.5% and a variability in albuminuria of 32.5%. Another study in patients with type 2 diabetes with increased albuminuria reported a variability in albuminuria of 31.8%. 10 , 11 Removing trial inefficiencies such as reducing screen failure rates by simplifying inclusion criteria may thus help to stimulate clinical trials in nephrology.
It is important to note that simplifying trial procedures, including efforts to reduce screen failures, will reduce disappointment among participants and investigators and reduce wasted effort and time. Frequent screen failures can lead to frustration among site investigators and can decrease engagement and commitment. As site investigators can participate in multiple clinical trials, it is likely that they may choose to spend more time and effort on less complex and simpler trials. We did not capture this aspect in our simulations, which may have resulted in an underestimation of the efficiency gains and an overestimation of the trial duration when applying less stringent inclusion criteria.
Previous studies have shown that higher albuminuria levels are associated with a higher risk of developing kidney and cardiovascular outcomes. Clinical trials therefore enrich populations for participants with higher albuminuria and lower eGFR levels to collect sufficient endpoints within the 3‐ to 4‐year trial duration. One would expect that lowering the albuminuria threshold for inclusion in a clinical trial would dilute the risk profile of the population and reduce kidney and cardiovascular event rates. However, in our study, event rates only modestly decreased despite inclusion of participants with lower degrees of albuminuria. The likely explanation for this is that, in contrast to other studies, we selected a cohort of participants who had high albuminuria (UACR >300 mg/g) at a previous (pre‐screening) visit. The finding that the event rates only changed modestly supports the possibility that the lower albuminuria level at qualification was indeed at least in part explained by random day‐to‐day variation.
Optimizing and simplifying eligibility criteria for a clinical trial is only one of many approaches to facilitating patient enrolment and clinical trial conduct. 21 Several other approaches are also proposed. These include approaches to increase the willingness of patients to participate in a trial and removing barriers for participation such as less frequent site visits, implementing decentralized study procedures, and developing more efficient informed consent procedures. 22 Other strategies to promote clinical trial conduct include better use of electronic medical records to facilitate pre‐screening approaches, developing implementable study protocols, and considering novel biomarkers that assist in selecting optimal trial populations who are most likely to respond and tolerate the investigational drug. 23 Another approach to reducing screen failures would be to re‐screen patients who have a measurement outside the screening limits. However, this requires another visit for participants and greater effort from trial sites. Relaxing albuminuria‐ and eGFR‐based inclusion criteria is a simpler approach, which is also less burdensome for patients.
The disadvantage of using enrichment criteria, such as albuminuria and eGFR, for clinical trials is that it reduces the generalizability of the clinical trial. Some patients with normoalbuminuria may also progress towards kidney failure, as illustrated by studies that show that the prevalence of non‐albuminuric CKD is increasing. 24 , 25 , 26 However, patients with normoalbuminuria are often excluded from kidney outcome trials. Methods to identify patients with normoalbuminuria who are at risk of progression are needed. In this respect, novel biomarkers, such as tumor necrosis factor receptor (TNFR)‐1 and TNFR‐2, may help as they have been shown to predict kidney outcomes in patients with type 2 diabetes and normoalbuminuria. 27 , 28
This study has some limitations. First, the duration between a pre‐screening and qualifying visit in most trials in nephrology is 2 to 4 weeks whereas in our study we used a 3‐month period, which may have led to a larger variation in albuminuria than would be observed in practice. In addition, the analyses were performed post hoc. Future trials which have implemented the proposed strategy are ongoing (NCT03819153) and will test the utility of our proposed approach prospectively.
In conclusion, relaxing albuminuria‐ and eGFR‐based inclusion criteria for a clinical trial for participants who met these criteria based on pre‐screening values prior to the trial, decreases screen failure rates without prolonging trial duration. This approach may increase recruitment feasibility and enhance efficiency in the conduct of clinical trials.
AUTHOR CONTRIBUTIONS
Hiddo J. L. Heerspink: Conceptualization. Simke W. Waijer and Hiddo J. L. Heerspink: Data curation. Simke W. Waijer, Michele Provenzano, Skander Mulder and Hiddo J. L. Heerspink: Formal analysis. Hiddo J. L. Heerspink: Investigation. Simke W. Waijer, Michele Provenzano and Hiddo J. L. Heerspink: Writing – original draft. All authors: Writing – review and editing.
CONFLICT OF INTERESTS
S.W. Waijer, M. Provenzano and S. Mulder have nothing to disclose. P. Rossing has received research support and personal fees from AstraZeneca and Novo Nordisk, and personal fees from Eli Lilly and Company, Bayer, Boehringer Ingelheim, Astellas Pharma Inc., Gilead, Merck, Merck Sharp and Dohme, Sanofi and Vifor Pharma. All fees were given to the Steno Diabetes Centre Copenhagen. F. Persson has served as a consultant, on advisory boards or as educator for AstraZeneca, Novo Nordisk, Boehringer Ingelheim, Sanofi, Mundipharma, MSD, Novartis, Amgen and has received research grants to institution from Novo Nordisk, Boehringer Ingelheim, Amgen and AstraZeneca. V. Perkovic has received fees for advisory boards, steering committee roles, or scientific presentations from AbbVie, Astellas, AstraZeneca, Bayer, Baxter, Bristol‐Myers Squibb, Boehringer Ingelheim, Dimerix, Durect, Eli Lilly, Gilead, GlaxoSmithKline, Janssen, Merck, Mitsubishi Tanabe, Mundipharma, Novartis, Novo Nordisk, Pfizer, PharmaLink, Relypsa, Retrophin, Sanofi, Servier, Vifor and Tricida. H. J. L. Heerspink is supported by a VIDI (917.15.306) grant from the Netherlands Organization for Scientific Research and has served as a consultant for AbbVie, Astellas, AstraZeneca, Bayer, Boehringer Ingelheim, Chinook, CSL Pharma, Dimerix Fresenius, Goldfinch, Gilead, Janssen, Merck, Mundipharma, Mitsubishi Tanabe, NovoNordisk and Travere Pharmaceuticals; and has received grant support from AstraZeneca, Boehringer Ingelheim, Janssen and NovoNordisk.
PEER REVIEW
The peer review history for this article is available at https://publons.com/publon/10.1111/dom.14660.
Supporting information
Figure S1. Effects of more flexible UACR inclusion criteria, more flexible eGFR inclusion criteria and more flexible UACR/eGFR criteria on trial duration for the composite renal and cardiovascular endpoint.
Waijer SW, Provenzano M, Mulder S, et al. Impact of random variation in albuminuria and estimated glomerular filtration rate on patient enrolment and duration of clinical trials in nephrology. Diabetes Obes Metab. 2022;24(6):983-990. doi: 10.1111/dom.14660
DATA AVAILABILITY STATEMENT
We encourage investigators interested in data sharing and collaboration to contact the corresponding author.
REFERENCES
- 1. Webster AC, Nagler EV, Morton RL, Masson P. Chronic kidney disease. Lancet. 2017;389:1238‐1252. [DOI] [PubMed] [Google Scholar]
- 2. Levey AS, Gansevoort RT, Coresh J, et al. Change in albuminuria and GFR as end points for clinical trials in early stages of CKD: a scientific workshop sponsored by the National Kidney Foundation in collaboration with the US Food and Drug Administration and European Medicines Agency. Am J Kidney Dis. 2020;75:84‐104. [DOI] [PubMed] [Google Scholar]
- 3. Heerspink HJL, List J, Perkovic V. New clinical trial designs for establishing drug efficacy and safety in a precision medicine era. Diabetes Obes Metab. 2018;20:14‐18. [DOI] [PMC free article] [PubMed] [Google Scholar]
- 4. Roscioni SS, Lambers Heerspink HJ, De Zeeuw D. Microalbuminuria: target for renoprotective therapy PRO. Kidney Int. 2014;86:40‐49. [DOI] [PubMed] [Google Scholar]
- 5. Astor BC, Matsushita K, Gansevoort RT, et al. Lower estimated glomerular filtration rate and higher albuminuria are associated with mortality and end‐stage renal disease. A collaborative meta‐analysis of kidney disease population cohorts. Kidney Int. 2011;79:1331‐1340. [DOI] [PMC free article] [PubMed] [Google Scholar]
- 6. Fox CS, Matsushita K, Woodward M, et al. Associations of kidney disease measures with mortality and end‐stage renal disease in individuals with and without diabetes: a meta‐analysis. Lancet. 2012;380:1662‐1673. [DOI] [PMC free article] [PubMed] [Google Scholar]
- 7. Witte EC, Lambers Heerspink HJ, de Zeeuw D, Bakker SJL, de Jong PE, Gansevoort R. First morning voids are more reliable than spot urine samples to assess microalbuminuria. J Am Soc Nephrol. 2009;20:436‐443. [DOI] [PMC free article] [PubMed] [Google Scholar]
- 8. Naresh CN, Hayen A, Weening A, Craig JC, Chadban SJ. Day‐to‐day variability in spot urine albumin‐creatinine ratio. Am J Kidney Dis. 2013;62:1095‐1101. [DOI] [PubMed] [Google Scholar]
- 9. Selvin E, Juraschek SP, Eckfeldt J, Levey AS, Inker LA, Coresh J. Within‐person variability in kidney measures. Am J Kidney Dis. 2013;61:716‐722. [DOI] [PMC free article] [PubMed] [Google Scholar]
- 10. Petrykiv SI, de Zeeuw D, Persson F, et al. Variability in response to albuminuria‐lowering drugs: true or random? Br J Clin Pharmacol. 2017;83:1197‐1204. [DOI] [PMC free article] [PubMed] [Google Scholar]
- 11. Waikar SS, Rebholz CM, Zheng Z, et al. Biological variability of estimated GFR and albuminuria in CKD. Am J Kidney Dis. 2018;72:538‐546. [DOI] [PMC free article] [PubMed] [Google Scholar]
- 12. Parving HH, Brenner BM, McMurray JJV, et al. Aliskiren trial in type 2 diabetes using cardio‐renal endpoints (ALTITUDE): rationale and study design. Nephrol Dial Transplant. 2009;24:1663‐1671. [DOI] [PubMed] [Google Scholar]
- 13. Parving H‐H, Brenner BM, McMurray JJV, et al. Cardiorenal end points in a trial of Aliskiren for type 2 diabetes. N Engl J Med. 2012;367:2204‐2213. [DOI] [PubMed] [Google Scholar]
- 14. Levey AS, Bosch JP, Lewis JB, Greene T, Rogers N, Roth D. A more accurate method to estimate glomerular filtration rate from serum Creatinine: a new prediction equation. Ann Intern Med. 1999;130:461‐470. [DOI] [PubMed] [Google Scholar]
- 15. Palmer SSC, Sciancalepore M, Strippoli GGFM. Trial quality in nephrology: how are we measuring up? Am J Kidney Dis. 2011;58:335‐337. [DOI] [PubMed] [Google Scholar]
- 16. Strippoli GFM, Craig JC, Schena FP. The number, quality, and coverage of randomized controlled trials in nephrology. J Am Soc Nephrol. 2004;15:411‐419. [DOI] [PubMed] [Google Scholar]
- 17. Inrig JK, Califf RM, Tasneem A, et al. The landscape of clinical trials in nephrology: a systematic review of clinicaltrials.gov. Am J Kidney Dis. 2014;63:771‐780. [DOI] [PMC free article] [PubMed] [Google Scholar]
- 18. Perkovic V, Jardine MJ, Neal B, et al. Canagliflozin and renal outcomes in type 2 diabetes and nephropathy. N Engl J Med. 2019;380:2295‐2306. [DOI] [PubMed] [Google Scholar]
- 19. Heerspink HJL, Parving H‐H, Andress DL, et al. Atrasentan and renal events in patients with type 2 diabetes and chronic kidney disease (SONAR): a double‐blind, randomised, placebo‐controlled trial. Lancet. 2019;393:1937‐1947. [DOI] [PubMed] [Google Scholar]
- 20. Pollock C, Stefánsson B, Reyner D, Rossing P, Sjöström CD, Wheeler DC, Langkilde AM, Heerspink HJL. Albuminuria‐lowering effect of dapagliflozin alone and in combination with saxagliptin and effect of dapagliflozin and saxagliptin on glycaemic control in patients with type 2 diabetes and chronic kidney disease (DELIGHT): a randomised, double‐blind, placebo‐controlled trial. The Lancet Diabetes & Endocrinology. 2019;7(6):429‐441. 10.1016/s2213-8587(19)30086-5 [DOI] [PubMed] [Google Scholar]
- 21. Fogel DB. Factors associated with clinical trials that fail and opportunities for improving the likelihood of success: a review. Contemp Clin Trials Commun. 2018;11:156‐164. [DOI] [PMC free article] [PubMed] [Google Scholar]
- 22. Natale P, Gutman T, Howell M, et al. Recruitment and retention in clinical trials in chronic kidney disease: report from national workshops with patients, caregivers and health professionals. Nephrol Dial Transplant. 2020;35:755‐764. [DOI] [PubMed] [Google Scholar]
- 23. Waksman R, Bakris GL, Steinvil A, et al. High screen failure rate in patients with resistant hypertension: findings from SYMPLICITY HTN‐3. Am Heart J. 2017;192:76‐84. [DOI] [PubMed] [Google Scholar]
- 24. Afkarian M, Zelnick LR, Hall YN, et al. Clinical manifestations of kidney disease among US adults with diabetes, 1988‐2014. JAMA. 2016;316:602‐610. [DOI] [PMC free article] [PubMed] [Google Scholar]
- 25. Pavkov ME, Hanson RL, Knowler WC, Bennett PH, Krakoff J, Nelson RG. Changing patterns of type 2 diabetes incidence among Pima Indians. Diabetes Care. 2007;30:1758‐1763. [DOI] [PubMed] [Google Scholar]
- 26. Alicic RZ, Rooney MT, Tuttle KR. Diabetic kidney disease. Clin J Am Soc Nephrol. 2017;12:2032‐2045. [DOI] [PMC free article] [PubMed] [Google Scholar]
- 27. Yamanouchi M, Skupien J, Niewczas MA, et al. Improved clinical trial enrollment criterion to identify patients with diabetes at risk of end‐stage renal disease. Kidney Int. 2017;92:258‐266. [DOI] [PMC free article] [PubMed] [Google Scholar]
- 28. Waijer S, Sen T, Arnott C, et al. Association between TNF receptors and KIM‐1 with kidney outcomes in early‐stage diabetic kidney disease. Clin J Am Soc Nephrol. 2022;17(2):251‐259. [DOI] [PMC free article] [PubMed] [Google Scholar]
Associated Data
This section collects any data citations, data availability statements, or supplementary materials included in this article.
Supplementary Materials
Figure S1. Effects of more flexible UACR inclusion criteria, more flexible eGFR inclusion criteria and more flexible UACR/eGFR criteria on trial duration for the composite renal and cardiovascular endpoint.
Data Availability Statement
We encourage investigators interested in data sharing and collaboration to contact the corresponding author.