

Abstract
Epilepsy is a severe neurological disease manifested by spontaneous recurrent seizures due to abnormal hyper‐synchronization of neuronal activity. Epilepsy affects about 1% of the population and up to 40% of patients experience seizures that are resistant to currently available drugs, thus highlighting an urgent need for novel treatments. In this regard, anti‐inflammatory drugs emerged as potential therapeutic candidates. In particular, specific molecules apt to resolve the neuroinflammatory response occurring in acquired epilepsies have been proven to counteract seizures in experimental models, and humans. One candidate investigational molecule has been recently identified as the lipid mediator n‐3 docosapentaenoic acid‐derived protectin D1 (PD1n‐3DPA) which significantly reduced seizures, cell loss, and cognitive deficit in a mouse model of acquired epilepsy. However, the mechanisms that mediate the PD1n‐3DPA effect remain elusive. We here addressed whether PD1n‐3DPA has direct effects on neuronal activity independent of its anti‐inflammatory action. We incubated, therefore, hippocampal slices with PD1n‐3DPA and investigated its effect on excitatory and inhibitory synaptic inputs to the CA1 pyramidal neurons. We demonstrate that inhibitory drive onto the perisomatic region of the pyramidal neurons is increased by PD1n‐3DPA, and this effect is mediated by pertussis toxin‐sensitive G‐protein coupled receptors. Our data indicate that PD1n‐3DPA acts directly on inhibitory transmission, most likely at the presynaptic site of inhibitory synapses as also supported by Xenopus oocytes and immunohistochemical experiments. Thus, in addition to its anti‐inflammatory effects, PD1n‐3DPA anti‐seizure and neuroprotective effects may be mediated by its direct action on neuronal excitability by modulating their synaptic inputs.
Keywords: antiepileptic mechanism, GABAA receptors, mouse hippocampus, PD1n‐3DPA , perisomatic inhibition
Abbreviations
- aCSF
artificial cerebrospinal fluid
- AMPA
α‐amino‐3‐hydroxy‐5‐methyl‐4‐isoxazolepropionic acid
- AP‐5
(2R)‐2‐Amino‐5‐phosphonopentanoic acid
- ASDs
antiseizure drugs
- BBB
blood‐brain barrier
- CA
cornus ammonis
- CTZ
cyclothiazide
- DHA
docosahexaenoic acid
- EPA
eicosapentaenoic acid
- GABA
gamma aminobutyric acid
- GPCR
G‐protein coupled receptor
- HRP
horseradish peroxidase
- IL‐1β
interleukin 1β
- NBQX
6‐nitro‐2,3‐dioxo‐1,2,3,4‐tetrahydrobenzo[f]quinoxaline‐7‐sulfonamide
- OR
oocyte ringer
- PD1n‐3DPA
n‐3 docosapentaenoic acid‐derived protectin D1
- PFA
paraformaldehyde
- PTX
pertussis toxin
- PUFAs
poly unsaturated fatty acids
- ROD
relative optic densities
- s(m)I(E)PSCs
spontaneous (miniature) inhibitory (excitatory) post‐synaptic currents
- TLE
temporal lobe epilepsy
- TNF
tumor necrosis factor
1. INTRODUCTION
Epilepsy is one of the most common and devastating neurological disorders affecting about 1% of the world population. Available antiseizure drugs (ASDs) are mainly providing symptomatic relief and fail to adequately control seizures in about 40% of patients. Alternative treatments include surgical removal of the seizure focus, vagal nerve, and deep brain stimulations, as well as dietary supplementation such as ketogenic or PUFAs‐enriched diet. 1 However, these treatments offer variable efficacy outcomes and surgery can be proposed only to a restricted number of patients. 2 Therefore, there is a high demand to develop novel treatments for epilepsy based on a better knowledge of the pathogenic mechanisms underlying seizures.
Neuroinflammation has been described as a common pathogenic mechanism promoting seizures in animal models of acquired epilepsy, and common forms of human drug‐resistant epilepsy. 3 Pharmacological interventions with specific anti‐inflammatory drugs provided evidence in support of a pivotal involvement of cytokines, chemokines, complement factors, and prostaglandins, in seizure generation and recurrence. 4 Notably, inflammatory molecules contribute to increasing neuronal network excitability by various mechanisms, which include modulation of synaptic transmission, 5 , 6 changes in blood‐brain barrier (BBB) permeability, consequent excitatory synaptogenesis, 7 and alterations in glial cell function. 8 Altogether, these changes lead to pathophysiological de‐regulation of neuronal networks promoting hyper‐synchronization and seizures. 3 , 5 , 9 It has been proposed that neuroinflammation in epilepsy persists due to inefficient engagement of resolving mechanisms, as supported by evidence that anti‐inflammatory agents decrease seizures by reducing neuroinflammation. 3
Endogenous pro‐resolving systems operate both in peripheral tissue and CNS and include various proteins and key lipid mediators derived from n‐3 PUFAs such as lipoxins, resolvins, protectins, and maresins. 10 One such resolving molecule has been recently identified by us as n‐3 docosapentaenoic acid‐derived protectin D1 (PD1n‐3DPA), which increases to an insufficient extent in the hippocampus of mice developing epilepsy. 6 In fact, supplementation of PD1n‐3DPA during epilepsy development by its intracerebroventricular injection, reduced recurrent spontaneous seizures as well as mRNA levels of IL‐1β and TNF ictogenic cytokines. Comorbidities, such as weight loss and impaired cognitive function were also ameliorated. Although the resolution of neuroinflammation by PD1n‐3DPA is likely involved in its therapeutic effects, this lipid mediator might also affect network excitability and synaptic transmission by yet unknown direct mechanisms. In support, there is evidence that n‐3 PUFAs (such as EPA, DHA) decrease evoked hippocampal neuronal excitability in brain slices. 11 , 12
To address this hypothesis, we incubated naïve mouse hippocampal slices with PD1n‐3DPA and investigated its effect on excitatory and inhibitory synaptic drive onto the pyramidal neurons of the CA1 region. We demonstrate that PD1n‐3DPA increases inhibitory synaptic drive onto the pyramidal neurons mediated by GPCRs and thereby may counteract the increased excitability of hippocampal network resulting in seizure inhibition.
2. MATERIALS AND METHODS
2.1. Animals
Mice with C57BL/6 background were bred and housed (5 mice/cage) in the SPF facility at a constant room temperature (23°C) and relative humidity (60 ± 5%) with free access to food and water, and with a fixed 12 h light/dark cycle. All experiments were approved and conducted according to the Lund/Malmö experimental animal committee ethical permits 02998/2020 and M47‐15.
2.2. PD1n‐3DPA solution preparation
For electrophysiology in slices or Xenopus oocytes, as well as for GABAAR immunohistochemistry, the PD1n‐3DPA (10 mM in ethanol) was kept at −80° until the experiment was started. Immediately before the incubation, the ethanol was evaporated with nitrogen gas and the compound was solubilized in 450 µl artificial cerebrospinal fluid (aCSF) for experiments in slices (118 mM NaCl, 2 mM MgCl2, 2 mM CaCl2, 2.5 mM KCl, 26 mM NaHCO3, 1.25 mM NaH2PO4, and 10 mM D‐glucose) or in Barth's solution (88 mM NaCl, 1 mM KCl, 2.4 mM NaHCO3, 10 mM HEPES, 0.82 mM MgSO4, 0.33 mM Ca(NO3)2, 0.41 mM CaCl2) for experiments in oocytes to yield a 10 nM solution, which was immediately used.
2.3. Mouse hippocampal slice electrophysiology
After weaning, 3–10 weeks‐old mice (n = 21) were anesthetized with isoflurane, sacrificed, and the brains were quickly removed and subsequently processed in ice‐cold aCSF. The cerebellum was removed, and 300‐µm horizontal slices were cut with a Leica 1200S VT vibratome, typically between 900 and 1800 µm from the ventral part of the brain.
Two to three slices containing the ventral hippocampus were prepared for electrophysiology. The slices (containing the posterior part of both hemispheres) were further dissected into two smaller slices of the hippocampus and peri‐hippocampal areas, with a sagittal‐plane cut medially to the outer shell of the dentate gyrus (Figure 1). This was done to enable easier transport between chambers, reduce the glucose and oxygen demands, as well as metabolite accumulation during incubation in the limited volume chamber.
FIGURE 1.
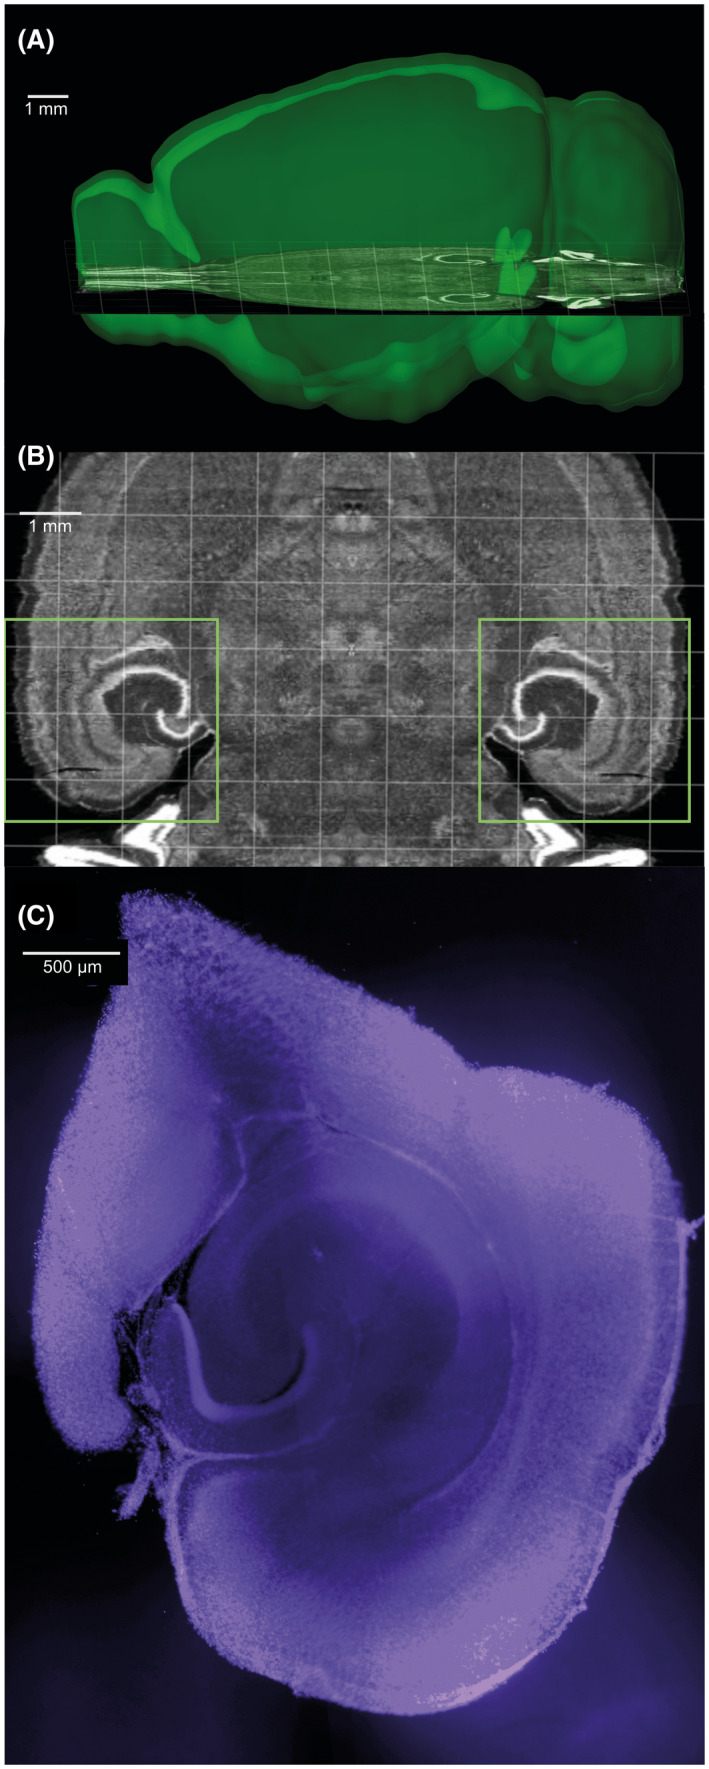
Images illustrating hippocampal slicing. (A and B) Approximate slicing location, according to the Allen Mouse Brain Atlas. Squares in B indicate the area of the slices kept. Images generated with the Allen Institute Brain Explorer 2 software, using the Allen Mouse Brain Atlas. (C) Example of slice section after electrophysiology (DAPI staining in blue)
From each animal, one or two slices (per condition) were incubated at room temperature (20° C) for 1 h in a small volume interface‐type chamber with 225 µl of aCSF, either with 10 nM PD1n‐3DPA or vehicle (aCSF). The Gi protein inhibitor pertussis toxin (PTX, Tocris), 1 µg/ml was added together with PD1n‐3DPA in a subset of slices. Preincubation of slices was preferred in this case, as opposed to perfusion with drug‐containing solutions in the recording chamber, because of the limited availability of the PD1n‐3DPA compound, which also prompted the necessity of small incubation volumes.
2.4. Hippocampal slice electrophysiology
After incubation, slices were transferred to a submerged recording chamber constantly perfused with oxygenated aCSF and maintained at 34°C. Glass pipettes were pulled from thick‐wall Stoelting (ID/OD 0.75/1.50) or King Precision borosilicate glass (ID/OD 0.86/1.50) capillaries on a Sutter P‐97 puller and filled with a pipette solution containing CsCl 135 mM, NaCl 8 mM, CsOH EGTA 0.2 mM, CsOH HEPES 10 mM, MgATP 2 mM, Na3GTP 0.3 mM, QX‐314 5 mM, and 0.2% biocytin. Pipette resistance was within 2–5 MOhm.
Spontaneous and miniature post‐synaptic currents (PSCs) were recorded at 10 kHz, after a 3 kHz antialiasing Bessel filter, in gap‐free mode, from mid‐distal CA1 pyramidal neurons, voltage‐clamped at −70 mV, with either NBQX 5 µM/AP5 50 µM or PTX 100 µM in the perfusion medium. A HEKA EPC9 and HEKA Patchmaster v13.52 for Apple macOS was used for acquisition.
Post‐synaptic currents were detected with the correlation coefficient method 13 and analyzed using Intel Python 3.6 under Windows 10 (code available, see 14 ). Events were selected if their correlation coefficient with a double exponential fit of averaged post‐synaptic currents exceeded 0.6, with an amplitude greater than 3 pA (amplifier noise floor), 20%–80% rise time less than 5 ms, and halfwidth greater than the rise time, to exclude potential artifacts.
After filtering, the following numbers of events were analyzed. sIPSCs (spontaneous inhibitory post‐synaptic currents): 8 ctrl and 9 PD1n‐3DPA incubated cells with 545 events each, mIPSCs (miniature inhibitory post‐synaptic currents): 5 ctrl and 8 PD1n‐3DPA incubated cells with 929 events each, sEPSCs (spontaneous excitatory post‐synaptic currents): 9 ctrl and 9 PD1n‐3DPA incubated cells with 646 events each, mEPSCs (miniature excitatory post‐synaptic currents): 8 ctrl and 8 PD1n‐3DPA incubated cells with 357 events each. For the rise time classification of fast and slow events, to ensure that we applied a threshold where ratio changes were approximately equal between groups and locally stable, thus not artificially inflating one of the categories, we applied the following steps:
For all possible cut‐off rise‐time values, τc in δτ intervals, where δ denotes the minimum discrete difference,
we calculate the ratio, , of counts of observed rise‐times slower‐than to faster‐than τc,
and select the minimum τc where the rates of change of for the 2 groups are equal or approximately equal, after the rs:f spike at the beginning of the τc range:
δτ = 100 µs (sampling rate limit).
The derivatives were plotted in logarithmic scale as , to facilitate peak identification (not shown).
2.5. Xenopus oocyte electrophysiology
The solutions used for the oocyte electrophysiology experiments were prepared as follows. Oocyte ringer (OR) solution contained (in mM): NaCl 82.5; KCl 2.5; CaCl2 2.5; MgCl2 1; HEPES 5, adjusted to pH 7.4 with NaOH. Barth's solution contained (in mM): NaCl, 88, KCl, 1, NaHCO3, 2.4, HEPES, 10, MgSO4, 0.82, Ca(NO3)2, 0.33, CaCl2 0.41.
GABA, AMPA, and cyclothiazide (CTZ) were purchased from Tocris (Bristol, UK). Salts for experimental solutions were purchased from Sigma–Aldrich (Merck Life Sciences, Milano, Italy).
Human hippocampal membranes were extracted from 3 patients who underwent surgery for drug‐resistant temporal lobe epilepsy (TLE). Human tissue was obtained as previously published 9 and used in accordance with the Declaration of Helsinki. The Ethics Committee of the University of Rome “Sapienza” approved the technical procedures. Informed consent was obtained from all individuals involved in this study.
The preparation of membranes and the injection procedures into Xenopus oocytes have been previously described. 15 , 16 Xenopus oocytes were harvested and prepared as described previously. 9 , 15 In the experiments, a total of seven Xenopus laevis frogs have been used. Animal protocols were approved by the Italian Ministry of Health (authorization no. 427/2020‐PR). Twelve to 48 h after membrane injection, the oocytes were placed in a recording chamber (volume, 0.1 ml) and perfused continuously, 9–10 ml/min, with OR at room temperature (20–22 °C). The membrane currents were recorded from voltage‐clamped oocytes using two microelectrodes filled with 3 M KCl. 15 GABA was applied at a final concentration of 500 µM for 4 s, AMPA was applied at 25 µM for 10 s, while oocytes were pretreated for 20 s with CTZ (25 µM). Neurotransmitters were freshly dissolved for each experiment.
PD1n‐3DPA was applied to the incubation chamber for 5 min to 3 h or PD1n‐3DPA was directly pressure‐injected into the oocytes (intracellular injection in filtered glycine 5 mM) with a glass micro‐pipette. 16
2.6. GABAA receptor Immunohistochemistry
Four male C57BL/6 mice, 11‐ to 16‐week‐old were used. Mice were decapitated and their brain removed from the skull. The brain was immediately immersed into ice‐cold oxygenated aCSF (95% O2/5% CO2), pH = 7.2 (Tocris Bioscience, Wiesbaden, Germany; 127 mM NaCl, 1.0 mM KCl, 1.2 mM KH2PO4, 26 mM NaHCO3, 2.4 mM CaCl2, 1.3 mM MgCl2). Brains were cut upside down in a Vibroslicer (Leica Microsystems VT1000S). From each mouse, five to six horizontal 400 µm sections of the ventral hippocampus were obtained. The sections were separated by hemisphere and about six sections from the left and six sections from the right hemisphere for each mouse brain were placed into individual wells. Three representative sections of the ventral hippocampus were selected from each hemisphere.
The slices were transferred to a 12‐well plate, each well containing 225 µl freshly prepared PD1n‐3DPA solution or vehicle in oxygenated aCSF (3 sections/condition). The sections were incubated at room temperature for 60 min, then transferred to 12‐well plates containing PBS for 15 min, and to 4% paraformaldehyde (PFA) for 16 h. Finally, the sections were rinsed twice with PBS for 15 min and subsequently immersed into 20% sucrose for two subsequent 30 min epochs. Sections were kept in sucrose at 4–6°C for 3 days, then cut in a cryostat.
From each of 400 µm‐vibratome sections, three to five anatomically intact 40 µm microtome slices were kept in PBS containing 0.01% sodium azide at 4°C and used for immunofluorescence.
2.7. Immunofluorescence analysis
Immunofluorescence was performed as described previously. 17 In brief, two slices from each hippocampal section were incubated free‐floating with 10% normal goat serum to reduce background (GIBCO #16210‐072, obtained through Fisher Scientific, Vienna, Austria) in Tris‐HCl‐buffered saline (TBS; 50 mm), pH 7.2, containing 0.4% Triton X‐100 (TBS‐Triton) for 90 min, followed by incubation with respective to a rabbit antibody raised against a 7His‐fusion protein of amino acids 316–352 of the γ2 subunit of the rat GABA receptor protein with maltose‐binding protein (final concentration 1 µg/ml 18 at room temperature for 16 h, followed by washing with TBS‐Triton). 19 Then, slices were incubated with HRP‐coupled donkey anti‐rabbit secondary antibody (1:500; catalog #711035152, Jackson ImmunoResearch; RRID:AB_10015282) at room temperature for 120 min and then reacted with TSA‐Cy3 (homemade; Lumiprobe; 1:100 in 50 mm PBS and 0.005% H2O2) at room temperature for 5 min. Sections were mounted on slides and covered using Vectashield mounting medium (Vector Laboratories, Inc., Burlingame, USA).
2.8. Determination of relative optic densities (ROD)
The sections were analyzed using a fluorescence microscope. We took black and white images of the hippocampus at 25X magnification revealing images with bright immunoreactive areas and dark backgrounds. The images were evaluated using the Fiji/ImageJ program. 20 We determined gray values within strata oriens and radiatum CA1 and CA3, the stratum lacunosum‐moleculare CA1, and the dentate molecular layer within representative areas (using a circular selection tool). As background levels, we defined gray values obtained in the hilus of the dentate gyrus of the same sections containing no immunoreactivity. After deducting these backgrounds, gray values were converted to relative optic densities (ROD) using the formula ROD = log10(256/(255‐grey value)).
2.9. Calculation of mean RODs
From each mouse, three 400 µm vibratome sections had been taken and immunoreactivity was determined in two 40 µm cryotome sections obtained from each vibratome section. First, ROD values obtained from the two 40 µm cryotome sections were averaged (each value representing one vibratome section). Then, the mean ROD values were calculated from the corresponding three vibratome sections (obtained from the same mouse). The resulting values represented the RODs of the individual mice. These were averaged (four PD1n‐3DPA incubated vs. four aCSF incubated).
2.10. Statistics
Results are presented as mean ± standard error of the mean.
The electrophysiology data are depicted in bar‐whisker plots as the median, range, and individual data points of average values per cell, unless otherwise indicated. Mann‐Whitney U test was used to compare groups and the Kolmogorov‐Smirnov test for Empirical Cumulative Distribution comparisons. The differences were considered as statistically significant with a p‐value <.01, and D‐value >.05. Fisher's exact test was used for the analysis of proportion changes.
For the slice incubation and immunohistochemistry experiment, statistics were done by Student's t‐test. Differences between groups were considered significant for values of p < .05.
3. RESULTS
3.1. PD1n‐3DPA enhances inhibitory synaptic inputs to CA1 pyramidal neurons
Incubation with PD1n‐3DPA increased inhibitory drive onto pyramidal neurons as revealed by decreased interevent interval (IEI) of sIPSCs in cumulative probability curves (Figure 2A) and increased cell‐based average frequency of sIPSCs (Figure 2A insert, Table 1). The mIPSCs, however, showed decreased IEI but no change in cell‐based average frequency (Figure 2B insert). The amplitude of sIPSCs and mIPSCs showed an increase after PD1n‐3DPA exposure only when analyzed by cumulative probability distributions but failed to demonstrate significant differences when cell‐based mean values were compared (Figure 2C,D inserts). Representative traces of spontaneous (s)‐ and miniature (m)IPSCs are presented in Figure 2G. These data indicate that the most pronounced changes occurred in sIPSC frequencies, as confirmed by both distribution and cell‐average analysis, while other changes were only apparent by distribution analysis and not by cell‐based averages. Thus, we conclude that PD1n‐3DPA exposure affected predominantly the frequency, and to a lesser extent the amplitude of the sIPSCs. Taken together, these data would support that most of the PD1n‐3DPA‐induced changes occurred in the presynaptic site of inhibitory synapses. 21
FIGURE 2.
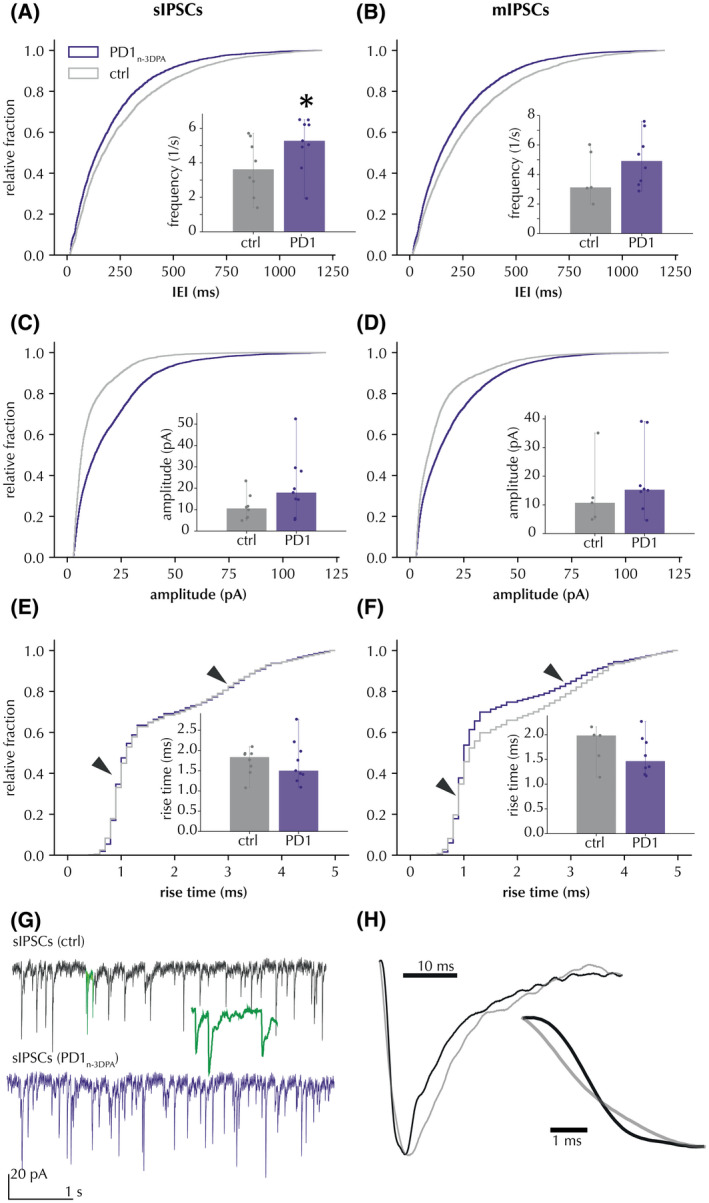
PD1n‐3DPA incubation increases the frequency and amplitude of IPSCs recorded in CA1 pyramidal neurons. (A) sIPSC interevent interval (IEI) presented as cumulative probability curves (Kolmogorov‐Smirnov test D = .098, p < .01) and cell‐based averages (insert) of sIPSC frequency. (B) mIPSCs, same presentation as (A), IEI (Kolmogorov‐Smirnov test D = .102, p < .01) and average frequencies. (C and D) sIPSC and mIPSC amplitudes, respectively, presented as cumulative probability curves (Kolmogorov‐Smirnov test sIPSCS: D = .272, p < .01; mIPSCs: D = .181, p < .01) and cell‐based averages (insert). (E and F) Rise‐times of sIPSCs and mIPSCs, respectively, presented as cumulative probability curves (Kolmogorov‐Smirnov test sIPSCS: D = .029, p > .01; mIPSCs: D = .101, p < .01) and cell‐based averages (inserts). Arrows denote 2 distinct distribution peaks around 1 and 3 ms. Insets display the median and range of cell averages. * Mann‐Whitney p < .05 for cell averages. (G) representative traces of sIPSCs with and without PD1n‐3DPA. Highlighted segment (green) shows 10‐fold time‐stretched recording. (H) magnification of amplitude‐normalized averaged fast (black) and slow (grey) rise‐time events in cells from control slices (n = 125 sIPSCs per group)
TABLE 1.
Frequency and amplitude comparison of cell‐averaged IPSCs between control and PD1n‐3DPA‐treated slices
| Frequency (1/s) | Amplitude (pA) | |||
|---|---|---|---|---|
| sIPSCs | mIPSCs | sIPSCs | mIPSCs | |
| Vehicle | 3.717 ± 0.536, n = 8 (7) | 3.949 ± 0.695, n = 5 (5) | 11.266 ± 2.048, n = 8 (7) | 13.804 ± 4.926, n = 5 (5) |
| PD1n‐3DPA | 5.143 ± 0.476, n = 9 (6) | 5.048 ± 0.595, n = 8 (5) | 20.98 ± 4.541, n = 9 (6) | 19.133 ± 4.263, n = 8 (5) |
| Mann–Whitney U test p | 0.046 | 0.171 | 0.068 | 0.136 |
Numbers of animals in parentheses.
A similar analysis for IPSCs was also applied to excitatory post‐synaptic currents (EPSCs) (Figure 3). The results showed no statistically significant changes neither for cumulative probability curves (both for sEPSCs, nor for mEPSCs, respectively), nor for cell‐based averaged comparisons of IEI (Figure 3A,B). Similarly, there was no significant effect on sEPSC amplitudes (Figure 3C). There was a minor increase in mEPSC amplitudes according to the Kolmogorov‐Smirnov test (with D = .089) which was not confirmed by cell‐based average analysis (Figure 3D). Also, sEPSC kinetics were unchanged (Figure 3E), while some minor changes in distributions were detected for mEPSCs in the Kolmogorov‐Smirnov test (D = .062). Overall, incubation of hippocampal slices with PD1n‐3DPA had no effect on sEPSCs and minor, if any effect, on mEPSCs. These minor changes in mEPSCs were negligible as compared to those for IPSCs (see Table 2).
FIGURE 3.
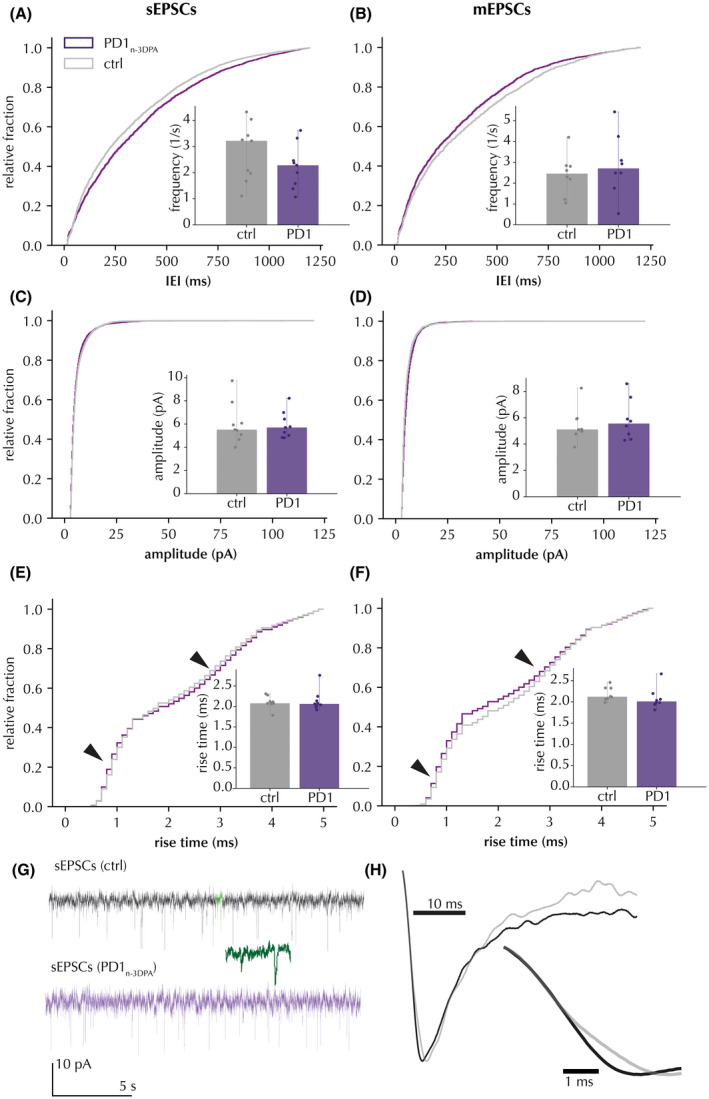
Effect of PD1n‐3DPA incubation on EPSCs recorded in CA1 pyramidal neurons. (A and B) sEPSCs and mEPSCs, respectively, are presented as cumulative probability curves for IEI (sEPSCs: Kolmogorov‐Smirnov test D = .014, p < .01; mEPSCs: D = .045, p < .01) and cell‐based averages for sEPSC frequencies (inserts). (C and D) sEPSCs and mEPSCs, respectively, are presented as cumulative probability curves (sEPSCs: Kolmogorov‐Smirnov test D = .045, p < .01; mEPSCs: D = .089, p < .01) for amplitudes and cell‐based averages (inserts). (E and F) sEPSC and mEPSC rise‐times, respectively, are presented as cumulative probability curves (sEPSCs: Kolmogorov‐Smirnov test D = .028, p > .01; mEPSCs: D = .062, p < .01) and cell‐based averages. Insets display the median and range of cell average. Arrows denote much less pronounced peaks as compared to those in Figure 1. (G) representative traces with and without PD1n‐3DPA. Highlighted segment (green) shows 10‐fold time‐stretched recording. (H) magnification of amplitude‐normalized averaged fast (black) and slow (grey) rise‐time events in cells from control slices (n = 42 sEPSCs per group)
TABLE 2.
Frequency and amplitude comparison of cell‐averaged EPSCs between control and PD1n‐3DPA‐treated slices
| Frequency (1/s) | Amplitude (pA) | |||
|---|---|---|---|---|
| sEPSCs | mEPSCs | sEPSCs | mEPSCs | |
| Vehicle | 2.789 ± 0.351, n = 9 (6) | 2.403 ± 0.329, n = 8 (5) | 6.038 ± 0.553, n = 9 (6) | 5.48 ± 0.433, n = 8 (5) |
| PD1n‐3DPA | 2.232 ± 0.266, n = 9 (5) | 2.870 ± 0.491, n = 8 (4) | 5.897 ± 0.358, n = 9 (5) | 5.822 ± 0.507, n = 8 (4) |
| Mann Whitney U test p | .189 | .215 | .500 | .479 |
Numbers of animals in parentheses.
To address the question of whether the PD1n‐3DPA‐induced changes in inhibitory transmission were uniformly distributed among peri‐somatic and dendritic inhibitory synapses on the pyramidal neurons, we analyzed IPSC kinetics. The cumulative probability curves of IPSC rise‐times revealed two inflections of the curves (Figure 2E, arrows) around 1 and 3 ms. This suggests that there were two populations of IPSCs with different rise‐time kinetics: “fast” and “slow,” respectively (Figure 2H). These IPSCs were interpreted as representing peri‐somatic (fast) or dendritic (slow) synapse activity, the latter being a result of passive filtering because of more remote location from the recording patch pipette attached to the cell soma. Interestingly, we observed an increase in rising times for mIPSCs after PD1n‐3DPA incubation (Figure 2F), suggesting that PD1n‐3DPA might preferentially affect peri‐somatic synapses.
In principle, perisomatic IPSCs with fast kinetics should also display larger amplitudes. Indeed, when we plotted IPSC amplitudes against rising times, the high amplitude and fast rise time events had higher amplitude than those with slow kinetics (Figure 4A,B). Notably, IPSCs with faster kinetics and higher amplitudes displayed a larger increase in amplitudes after PD1n‐3DPA exposure compared to those with slow kinetics and low amplitudes (Figure 4A,B, magenta). However, only the increase in mIPSCs was statistically significant (see Table 3 for details). This would support that preferentially perisomatic inhibitory synapses onto the CA1 pyramidal neurons were affected by PD1n‐3DPA incubation.
FIGURE 4.
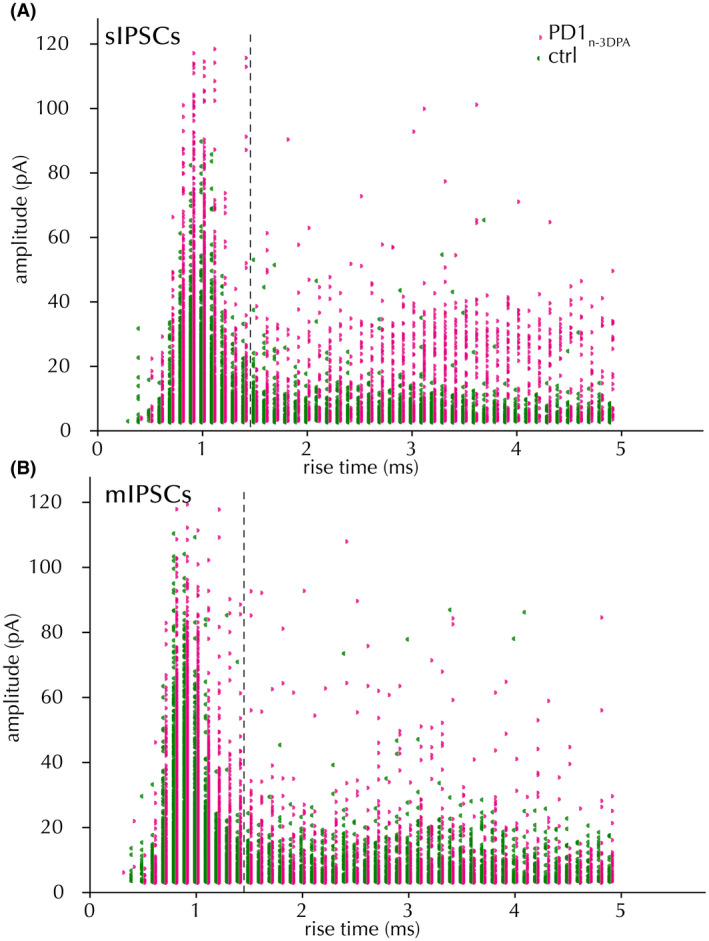
Rise time/amplitude distribution of IPSCs. Spontaneous (A) and miniature (B) IPSCs, after vehicle (green) and PD1n‐3DPA incubation (magenta). Fisher's exact test ns (sIPSCs), p < .05 (mIPSCs)
TABLE 3.
Increased proportion of fast rise‐time IPSC counts following PD1n‐3DPA incubation
| sIPSCs | mIPSCs | |||
|---|---|---|---|---|
| Fast | Slow | Fast | Slow | |
| Vehicle | 2734 | 1619 | 2777 | 1864 |
| PD1n‐3DPA | 3110 | 1787 | 5190 | 2235 |
| Fisher's exact p | .490 | <.001 | ||
Rise times separated at 1.4 ms.
3.2. GABAA receptor immunohistochemistry
Although the results of electrophysiological experiments pointed towards a preferential presynaptic mode of PD1n‐3DPA action, cumulative probability curves suggested a potential effect on IPSC amplitudes; therefore, postsynaptic changes (e.g., in GABAA receptors) could also be present. Consequently, we investigated whether PD1n‐3DPA could have induced changes in postsynaptic GABAA receptor subunit composition. GABAA receptors are the major inhibitory receptors on principal neurons and represent chloride channels assembled by five heterogeneous subunits. These subunits derive from about 15 different genes. A majority of GABAA receptors contain a γ‐subunit. 18 Together with a variety of scaffold proteins, like gephyrin, this subunit appears to contribute to the assembly of the receptor complex. 22 , 23 We, therefore, incubated hippocampal slices with PD1n‐3DPA and by immunofluorescence assessed the expression of the GABAA receptor γ‐subunit in six different subfields (Figure 5) of the hippocampus (Table 4).
FIGURE 5.
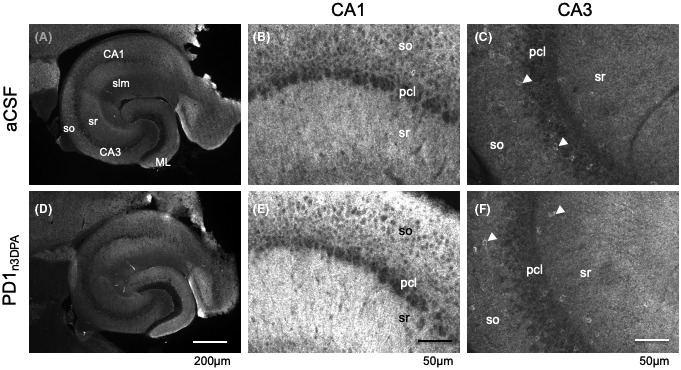
Examples of slices and the subfields CA1 and CA3 examined by immunofluorescence for GABAA receptor γ2‐subunit. Panels A and C show immunofluorescence images of representative slices incubated with aCSF (A) or PD1n3DPA in aCSF (D). Panels B and E show respective details of Sector CA1 and panels C and F of sector CA3 of the same sections. GABAA receptor γ2‐immunofluorescence labels primarily dendrites (note punctate labeling in B and E). Pericarya of pyramidal cells and interneurons are mostly unlabeled and appear dark. Note that in CA3 some interneurons show immunoreactivity at their cell bodies (arrow heads). Panel E indicates somewhat more intensive labeling for the γ2‐subunit as observed in some sections. CA1, CA3, cornu ammonis, sectors 1 and 3; ML, dentate molecular layer; pcl, pyramidal cell layer; slm, stratum lacunosum moleculare; so, stratum oriens; sr, stratum radiatum
TABLE 4.
GABAA receptor γ2‐subunit immunoreactivity in slices of the ventral hippocampus after incubation with PD1n‐3DPA Data represent the mean ± SEM of values from four vibratome slices (incubated either with aCSF or PD1n‐3DPA) each corresponding to an individual mouse
| DG‐ML | CA1 so | CA1 sr | CA1 slm | CA3 so | CA3 sr | |
|---|---|---|---|---|---|---|
| aCSF | 0.200 ± 0.019 | 0.217 ± 0.038 | 0.251 ± 0.037 | 0.213 ± 0.024 | 0.164 ± 0.019 | 0.160 ± 0.020 |
| PD1n‐3DPA | 0.229 ± 0.011 (115%) | 0.243 ± 0.037 (112%) | 0.282 ± 0.007 (112%) | 0.215 ± 0.023 (99%) | 0.125 ± 0.007 (76%) | 0.165 ± 0.020 (102%) |
| p‐value | .236 | .531 | .363 | .973 | .089 | .861 |
Each data point is based on average ROD values obtained from immunofluorescence from five to six 40‐µm sections/vibratome slice. Percentage values are relative to aCSF incubation.
Abbreviations: DG‐ML, molecular layer of the dentate gyrus; slm, stratum lacunosum moleculare; so, stratum oriens; sr, stratum radiatum.
Following PD1n‐3DPA incubation, minor fluorescence differences were observed in all hippocampal fields, compared to control slices, and these alterations were not statistically significant (Table 4). The representative slices with immunofluorescence staining in grayscale are presented in Figure 5. The data, therefore, did not support major changes in GABAA receptor γ‐subunit composition, indirectly reinforcing the preferentially presynaptic effect of PD1n‐3DPA.
3.3. Xenopus oocyte electrophysiology
To further strengthen the immunostaining results, we performed oocyte electrophysiology since the oocyte membranes incorporate exogenous neuronal membranes fragments containing GABAA and glutamate receptors. 15 , 24 We examined GABA and AMPA currents in oocytes incubated with PD1n‐3DPA or after intra‐oocyte injection of PD1n‐3DPA to test if there was an intracellular site of PD1n‐3DPA interaction with the membrane receptors. No significant changes either in GABA or AMPA currents were observed in these experiments at any timepoint of incubation (Table 5). These data support the slice electrophysiology results that PD1n‐3DPA‐induced changes in IPSCs are generated at presynaptic sites and that PD1n‐3DPA does not alter postsynaptic GABAA receptors. Moreover, PD1n‐3DPA appears ineffective on glutamatergic excitatory synaptic transmission.
TABLE 5.
Results of PD1n‐3DPA incubation and its intracellular injection in oocytes injected with human hippocampal tissue
| Incubation time | GABA current (pre‐PD1n‐3DPA) | GABA current (post‐PD1n‐3DPA) | AMPA current (pre‐PD1n‐3DPA) | AMPA current (post‐PD1n‐3DPA) |
|---|---|---|---|---|
| 5 min |
87.7 ± 16.0 nA (n = 6) |
88.3 ± 14.0 nA (n = 6) |
– | – |
| 20 min |
54.9 ± 23.1 nA (n = 6) |
54.4 ± 18.9 nA (n = 6) |
– | – |
| 1 h |
75.0 ± 10 nA (n = 7) |
77.0 ± 8 nA (n = 7) |
19.3 ± 1.5 nA (n = 5) |
18.3 ± 1.8 (n = 5) |
| 2 h |
54.7 ± 15.7 nA (n = 18) |
54.3 ± 13.9 nA (n = 18) |
26.9 ± 3.8 nA (n = 6) |
23.0 ± 5,.2 nA (n = 6) |
| 3 h |
58.5 ± 17.0 nA (n = 17) |
57.0 ± 15.5 nA (n = 17) |
29.4 ± 3.5 nA (n = 6) |
23.0 ± 7.5 nA (n = 6) |
| Intracellular injection |
70.7 ± 20.4 nA (n = 7) |
64.8 ± 22.7 nA (n = 7) |
7.6 ± 1.7 nA (n = 4) |
6.2 ± 1.5 nA (n = 4) |
3.4. PD1n‐3DPA effect is blocked by Pertussis toxin
Next, we hypothesized that the PD1n‐3DPA effect could be mediated via some type of GPCRs. Since, to our best knowledge, there are no data available on which type of GPCR could be involved in PD1n‐3DPA signaling, we used pertussis toxin, a Gi inhibitor, to address this question. Pertussis toxin (1 µg/ml) incubation reversed the increase in frequency (both cumulative probability curves and cell‐based average frequency), amplitude, and kinetics (only cumulative probability curves) of spontaneous IPSC induced by PD1n‐3DPA (Figure 6) (K‐S p < .001 for distribution changes relative to PD1n‐3DPA incubation, cell‐averaged comparison statistically significant for the frequency reversal–Table 6). These data suggest that PD1n‐3DPA increases inhibitory drive onto the pyramidal neurons by interaction with a GPCR. Further studies are required, however, to identify the specific type of the GPCR that is responsible for this effect.
FIGURE 6.
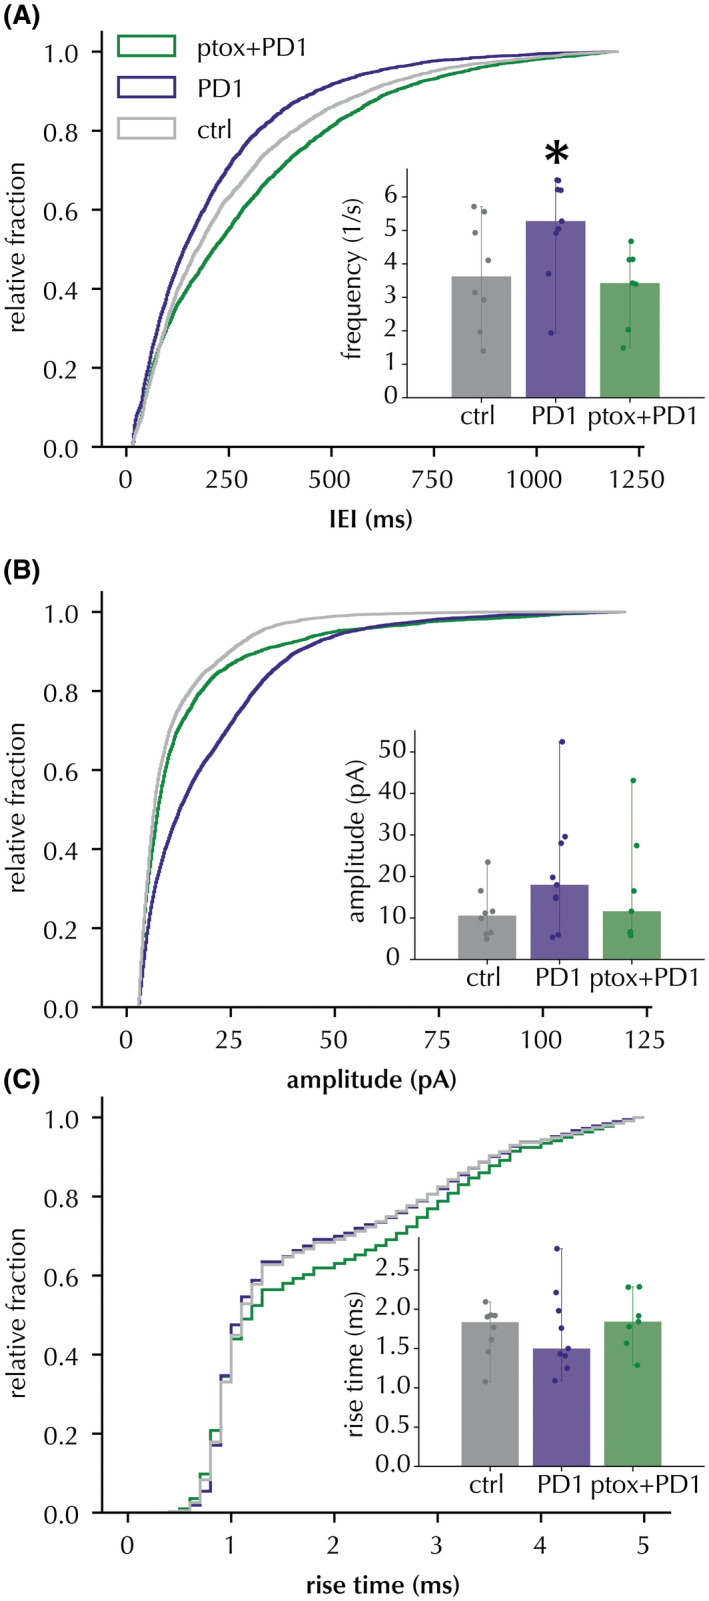
PD1n‐3DPA effect on IEI of IPSC in CA1 pyramidal neurons was reverted by pertussis toxin. Cumulative distribution curves of IEI (A), amplitudes (B) and rise times (C) of IPSCs were recorded after incubation with PD1n‐3DPA or with PD1n‐3DPA + PTX. The control (vehicle) group is displayed as a reference. Insets display the median and range of cell averages. * Mann‐Whitney p < .05 for cell averages (PD1n‐3DPA vs. PD1n‐3DPA + PTX), Kolmogorov‐Smirnov p < .01, D > .1 for all PD1n‐3DPA vs. PD1n‐3DPA + PTX distribution comparisons
TABLE 6.
Cell‐averaged sIPSC frequency and amplitude comparison between PD1n‐3DPA and PD1n‐3DPA + pertussis toxin incubations. n = 545 events per cell
| Frequency (1/s) | Amplitude (pA) | |
|---|---|---|
| PD1n‐3DPA | 5.143 ± 0.476, n = 9 (6) | 20.98 ± 4.541, n = 9 (6) |
| PD1n‐3DPA + pertussis toxin | 3.324 ± 0.408, n = 7 (5) | 16.797 ± 4.874, n = 7 (5) |
| Mann Whitney U test p | 0.010 | 0.263 |
Numbers of animals in parentheses.
4. DISCUSSION
Here, we demonstrate that PD1n‐3DPA applied to hippocampal slices enhances inhibitory drive onto the CA1 pyramidal neurons. Interestingly, most of this increase was observed in peri‐somatic inhibitory synapses. No changes were observed in excitatory synapses onto the pyramidal neurons. In addition, we demonstrate that this effect of PD1n‐3DPA is mediated by a yet unidentified GPCR.
Our findings provide fresh evidence that, in addition to its previously reported pro‐resolving and anti‐inflammatory actions, PD1n‐3DPA mediates a direct effect on network excitability, by interacting with GPCR. This newly described mechanism of action of PD1n‐3DPA may contribute to the anti‐seizure and neuroprotective effects described in vivo. 6 Notably, PD1n‐3DPA was among the most abundant lipid mediators measured during epilepsy development in mice suggesting it might be a key player in the tissue attempt to engage resolution pathways. Accordingly, early post‐injury administration of PD1n‐3DPA significantly reduced neuroinflammation, in line with previous findings that PD1n‐3 DPA and its precursor n‐3 DPA 25 exert powerful anti‐inflammatory effects. 26 This anti‐inflammatory effect was associated with a drastic reduction in the number and duration of spontaneous seizures in mice. The 10‐nM concentration we used in hippocampal slices was previously shown to mediate the anti‐inflammatory effects of the molecule in vitro. 27 When PD1n‐3DPA was applied in vivo (200 ng, 552.5 µM injected concentration) 6 into the ventricle, the original concentration was diluted in the CSF, which in mice is approximately 35 µl, 28 resulting in a final concentration of ~15.8 µM. However, PD1n‐3DPA had to diffuse to the hippocampal tissue, along a concentration gradient defined by the distance to the target tissue, diffusion coefficient, etc. resulting in further dilution. Therefore, it is difficult to compare the in vivo concentration effective on seizures with the in vitro concentration affecting GABA neurotransmission. However, the concentration we applied to the slices has been defined as optimal by the previous in vitro reports 27 and appears to be sufficient to elicit an effect. Therefore, the mechanism of action of PD1n‐3DPA identified by the present in vitro study is likely to be relevant in vivo when PD1n‐3DPA is injected into the ventricles and suppresses seizures. Thus, increased inhibitory drive on pyramidal neurons of the hippocampus caused by direct application of PD1n‐3DPA may counteract increased network excitability and thereby reduce spontaneous recurrent seizures.
An interesting finding of this study is that the effect of PD1n‐3DPA was predominantly exerted on perisomatic inhibitory synapses. Although our data on cumulative probability curves demonstrating increased amplitude of IPSCs may also indicate a postsynaptic action of PD1n‐3DPA on inhibitory synapses, both immunohistochemical analyses of postsynaptic GABAA receptors and Xenopus oocyte assay failed to demonstrate changes at postsynaptic sites. The oocyte assay has been proven to be effective in identifying alteration in GABAA receptor function. 24 These data exclude the possibility of a direct action of the compound on these receptor populations, however indirect metabotropic (i.e., on GABAB receptor expression) or direct intracellular effects cannot be excluded. One could speculate that PD1n‐3DPA acts therefore mostly presynaptically on CA1 pyramidal neurons, and selectively affects those inhibitory interneurons that innervate the perisomatic area of the principal neurons, such as, for example, parvalbumin‐ or cholecystokinin‐expressing basket cells. 29 , 30 Since we show that the PD1n‐3DPA effect is sensitive to pertussis toxin, it implies that these interneurons may selectively express a specific type of GPCRs and/or associated Go/Gi proteins that mediate the PD1n‐3DPA effect. This hypothesis is worth further investigation.
In view of its neuromodulatory effects, PD1n‐3DPA may prove to be an attractive target for anti‐ictogenic and anti‐epileptileptogenic interventions. In this regard, identifying a specific GCPR that mediates its effect would be of particular interest.
Our data raise the possibility that PD1n‐3DPA might also counteract in vivo the effects of ictogenic cytokines such as IL‐1β and TNF which are proven to decrease inhibitory synaptic transmission. 5
In conclusion, we have identified a novel mechanism by which a key pro‐resolving molecule affects network excitability, in addition to its anti‐inflammatory effects. This direct neuronal mechanism involves yet unidentified a GPCR, elucidation of which may provide a novel target for anti‐epileptogenic and anti‐ictogenic approaches in epilepsy.
DISCLOSURES
The authors have no relevant financial or non‐financial interests to disclose.
AUTHOR CONTRIBUTIONS
Designed research: Merab Kokaia, Annamaria Vezzani, and Jesmond Dalli; performed research: Apostolos Mikroulis, Marco Ledri, Gabriele Ruffolo, Eleonora Palma, and Günther Sperk; analyzed data: Apostolos Mikroulis, Gabriele Ruffolo, Eleonora Palma, and Günther Sperk; wrote the paper: Apostolos Mikroulis, Marco Ledri, Gabriele Ruffolo, Eleonora Palma, Günther Sperk, Jesmond Dalli, Annamaria Vezzani, and Merab Kokaia.
ACKNOWLEDGMENTS
MK was supported by European Union's Seventh Framework Programme (FP7/2007‐2013) under Grant Agreement n°602102, Swedish Research Council grant No. 2017‐00921, and Olle Engkvists Foundation, Sweden. GS was supported by the Austrian Science Fund (Project P 19464). GR was supported by the BE‐FOR‐ERC program (Sapienza University) and the Italian Ministry of Health “Ricerca corrente.” JD is supported by a Sir Henry Dale Fellowship jointly funded by the Wellcome Trust and the Royal Society (grant# 107613/Z/15/Z). AV was supported by European Union's Seventh Framework Programme (FP7/2007‐2013) under Grant Agreement n°602102. We thank Anna Wieselthaler‐Hoelzl for the technical help and Prof Trond Vidar Hansen (University of Oslo) for providing PD1n‐3 DPA and Prof. Dr. Werner Sieghart, Medical University Vienna for the GABAA receptor γ‐subunit antibody.
Mikroulis A, Ledri M, Ruffolo G, et al. Lipid mediator n‐3 docosapentaenoic acid‐derived protectin D1 enhances synaptic inhibition of hippocampal principal neurons by interaction with a G‐protein‐coupled receptor. FASEB J. 2022;36:e22203. doi: 10.1096/fj.202101815R
DATA AVAILABILITY STATEMENT
The data that support the findings of this study are available on request from the corresponding author. Code is available at GitHub and Zenodo with DOI: 10.5281/zenodo.4431620.
REFERENCES
- 1. Dawit S, Crepeau AZ. When drugs do not work: alternatives to antiseizure medications. Curr Neurol Neurosci. 2020;20(9):37. doi: 10.1007/s11910-020-01061-3 [DOI] [PubMed] [Google Scholar]
- 2. Cascino GD, Brinkmann BH. Advances in the surgical management of epilepsy drug‐resistant focal epilepsy in the adult patient. Neurol Clin. 2020;39(1):181‐196. doi: 10.1016/j.ncl.2020.09.010 [DOI] [PubMed] [Google Scholar]
- 3. Vezzani A, Balosso S, Ravizza T. Neuroinflammatory pathways as treatment targets and biomarkers in epilepsy. Nat Rev Neurol. 2019;15(8):459‐472. doi: 10.1038/s41582-019-0217-x [DOI] [PubMed] [Google Scholar]
- 4. Vliet EA, Aronica E, Vezzani A, Ravizza T. Review: neuroinflammatory pathways as treatment targets and biomarker candidates in epilepsy: emerging evidence from preclinical and clinical studies. Neuropath Appl Neuro. 2018;44(1):91‐111. doi: 10.1111/nan.12444 [DOI] [PubMed] [Google Scholar]
- 5. Vezzani A, Viviani B. Neuromodulatory properties of inflammatory cytokines and their impact on neuronal excitability. Neuropharmacology. 2015;96(Pt A):70‐82. doi: 10.1016/j.neuropharm.2014.10.027 [DOI] [PubMed] [Google Scholar]
- 6. Frigerio F, Pasqualini G, Craparotta I, et al. n‐3 Docosapentaenoic acid‐derived protectin D1 promotes resolution of neuroinflammation and arrests epileptogenesis. Brain. 2018;141(11):3130‐3143. doi: 10.1093/brain/awy247 [DOI] [PMC free article] [PubMed] [Google Scholar]
- 7. Weissberg I, Wood L, Kamintsky L, et al. Albumin induces excitatory synaptogenesis through astrocytic TGF‐β/ALK5 signaling in a model of acquired epilepsy following blood–brain barrier dysfunction. Neurobiol Dis. 2015;78:115‐125. doi: 10.1016/j.nbd.2015.02.029 [DOI] [PMC free article] [PubMed] [Google Scholar]
- 8. Devinsky O, Vezzani A, Najjar S, Lanerolle NCD, Rogawski MA. Glia and epilepsy: excitability and inflammation. Trends Neurosci. 2013;36(3):174‐184. doi: 10.1016/j.tins.2012.11.008 [DOI] [PubMed] [Google Scholar]
- 9. Roseti C, van Vliet EA, Cifelli P, et al. GABAA currents are decreased by IL‐1β in epileptogenic tissue of patients with temporal lobe epilepsy: implications for ictogenesis. Neurobiol Dis. 2015;82:311‐320. doi: 10.1016/j.nbd.2015.07.003 [DOI] [PubMed] [Google Scholar]
- 10. Serhan CN, Chiang N, Dalli J. New pro‐resolving n‐3 mediators bridge resolution of infectious inflammation to tissue regeneration. Mol Aspects Med. 2018;64:1‐17. doi: 10.1016/j.mam.2017.08.002 [DOI] [PMC free article] [PubMed] [Google Scholar]
- 11. Xiao YF, Li X. Polyunsaturated fatty acids modify mouse hippocampal neuronal excitability during excitotoxic or convulsant stimulation. Brain Res. 1999;846(1):112‐121. doi: 10.1016/s0006-8993(99)01997-6 [DOI] [PubMed] [Google Scholar]
- 12. Taha AY, Zahid T, Epps T, et al. Selective reduction of excitatory hippocampal sharp waves by docosahexaenoic acid and its methyl ester analog ex‐vivo. Brain Res. 2013;1537:9‐17. doi: 10.1016/j.brainres.2013.09.004 [DOI] [PubMed] [Google Scholar]
- 13. Jonas P, Major G, Sakmann B. Quantal components of unitary EPSCs at the mossy fibre synapse on CA3 pyramidal cells of rat hippocampus. J Physiology. 1993;472(1):615‐663. doi: 10.1113/jphysiol.1993.sp019965 [DOI] [PMC free article] [PubMed] [Google Scholar]
- 14. Mikroulis A. XPSC‐Detection—Template Correlation‐Based Detection of Postsynaptic Currents. https://github.com/AMikroulis/xPSC‐detection [Google Scholar]
- 15. Palma E, Esposito V, Mileo AM, et al. Expression of human epileptic temporal lobe neurotransmitter receptors in Xenopus oocytes: an innovative approach to study epilepsy. Proc National Acad Sci USA. 2002;99(23):15078‐15083. doi: 10.1073/pnas.232574499 [DOI] [PMC free article] [PubMed] [Google Scholar]
- 16. Conti L, Palma E, Roseti C, et al. Anomalous levels of Cl− transporters cause a decrease of GABAergic inhibition in human peritumoral epileptic cortex. Epilepsia. 2011;52(9):1635‐1644. doi: 10.1111/j.1528-1167.2011.03111.x [DOI] [PubMed] [Google Scholar]
- 17. Drexel M, Romanov RA, Wood J, et al. Selective silencing of hippocampal parvalbumin interneurons induces development of recurrent spontaneous limbic seizures in mice. J Neurosci. 2017;37(34):8166‐8179. doi: 10.1523/jneurosci.3456-16.2017 [DOI] [PMC free article] [PubMed] [Google Scholar]
- 18. Pirker S, Schwarzer C, Wieselthaler A, Sieghart W, Sperk G. GABAA receptors: immunocytochemical distribution of 13 subunits in the adult rat brain. Neuroscience. 2000;101(4):815‐850. doi: 10.1016/s0306-4522(00)00442-5 [DOI] [PubMed] [Google Scholar]
- 19. Sperk G, Schwarzer C, Tsunashima K, Fuchs K, Sieghart W. GABA(A) receptor subunits in the rat hippocampus I: immunocytochemical distribution of 13 subunits. Neuroscience. 1997;80(4):987‐1000. doi: 10.1016/s0306-4522(97)00146-2 [DOI] [PubMed] [Google Scholar]
- 20. Schindelin J, Arganda‐Carreras I, Frise E, et al. Fiji: an open‐source platform for biological‐image analysis. Nat Methods. 2012;9(7):676‐682. doi: 10.1038/nmeth.2019 [DOI] [PMC free article] [PubMed] [Google Scholar]
- 21. Markram H, Tsodyks M. Redistribution of synaptic efficacy between neocortical pyramidal neurons. Nature. 1996;382(6594):807‐810. doi: 10.1038/382807a0 [DOI] [PubMed] [Google Scholar]
- 22. Essrich C, Lorez M, Benson JA, Fritschy JM, Lüscher B. Postsynaptic clustering of major GABAA receptor subtypes requires the γ2 subunit and gephyrin. Nat Neurosci. 1998;1(7):563‐571. doi: 10.1038/2798 [DOI] [PubMed] [Google Scholar]
- 23. Khayenko V, Maric HM. Targeting GABAAR‐associated proteins: new modulators, labels and concepts. Front Mol Neurosci. 2019;12:162. doi: 10.3389/fnmol.2019.00162 [DOI] [PMC free article] [PubMed] [Google Scholar]
- 24. Ruffolo G, Cifelli P, Roseti C, et al. A novel GABAergic dysfunction in human Dravet syndrome. Epilepsia. 2018;59(11):2106‐2117. doi: 10.1111/epi.14574 [DOI] [PubMed] [Google Scholar]
- 25. Ferdinandusse S, Denis S, Mooijer PAW, et al. Identification of the peroxisomal β‐oxidation enzymes involved in the biosynthesis of docosahexaenoic acid. J Lipid Res. 2001;42(12):1987‐1995. doi: 10.1016/s0022-2275(20)31527-3 [DOI] [PubMed] [Google Scholar]
- 26. Dalli J, Colas RA, Serhan CN. Novel n‐3 immunoresolvents: structures and actions. Sci Rep‐uk. 2013;3(1):1940. doi: 10.1038/srep01940 [DOI] [PMC free article] [PubMed] [Google Scholar]
- 27. Gobbetti T, Dalli J, Colas RA, et al. Protectin D1n–3 DPA and resolvin D5n–3 DPA are effectors of intestinal protection. Proc National Acad Sci USA. 2017;114(15):3963‐3968. doi: 10.1073/pnas.1617290114 [DOI] [PMC free article] [PubMed] [Google Scholar]
- 28. Pardridge WM. CSF, blood‐brain barrier, and brain drug delivery. Expert Opin Drug Del. 2016;13(7):963‐975. doi: 10.1517/17425247.2016.1171315 [DOI] [PubMed] [Google Scholar]
- 29. Jinno S, Klausberger T, Marton LF, et al. Neuronal diversity in GABAergic long‐range projections from the hippocampus. J Neurosci. 2007;27(33):8790‐8804. doi: 10.1523/jneurosci.1847-07.2007 [DOI] [PMC free article] [PubMed] [Google Scholar]
- 30. Klausberger T, Somogyi P. Neuronal diversity and temporal dynamics: the unity of hippocampal circuit operations. Science. 2008;321(5885):53‐57. doi: 10.1126/science.1149381 [DOI] [PMC free article] [PubMed] [Google Scholar]
Associated Data
This section collects any data citations, data availability statements, or supplementary materials included in this article.
Data Availability Statement
The data that support the findings of this study are available on request from the corresponding author. Code is available at GitHub and Zenodo with DOI: 10.5281/zenodo.4431620.