Abstract
THz band communication has the potential to meet the high data rate demands of many current and future applications. However, before these networks are realized, extensive channel measurements are needed in order to characterize the wireless channel at these frequencies, in order to inform system design and deployment. In the current paper, we present a set of double‐directional channel measurements that are conducted in several relevant indoor and outdoor scenarios. Our aim is to see the effect of common building materials that might be particularly reflective or absorptive (such as energy‐saving glass, window blinds, or metallic reflectors), and how their presence changes the channel characteristics. Among other effects we find that ‐ depending on the considered dynamic range ‐ presence/absence of these materials can increase the required equalizer length by an order of magnitude.
Keywords: THz channel measurements, outdoor measurements, indoor measurements, material effects
Key Points
Channel measurements for important THz scenarios is key toward their wider understanding
The impact of some common materials on THz communication is presented by means of double‐directional measurements
The aim is to see the effect of common building materials such as energy‐saving glass, window blinds, or metallic reflectors
1. Introduction
The high data rate requirements for many upcoming applications such as virtual reality and immersive environments cannot be met with current and proposed 5G networks (Shafi et al., 2017). Moreover, these requirements are envisioned to grow even further in near future. Communications in the THz band (0.1–10 THz) is a key candidate to meet these requirements because of the availability of large amount of unused spectrum in this band (Akyildiz et al., 2014). The topic has thus seen a lot of recent interest especially in the 0.1–0.5 THz range as pointed out by some recent survey papers on the future of THz communications (Chen et al., 2019; Han et al., 2021; Kürner & Priebe, 2014; Rappaport et al., 2019). This interest is in part fostered by the recent decision of the US spectrum regulator, the Federal Communication Commission (FCC), to provide experimental licenses in the 140–220 GHz band, and the expectation that this band is to be an important part of 6G wireless systems (Tataria et al., 2021).
The design of any communication system, regardless of its frequency of operation or bandwidth, depends on the channel it is to operate in. Therefore, the first key step in order to move towards the development of THz systems is to perform measurements that allow understanding and realistic assessment and modeling of the channels. A number of such studies have been recently performed in particular at the lower end of this band (0.1–0.5 THz). A propagation system for channel measurements at 300 GHz is discussed in (Priebe et al., 2010). Statistical analysis for a desktop THz channel at 300 GHz is discussed in (Kim & Zajić, 2015). Recent papers by our group cover channel measurements and statistical analysis for urban outdoor device‐to‐device (Abbasi et al., 2019; Abbasi, Hariharan, Nair, & Molisch, 2020; Abbasi, Ponce, Kondaveti, Shaikbepari, et al., 2021) and microcell scenarios (Abbasi, Ponce, Kondaveti, Kumar, et al., 2021) at 140 GHz. Also, recently the authors of (Xing et al., 2021; Xing & Rappaport, 2021) have performed and analyzed channel measurements above 140 GHz. A detailed survey covering various indoor and outdoor scenarios is given in (Han et al., 2021). Yet, the understanding of the key channel characteristics in this band is still very preliminary since the overall number of directionally‐resolved channel measurements is still very small and it needs to be explored further before an eventual development and deployment can be considered.
Environmental objects, by virtue of their presence, absence or change in reflection or transmission characteristics, play an important role for the communication channels since they partially govern the eventual multipath component (MPC) structure of the channel. This is especially true for higher frequencies such as the THz band because they are more directional and a large percentage of their energy can be blocked more easily than their lower frequency counterparts. The placement of such objects can be deliberate, for example, to enhance coverage in a particular area. Passive reflectors placed at the intersection of corridors to extend coverage into non‐line‐of‐sight ((NLoS)) corridors was suggested more than 40 years ago (Isberg & Chufo, 1978) and explored since, for example, (Talbi & LeBel, 2012). This topic is related to the recently popular subject of intelligent reflective surfaces, see (Wu et al., 2021), but different in that those reflectors do not have any adaptivity. The placement of objects can also be co‐incidental, such as placement of furniture (Collonge et al., 2003; Guerin, 1996; Zhang et al., 2018). These and other studies such as (Debaenst et al., 2020; Siamarou & Al‐Nuaimi, 2010; Zhang et al., 2018) have looked at impact the presence or absence of common objects in the environment have on channel characteristics, however, they have ‐ to the best of our knowledge ‐ all been limited to lower frequency bands so far. Furthermore, they investigated the impact of adding new objects to the environment, but not the change of the reflection/transmission characteristics of existing objects that occur when they are covered with a different material.
On the other hand, several studies have looked at the material properties of various common objects in various sub‐bands of the larger THz band. Reflection coefficients for some common indoor building materials were analyzed in (Piesiewicz et al., 2007). Indoor materials such as wood, plastic, paper, brick, glass and leather were analyzed in (Sheikh et al., 2019) for material characteristics. Penetration loss and attenuation as a result of several common constructional materials was discussed in (Du et al., 2021). Radar cross section of the human body was measured in (Abbasi, Molisch, & Zhang, 2020). The above discussed studies have measured isolated samples of these materials but have not looked at their impact in the larger context of multi‐path channel characteristics.
To bridge this gap under the considerations stated above, the aim of the current study is to explore the impact of various common environmental objects on THz channels specifically in the 145–146 GHz band. Please note that some authors prefer to use the term “THz” to identify with 300 GHz and beyond while using “sub‐THz” or “low‐THz” for frequencies between 100 and 300 GHz whereas other authors use the term “THz” for both these cases. For the current work, we will use the term “THz” since it is more widely used in the literature for the band of interest.
For the current paper, we choose scenarios and objects that represent common indoor and outdoor communication applications for the THz band. We first revisit a set of outdoor measurements (previously described in our conference paper (Abbasi, Gomez‐Ponce, et al., 2021)) and discuss the results and the scenario in more detail. We then describe several indoor measurements where we assess the impact of energy‐saving (low‐e) glass versus common glass, open windows versus blinds, and the impact of using high tint glass inside buildings. Besides the analysis of angular power spectra (APS) and power delay profiles (PDP), various condensed channel parameters such as path loss, delay spread, MPC power distribution and angular spread are also investigated to see how they are affected in the various scenarios discussed above.
The remainder of this paper is organized as follows. In Section 2, we describe the channel sounding setup and the measurement scenarios. Key parameters of interest and their processing is described in Section 3. The results of the measurements and modeling are presented in Section 4. We finally conclude the manuscript in Section 5.
2. Measurement Equipment and Site
2.1. Testbed Description
We used a frequency‐domain channel sounder shown in Figure 1 to perform the current measurement campaign. The setup is based on Vector Network Analyzer (VNA) which uses frequency extenders to reach frequencies in the THz range. An RF‐over‐fiber (RFoF) (introduced in (Abbasi, Hariharan, Nair, Almaiman, et al., 2020)) system allows the system to operate over longer measurement distances (up to 100 m) in comparison to typical systems (less than 10 m). For further details of the setup, please see (Abbasi et al., 2019; Abbasi, Ponce, Kondaveti, Shaikbepari, et al., 2021). While the complete configuration of the sounder varies over the various experiments due the requirements of each particular measurement, some of the common parameters are summarized in Table 1. Please note that while our setup allows measurements in the full 140–220 GHz band, we have limited the bandwidth for the current measurements to 1 GHz because of the extensive time requirements for the experiments. For a frequency domain setup, such as the one used for the current measurements, measurement time for an impulse response increases linearly with an increase in the measurement bandwidth. For logistical reasons, extending the measurement time per location significantly beyond 1 GHz was not feasible for us.
Figure 1.
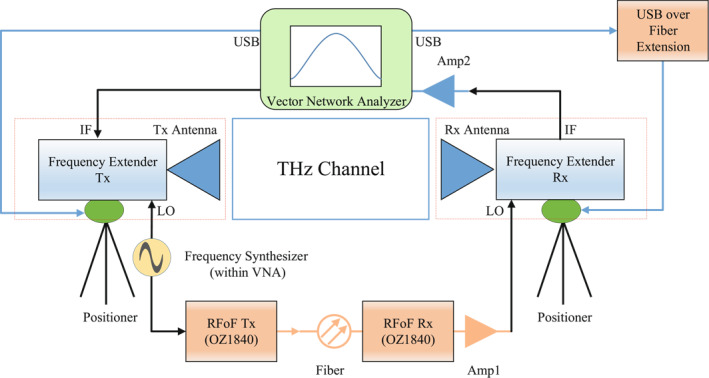
Channel sounding setup.
Table 1.
Common Setup Parameters
| Parameter | Symbol | Value |
|---|---|---|
| Start frequency | f start | 145 GHz |
| Stop frequency | f stop | 146 GHz |
| Bandwidth | BW | 1 GHz |
| IF bandwidth | IF BW | 1 KHz |
| THz IF | f THzIF | 279 MHz |
| Antenna 3 dB beamwidth | ϕ 3dB | 13° |
All experiments were done for quasi‐static scenarios since the low measurement speeds coupled with the overheads due to mechanical rotation do not allow the measurements of channel dynamics. Additionally, we perform an over‐the‐air calibration (OTA) for every measurement which consists of a (delay‐gated) line of sight (LoS) measurement at a known distance to eliminate the system's behavior and normalize the antenna gain.
2.2. Experiments and Scenario Description
Overall, in the current study we perform experiments in four different locations where on each one of them some environmental objects are modified or added to analyze their impact in the channel. Specifically, we measure the impact of (a) increasing the reflection coefficient of columns in a courtyard by metallic foil, (b) placing pieces of tinted glass (similar to picture frames) in a corridor), (c) analyzing various types of glass windows in the entrance door of a conference room, and (d) (un)covering windows in a conference room with blinds. These scenarios will be now described in detail.
The first measurement scenario is located at the entrance of the Vivian Hall of Engineering (VHE) building in the USC University Park Campus, Los Angeles, CA, USA. It is an open area with equally‐spaced pillars. The front area faces buildings with low height and the back side faces an open area with trees, chairs and a water fountain (see Figure 2).
Figure 2.
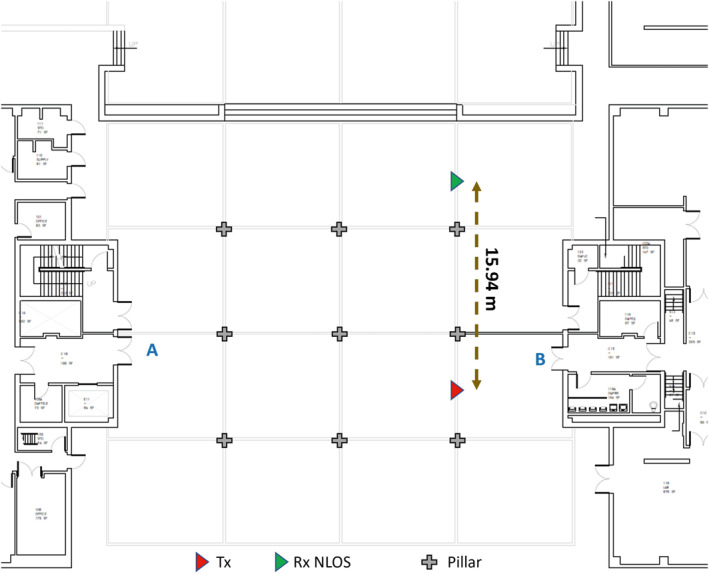
Vivian hall of engineering outdoor measurement scenario.
In this scenario, the transmitter (Tx) and the receiver (Rx) are in a non line of sight (NLoS) scenario, blocked by two pillars, with a distance of 15.94 m between them. Both horn antennas face entrance A. The modification applied in this scenario was to increase the reflectivity of the pillars by wrapping them with an aluminum foil centered at 1.65 m height (as explained in (Abbasi, Gomez‐Ponce, Shaikbepari, et al., 2021)). The specific configuration for this scenario is shown in Table 2. The antennas were set to 1.65 m height where the Rx performs a full azimuth scan with an angular resolution of 6°. On the other hand, the Tx illuminates a sector, from −45° to 45° with an angular resolution of 5°. The number of frequency points per sweep is 1601 which allows a maximum measurable distance of 480 m in delay. The orientation of the positioners for this measurement is looking toward the west as the origin direction (ϕ Tx = ϕ Rx = 0) as shown in Figure 2.
Table 2.
Additional Setup Parameters for Vivian Hall of Engineering Outdoor Scenario
| Parameter | Symbol | Value | |
|---|---|---|---|
| Measurement points | N | 1601 | |
| Tx–Rx distance |
|
15.9 m | |
| Tx rotation range | Tx AZ | (−45°, 45°) | |
| Tx rotation resolution | ΔTx AZ | 5° | |
| Rx rotation range | Rx AZ | (0°, 360°) | |
| Rx rotation resolution | ΔRx AZ | 6° |
The next scenario is at the fifth floor of Hughes Aircraft Electrical Engineering Center (EEB) at 3740 McClintock Ave, Los Angeles, CA 90089, which is a 5‐story (plus a basement) building. The floor is an office environment with several offices having wooden doors (and glass windows on few of them). The walls of the building are made of drywall alongside metallic elevators while the floor has tile flooring and the roof has false ceiling (with acoustical tiles) at a height of 2.45 m. The floor has a two long corridors that are around 36 m long and 1.5 m wide. In the first one (bottom hallway in Figure 3), henceforth identified as EEB fifth floor (since no other corridor measurements were done in the campaign), there are offices located on both sides. The second corridor is similar to the first one except for the fact that there are notice boards and paintings with glass lamination on the walls alongside two elevators (see Figure 3).
Figure 3.
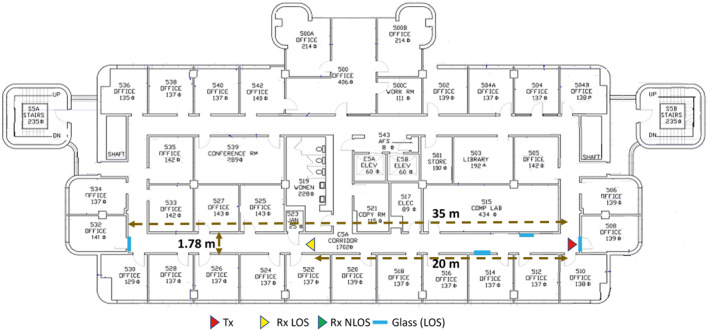
Electrical engineering center (EEB) fifth floor scenario. EEB 539 can also be seen in the figure.
To see the effect of more reflective high‐tint glass in the environment, we modify the scenario by placing high‐tint glasses on the walls in the corridor. We place four pieces of glass, 2 at the doors located on the edges of the corridors and 2 additional on both side walls. The antenna height is set to 1.7 m. Both antennas perform a full azimuth scan with an angular resolution of 10° and the number of frequency points per sweep is selected to be 1001 allowing a maximum measurable distance of 300 m which is more than sufficient for the scenario (see Table 3).
Table 3.
Additional Setup Parameters for Electrical Engineering Center fifth Floor Scenario
| Parameter | Symbol | Value | |
|---|---|---|---|
| Measurement points | N | 1001 | |
| Tx – Rx distance, LoS |
|
20.12 m | |
| Tx rotation range | Tx AZ | (0°, 360°) | |
| Tx rotation resolution | ΔTx AZ | 10° | |
| Rx rotation range | Rx AZ | (0°, 360°) | |
| Rx rotation resolution | ΔRx AZ | 10° |
The third scenario is an office of 7.22 m by 3.78 m located at EEB fifth floor, henceforth specifically named as EEB 539. The room has a large table, a cabinet and two whiteboards. The Tx horn was placed outside the room, 45 cm from the door, the LoS scenario Rx is placed at 3.37 m from the Tx, meanwhile the NLoS scenario Rx is placed inside the room at 3.89 m such that the line‐of‐sight is blocked by a wall, a whiteboard and the frame (see Figure 4). A platform is placed at the door which allows us to emulate a glass opening in the door and thus allows us to see the effect of using different types of glasses in the door. For this set of measurements, the number of frequency points per sweep is 301 which allows a maximum measurable distance of 90 m which is more than sufficient for the scenario. Like the previous case, the Rx performs a full scan with a 10° angular resolution, however, the Tx performs an angular scan from −60° to 60° with the same angular resolution since this is the major portion that covers the glass opening in the door (see Table 4).
Figure 4.

Electrical engineering center 539 measurement scenario.
Table 4.
Additional Setup Parameters for Electrical Engineering Center 539 Scenario
| Parameter | Symbol | Value | |
|---|---|---|---|
| Measurement points | N | 301 | |
| Tx – Rx distance, LoS |
|
3.36 m | |
| Tx – Rx distance, NLoS |
|
3.89 m | |
| Tx rotation range | Tx AZ | (−60°, 60°) | |
| Tx rotation resolution | ΔTx AZ | 10° | |
| Rx rotation range | Rx AZ | (0°, 360°) | |
| Rx rotation resolution | ΔRx AZ | 10° |
The last scenario is another office located at the EEB building, however, it is on the first floor (EEB 110) in this instance and has dimensions of 7.19 × 3.94 m. The room has a whiteboard, a large table, a bookshelf and a large window with blinds facing to the street (see Figure 5). For this case, we wanted to see the effect of the presence of blinds in the room. We, therefore, perform measurements with and without the blinds pulled down on the windows. The Tx is placed outside the room, the LoS Rx is placed nearly in the middle of the room at 3.98 m from the Tx facing the window, and the NLoS Rx is placed at the opposite side of the room facing in the same direction as the LoS Rx, looking toward a whiteboard (in front of the large window that Tx faces). For both Tx and Rx we performed a full azimuth scan with an angular resolution of 10° and 1001 frequency points to have a maximum measurable distance of 300 m (see Table 5).
Figure 5.
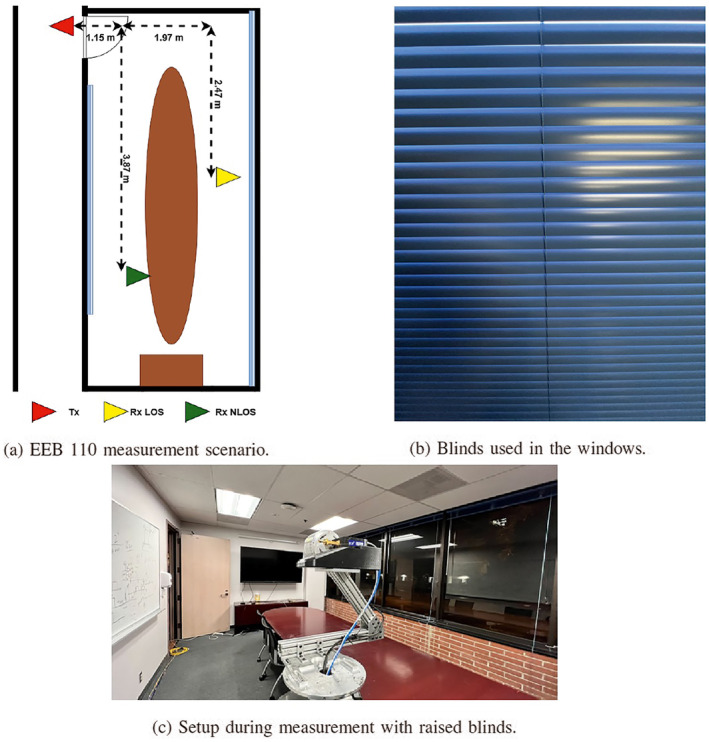
Electrical engineering center 110 measurement scenario.
Table 5.
Additional Setup Parameters for Electrical Engineering Center 110 Scenario
| Parameter | Symbol | Value | |
|---|---|---|---|
| Measurement points | N | 1001 | |
| Tx – Rx distance, LoS |
|
3.98 m | |
| Tx – Rx distance, NLoS |
|
4.05 m | |
| Tx rotation range | Tx AZ | (0°, 360°) | |
| Tx rotation resolution | ΔTx AZ | 10° | |
| Rx rotation range | Rx AZ | (0°, 360°) | |
| Rx rotation resolution | ΔRx AZ | 10° |
3. Parameters and Processing
The sounder described in the previous section produces a collection of frequency scans for each Tx‐Rx location. Each one can be represented as a three‐dimensional tensor (as described in (Abbasi, Gomez‐Ponce, Burghal, et al., 2021)) H meas (f, ϕ Tx , ϕ Rx ; d) where f is the frequency point within the 1 GHz bandwidth (145–146 GHz), ϕ Tx , ϕ Rx are the azimuth orientations for Tx and Rx respectively, and d is the Euclidean distance between Tx and Rx. The matrix H meas has dimensions (N, N Tx , N Rx ) where N is the number of frequency points, N Tx and N Rx are the number of azimuth scans at the Tx and Rx respectively. The first step of the analysis is to calibrate the measurements (eliminate the effects of the system and antennas) by dividing the measured channel transfer function by the OTA calibration.
H OTA(f): H (f, ϕ Tx , ϕ Rx ; d) = H meas (f, ϕ Tx , ϕ Rx ; d)/H OTA(f).
This calibrated channel frequency response is the input to the estimation of the different parameters described in the following.
The directional power delay profile is:
| (1) |
where is the inverse fast Fourier transform (IFFT) with respect to f, and τ is the delay, with samples spaced 1 ns apart. Delay gating and noise thresholding are implemented to minimize the impact of the noise (similar to (Gomez‐Ponce et al., 2020)):
| (2) |
τ gate is the delay gating threshold set to avoid using points with “wrap‐around” effect of the IFFT. P λ is the noise threshold, selected to avoid counting delay bins with noise which could distort the estimation of parameters such as delay spread and angular spread. P λ is selected to be 6 dB above the noise floor (average noise power) of the PDP and τ gate is selected depending on the number of frequency points N.
Using the entire set of directional PDPs, we select the “strongest beam” as the beam pair Tx‐Rx with the highest power (integrated over delay). The PDP in this beam, called the Max‐Dir PDP, is:
| (3) |
Another kind of PDP to be computed is the “omni‐directional” PDP. It is constructed by selecting the strongest azimuth direction per delay bin to reconstruct the PDP similar to (Hur et al., 2014)
| (4) |
Using both the Max‐Dir and Omni‐directional PDPs, we estimate parameters such as Path Loss, delay and angular spread and power distribution over the MPCs.
3.1. Path Loss
Path Loss is computed as the sum of powers in all delay bins in the PDP (see (Molisch, 2011)).
| (5) |
where i can denote omni‐directional (omni) or strongest beam (Max‐Dir).
3.1.1. Delay Spread
The (rms) delay spread is the second central moment of the PDP (Molisch, 2011):
| (6) |
where i can be “omni” or “Max‐Dir”. Please note that long‐delayed samples with small power can have a disproportionate impact on the delay spread; for this reason, noise thresholding is especially important in the assessment of delay spread.
3.1.2. Power Distribution Over MPC
To determine the concentration of power in the strongest MPC versus the rest present in the channel we define a parameter κ 1:
| (7) |
where i can be “omni” or “Max‐Dir”, and is the location of the kth local maximum of the PDP , ordered by magnitude, so that signifies the location of the largest local maximum. This definition is different than “Rice Factor” because in the Fourier analysis it is not possible to differentiate between closely spaced MPCs, so that the local maximum of the PDP is not strictly identical to an MPC, as explained in (Abbasi, Hariharan, Nair, Almaiman, et al., 2020).
3.1.3. Angular Spread
The double‐directional angular power spectrum (DDAPS) describes the power distribution over different Tx‐Rx angular orientations (since our measurement setup scans only the horizontal plane, a distinction between angular and azimuthal power spectrum is moot). The DDAPS is computed as
| (8) |
The resolution of this function is proportional to the spacing between angular captures performed during the measurement. Since the DDAPS is computed from the PDP, it benefits from the noise thresholding and delay gating procedures applied there. This is important to suppress noise power accumulation in the directions in which no significant MPCs occur.
To obtain the (single‐directional) angular power spectrum (APS) at the Tx we integrate the DDAPS function over ϕ Rx , and similarly for the APS at the Rx. Using these quantities, we proceed to compute the angular spread by applying Fleury's definition (Fleury, 2000)
| (9) |
where k can be Tx or Rx indicate departure or arrival APS and μ ϕ can be computed as
| (10) |
The finite horn antenna beamwidth leads to an over‐estimation of the channel's angular spread, as explained in (Abbasi, Hariharan, Nair, & Molisch, 2020)
4. Measurement Results
In this section, we describe our results, emphasizing the changes observed when the modifications in the scenario were applied.
4.1. VHE Outdoor Measurement Scenario
Since the scenario is NLoS, we can expect to have multiple MPCs, which are coming from directions different from the LoS. In this case, the strongest MPC comes from the direction (ϕ Tx = −20, ϕ Rx = −18), where the Tx and Rx are looking toward a glass door on the opposite site of the entrance of VHE (see Figure 2). Analyzing the corresponding Max‐Dir PDP in Figure 6 (a) we observe that the strongest component has a detour of 46.5 m (consistent with the reflection coming from the entrance A), and thus shows a delay much larger than the LoS component at 15.9 m. The distance and direction were verified using Google Earth software. Additionally, we observe more MPCs with detours between 20 and 40 m corresponding to reflections at the pillars in the area. However, the reflected power is low due to the small cross‐section of the area where the beam can hit the object. Additional MPCs can be observed at ϕ Tx = −30, ϕ Rx = −12 (1 in Figure 6), ϕ Tx = −30, ϕ Rx = −54 (2 in Figure 6), and ϕ Tx = 30, ϕ Rx = −66 (3 in Figure 6). For the first two cases, the Tx and Rx horns look toward the pillars located in the middle area. The third MPCs occur when the Tx looks to the last row of pillars and the Rx similarly to the previous cases looks toward the pillars. Additional components in this scenario show larger detours, larger than 100 m in some cases, as observed in Figure 6 (b) (blue line).
Figure 6.
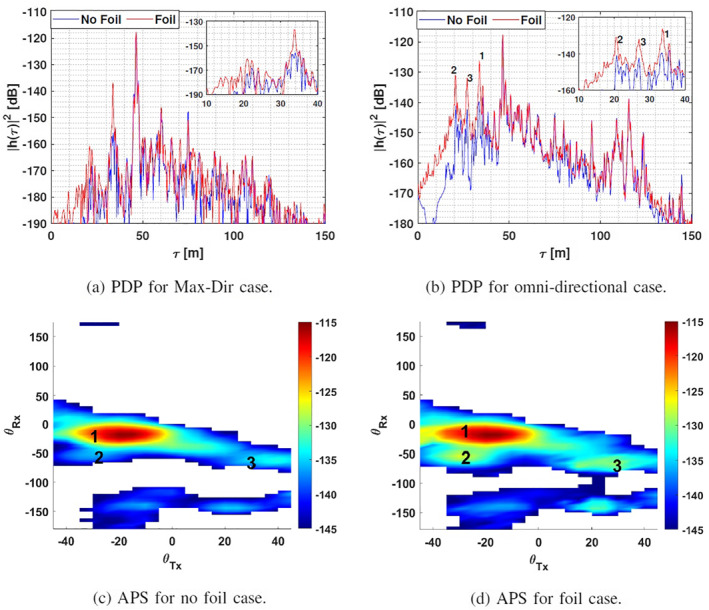
Power delay profiles and angular power spectra comparisons for the scenario.
The impact of the foil can be seen more clearly in the APSs shown in Figure 6 (c) and (d) where the MPCs 1, 2 and three increase their power by 6 dB on average. In Figure 6 (c), we observe these MPCs in the delay domain with the omni‐directional PDP. The delay for these 3 cases are at 33.6, 27 and 20.4 respectively. All of them have detours less than 46 m because they come from reflections of the pillars located closer to the antennas. As expected, adding the foil in the pillars increased the reflected power coming from them.
The comparison between the condensed channel parameters for the foil and no foil cases is shown in Table 6. Adding foil decreases the path loss, increases delay spread, reduces κ 1 and increases the angular spread at both Tx and Rx due to the increase in power of the MPCs. For pathloss and κ 1, the impact is smaller for the Max‐Dir case than for the omni‐case, because most of the column‐reflected components do not fall into the Max‐Dir beam. However, for the rms delay spread, the impact is larger in the Max‐Dir case: while there is only two (relatively weak) column‐reflected component in the Max‐Dir beam, they are the second‐ and third‐most significant MPCs in this setting, thus driving the rms delay spread from an extremely small value to a (still small, but) significantly higher value.
Table 6.
Estimated Parameters for All Measurement Points
| σ τ | PL | κ 1 | σ° | ||||||
|---|---|---|---|---|---|---|---|---|---|
| Omni | Max‐dir | Omni | Max‐dir | Omni | Max‐dir | Tx | Rx | ||
| VHE | No foil | −74.98 | −83.12 | 114.81 | 115.51 | 9.21 | 16.15 | 0.22 | 0.35 |
| Foil | −74.12 | −81.62 | 113.54 | 115.26 | 4.57 | 15.13 | 0.26 | 0.4 | |
| EEB 5F | LoS, No glass | −74.51 | −86.4 | 96.35 | 99.39 | 3.78 | 13.24 | 0.9 | 0.99 |
| LoS, Glass | −73.47 | −86.82 | 95.99 | 100.11 | 1.55 | 10.84 | 0.94 | 1 | |
| EEB 539 | LoS, No glass | −86.22 | −87.68 | 86.57 | 86.74 | 12.27 | 16.15 | 0.18 | 0.53 |
| LoS, Glass | −87.41 | −89.56 | 94.92 | 95.24 | 12.84 | 19.54 | 0.17 | 0.56 | |
| NLoS, No glass | −78.79 | −79.86 | 103.63 | 106.67 | −2.07 | 4 | 0.23 | 0.88 | |
| NLoS, Glass | −79.85 | −96.46 | 104.58 | 114.59 | −7.4 | 5.79 | 0.44 | 0.83 | |
| EEB 110 | LoS, No blinds | −82.87 | −87.49 | 87.22 | 88.27 | 7.67 | 20.66 | 0.57 | 0.48 |
| LoS, Blinds | −84.06 | −88.55 | 86.72 | 87.22 | 13.35 | 21.23 | 0.57 | 0.31 | |
| NLoS, No blinds | −79.12 | −86.52 | 93.26 | 97.5 | −3.16 | 10.14 | 0.48 | 0.93 | |
| NLoS, Blinds | −79.23 | −84.22 | 92.81 | 96.13 | −0.96 | 14.53 | 0.47 | 0.91 | |
If the channel is analyzed from a systems design point of view, the impact of the foil is more noticeable. Wireless communication systems do not have large/infinite dynamic range. For instance, if we set a dynamic range of 15 dB in the system, we observe the large impact of the foil on the MPC components, as shown in Figure 7. The impact on system design becomes immediately clear: instead of a single MPC carrying all the power, now at least two MPCs are present ‐ this can be a drawback because an equalizer is required, but also an advantage because it provides diversity. The existence of additional MPCs in other directions also enables beam diversity, so that the system can switch directions when the strongest MPC is blocked. Assuming that the system sensitivity limit (S) is at − 132 dB path gain, then the no‐foil case has no beam diversity, while the foil case does provide three alternative beams (1,2 and 4; three is excluded because its associated power is lower than S).
Figure 7.
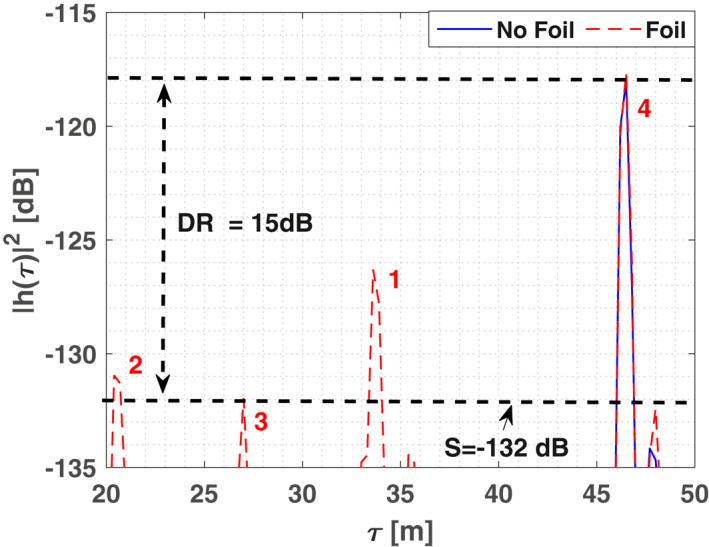
Omni‐directional power delay profiles observed by a system with S = −132 dB.
4.2. EEB fifth Floor
The EEB fifth floor scenario is an indoor corridor, therefore, we can expect a waveguiding effect with the signals concentrated along the axis of the corridor. A large concentration of power is observed in the LoS direction and close to ϕ = 180° because of the reflections coming from the door at the other end of the corridor. When we add the glass in the experiment, the reflected components are increased since the glass is placed behind the antennas and on both sides of the wall.
Figure 8 shows components with 22.2 and 24 m detours with a small increment due to the reflected power on the glasses along the corridor. The largest impact is observed with the MPC at 50.7 m, showing an increase of 4 dB due to the glass placed at the end of the corridor, in the direction toward the back of the Rx. Subsequent MPCs also show an increment compared to their counterparts without glass.
Figure 8.
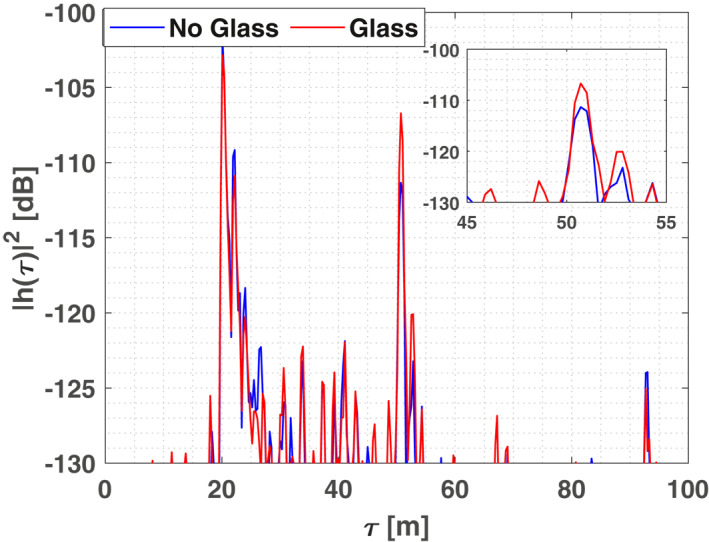
Power delay profiles comparison for line of sight measurement of electrical engineering center fifth floor.
These impacts are also observed when analyzing the estimated parameters. There is a decrease in the PL and angular spread due to the reduction of MPCs by the glass. On the other hand, σ τ and κ 1 showed an increment, due to the same reduction of MPCs. The full description of the estimated parameters for the LoS and NLoS measurement in this scenario is shown in Table 6.
4.3. EEB 539
In this scenario, a glass rectangle was placed at the entrance of the room, therefore, the beam has to go through the glass to enter the room. The anticipated effect of this experiment is to observe a significant reduction in power of the MPCs since the glass will reflect most of the power away from the room. Figure 9 shows the omni‐directional PDP where we observed the power reduction of MPCs by approximately 8 dB when the glass is placed. Figure 10 shows APSs for both the cases, where we observe a clear reduction in power of the LoS MPC.
Figure 9.
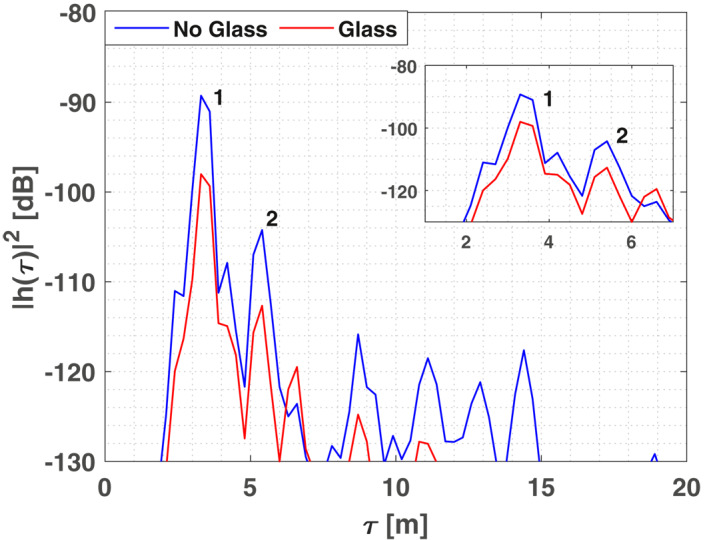
Omni‐directional power delay profiles comparison for line of sight case of electrical engineering center 539.
Figure 10.
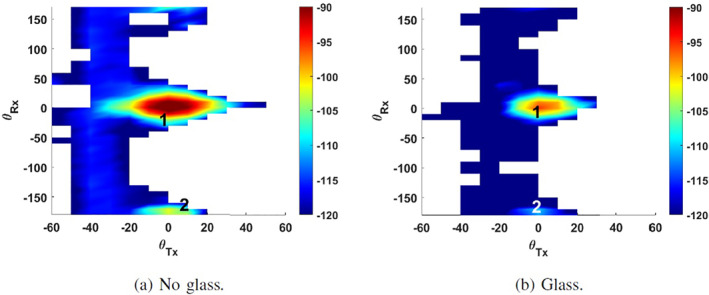
Angular power spectra for line of sight case of electrical engineering center 539.
The estimated parameters in this case show a different behavior. Delay spread is only reduced by 1 dBs, κ 1 only changes by 2 dB because all the MPCs are attenuated at the same time. However, the biggest impact is observed in the path loss with 8 dB attenuation due to the penetration loss of the glass.
The NLoS case shows a similar behavior as the LoS. Here we observe a reduction of power in the MPCs as well. The APS shown in Figure 11 demonstrates the reduction of the main MPC. Similarly, the Max‐Dir direction shows the attenuation of the MPCs due to the glass (see Figure 12).
Figure 11.
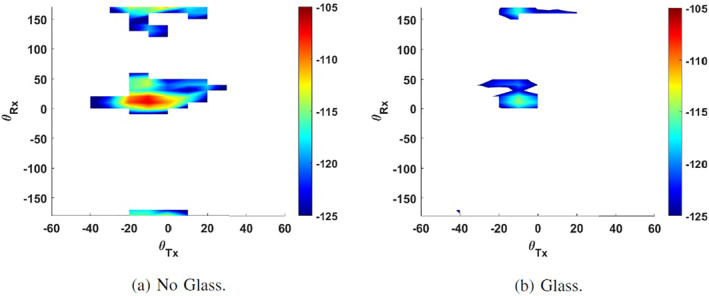
Angular power spectra for non line of sight case of electrical engineering center 539.
Figure 12.
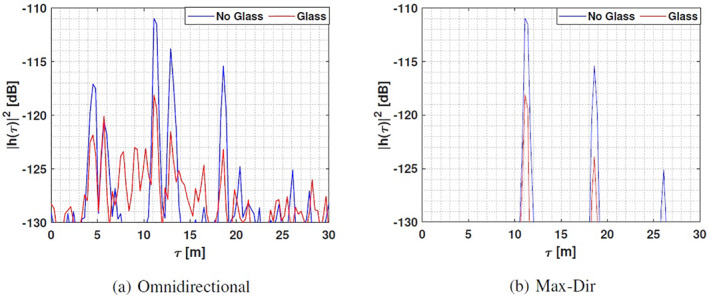
Power delay profiles comparison for non line of sight measurement of electrical engineering center 539.
In the case of the estimated parameters, the largest impact is observed in the delay spread, angular spread and κ 1. The details about the estimated parameters for the LoS and NLoS case for this scenario is shown in Table 6.
4.4. EEB 110
For the EEB 110 measurements, we investigate the impact of drawing the blinds. We can anticipated that the LoS MPC should not be affected by this change but MPCs involving reflections from the windows will suffer an impact from the blinds. Since the blinds are metallic, but do not have a flat surface, it is not clear from inspection whether they will increase or decrease the reflections from the window area.
Indeed, analyzing the APSs in Figure 13 we see no significant impact on the LoS MPC located at ϕ Tx = −40°, ϕ Rx = 40° (denoted by 1). There is an MPC at ϕ Tx = 50°, ϕ Rx = 50° (denoted by 3); this MPC is produced by the reflection of the signal on the channel sounder, which was placed 1m to the left of the antenna. However, the MPCs at ϕ Tx = −20°, ϕ Rx = 150° (denoted by 2) and ϕ Tx = −10°, ϕ Rx = 10° (denoted by 4) show a change in the received power, in this case attenuation, when the blinds were drawn. The attenuation most likely is a result of how the curved surface of the blinds affects the reflection of the ray coming from the Tx antenna, and so attenuating it when reaching the Rx.
Figure 13.
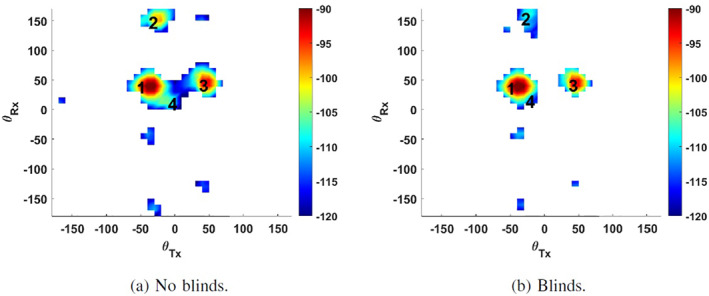
Angular power spectra for line of sight case of electrical engineering center 110.
Analyzing this effect from the delay domain, we observe in Figure 14 the attenuation of delay bins between 5 and 15 m coming from reflections at the window and whiteboard. Looking at the estimated parameters, we observe small variations in delay spread, path loss and κ 1 because the impact is only in low power MPCs instead of the LoS. The Rx angular spread is reduced due to the attenuation in power of the MPCs reflected from the window behind the antenna. However, when considering a system with limited (20 dB) dynamic range, we find that presence of the blinds eliminates the two available beam diversity directions, making the system more sensitive to LoS blockage.
Figure 14.
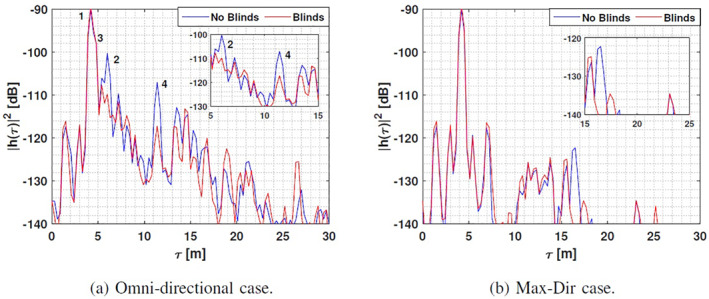
Power delay profiles comparison for line of sight case of electrical engineering center 110.
For the NLoS case, the impact of the blinds is larger, because the MPCs are mainly produced by reflections from the window behind the antenna. Figure 15 shows the APS when the blinds are drawn and when they are not. As can be observed, the main MPCs showed an increment in power. For instance, the MPC located at ϕ Tx = −20°, ϕ Rx = 20° (denoted by 2) is a double reflection from the Tx to the Rx hitting the window behind and the whiteboard in front of the antenna; when the blinds are used we observed an increase of power. This effect is related to the scattering produced by the curved blinds, which change the reflection coming from the window which is reflected by the whiteboard in front of the antenna. Another MPC located at ϕ Tx = −30°, ϕ Rx = 150° (denoted by 1), where the Rx looks toward the back window, has the opposite effect with a reduction of 11dB approximately.
Figure 15.
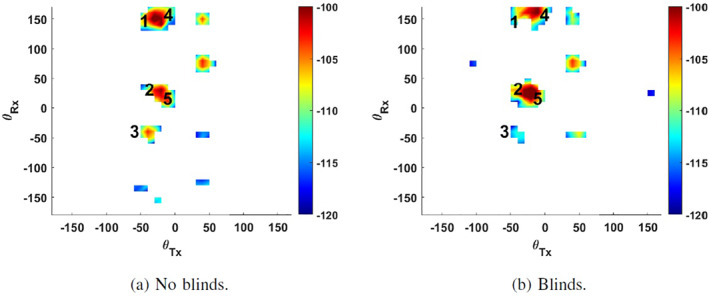
Angular power spectra for non line of sight case of electrical engineering center 110.
When analyzing the delay domain, the strongest delay bins changed completely when using the blinds. In Figure 14b the strongest delay bin changed from 8.4 to 9.9 m indicating an additional delay provided by the blinds. Figure 16a also presents additional delay bins that were changed by the blinds. In summary, the blinds altered MPCs differently, increasing power in some cases and doing the opposite in other because of the curvature of the blinds, affecting the specular reflection coming from the back window. This clearly shows that the blinds not only change the strength of the MPCs but also the directions.
Figure 16.
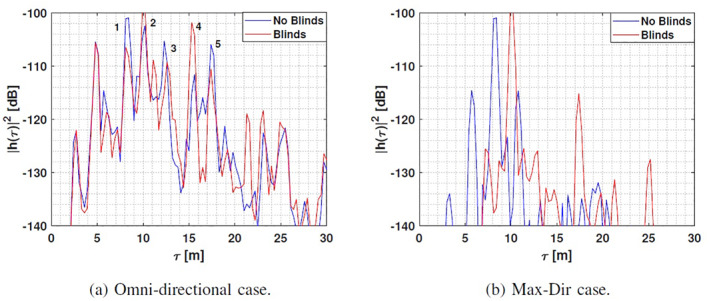
Power delay profiles comparison for non line of sight case of electrical engineering center 110.
Our conjecture for the estimated parameters is to observe significant changes in the estimated parameters. The most significant changes are observed in κ 1 due to the variation in power of the MPCs. Path loss, delay spread and angular spread were not significantly affected even though the MPCs showed a significant change when the blinds were used. Table 6 shows a summary of all the parameters for the LoS and NLoS cases for this scenario.
Applying the systems design criteria used in the VHE measurement, we observed that for both LoS and NLoS cases, the MPCs within a limited dynamic range change significantly. For the LoS case applying a 20 dB dynamic range, we observe that without the blinds we see 4 MPCs at the Rx but when the blinds are used, the number of MPCs is reduced to 1. Similarly, in the NLoS case, the impact is also noticeable, when the blinds were used, the number of MPCs increased and some of them increased their power, impacting the estimated characteristics.
5. Conclusions
In this paper, we covered a number of interesting scenarios from the perspective of THz communications and performed measurements to investigate how changes in the environment affect the channel. We showed that with the addition of a passive reflectors in outdoor scenarios, MPC powers (up to 6 dB on average was observed) and angular diversity increased. Our indoor measurements showed that the addition of reflecting surfaces such as glass in corridors also increases MPC powers (up to 4 dB in some cases). Further indoor experiments showed that, transmission through high‐tint glass caused significant attenuation (8–10 dB), and the presence or absence of window blinds significantly changed the channel characteristics. Variations in the scenario may not necessarily offer an impact in the condensed channel parameters that are commonly used for concise channel description. However, from a systems point of view, the channel changes induced by the scenario variations might have a significant impact, particularly in the presence of a limited dynamic range. It is important to emphasize that our work does not imply that all systems will show a drastic variation when variations in the scenario happen. Rather, we show that it can occur in at least some scenarios, and that a robust system design has to work also in those. Thus, our focus has been on showing sample scenarios in which this effect is noticeable and analyze its impact to channel characteristics and a possible system that can be used in these scenarios.
Acknowledgments
The work of USC was partly supported by the Semiconductor Research Corporation (SRC) under the ComSenTer program, NSF under grant number 2133655, NIST under grant number 60NANB21D138, Samsung Research America and the Foreign Fulbright Ecuador SENESCYT Program. Helpful discussions with Sundeep Rangan and Mark Rodwell are gratefully acknowledged. We thank Michael Neuman for his help in proofreading the manuscript.
Gomez‐Ponce, J. , Abbasi, N. A. , Kondaveti, R. , Kumar, A. , Abu‐Surra, S. , Xu, G. , et al. (2022). Impact of common reflecting and absorbing building materials on THz multipath channels. Radio Science, 57, e2021RS007412. 10.1029/2021RS007412
Data Availability Statement
Raw measurement data for the current study are confidential based on sponsor agreements. Condensed channel parameters are already tabulated in the paper for use by future studies.
References
- Abbasi, N. A. , Gomez‐Ponce, J. , Burghal, D. , Kondaveti, R. , Abu‐Surra, S. , & Xu, G. , et al. (2021). Double‐directional channel measurements for urban Thz communications on a linear route. In. 2021 IEEE international conference on communications workshops (ICC workshops) (p. 1–6). 10.1109/ICCWorkshops50388.2021.9473566 [DOI] [Google Scholar]
- Abbasi, N. A. , Gomez‐Ponce, J. , Shaikbepari, S. M. , Rao, S. , Kondaveti, R. , & Abu‐Surra, S. , et al. (2021). Ultra‐wideband double directional channel measurements for Thz communications in urban environments. In Icc 2021‐2021 IEEE international conference on communications (ICC). 10.1109/icc42927.2021.9500510 [DOI] [Google Scholar]
- Abbasi, N. A. , Hariharan, A. , Nair, A. M. , Almaiman, A. S. , Rottenberg, F. B. , Willner, A. E. , & Molisch, A. F. (2019). Double directional channel measurements for Thz communications in an urban environment. arXiv preprint arXiv:1910.01381. [Google Scholar]
- Abbasi, N. A. , Hariharan, A. , Nair, A. M. , Almaiman, A. S. , Rottenberg, F. B. , Willner, A. E. , & Molisch, A. F. (2020). Double directional channel measurements for Thz communications in an urban environment. In ICC 2020‐2020 IEEE international conference on communications (ICC) (pp. 1–6). 10.1109/icc40277.2020.9148631 [DOI] [Google Scholar]
- Abbasi, N. A. , Hariharan, A. , Nair, A. M. , & Molisch, A. F. (2020). Channel measurements and path loss modeling for indoor Thz communication. In 2020 14th European conference on antennas and propagation (eucap) (pp. 1–5). 10.23919/eucap48036.2020.9135643 [DOI] [Google Scholar]
- Abbasi, N. A. , Molisch, A. F. , & Zhang, J. C. (2020). Measurement of directionally resolved radar cross section of human body for 140 and 220 Ghz bands. In 2020 IEEE wireless communications and networking conference workshops (pp. 1–4). 10.1109/wcncw48565.2020.9124817 [DOI] [Google Scholar]
- Abbasi, N. A. , Ponce, J. G. , Kondaveti, R. , Kumar, A. , Bhagat, E. , & Rao, R. N. S. , et al. (2021). Thz band channel measurements and statistical modeling for urban microcellular environments. arXiv preprint. [Google Scholar]
- Abbasi, N. A. , Ponce, J. G. , Kondaveti, R. , Shaikbepari, S. M. , Rao, S. , & Abu‐Surra, S. , et al. (2021). Thz band channel measurements and statistical modeling for urban D2D environments. arXiv preprint. [Google Scholar]
- Akyildiz, I. F. , Jornet, J. M. , & Han, C. (2014). Terahertz band: Next Frontier for wireless communications. Physical Communication, 12, 16–32. 10.1016/j.phycom.2014.01.006 [DOI] [Google Scholar]
- Chen, Z. , Ma, X. , Zhang, B. , Zhang, Y. , Niu, Z. , Kuang, N. , & Li, S. (2019). A survey on terahertz communications. China Communications, 16(2), 1–35. [Google Scholar]
- Collonge, S. , Zaharia, G. , & El Zein, G. (2003). Influence of the furniture on 60 ghz radio propagation in a residential environment. Signals, circuits and systems, 2003. SCS 2003. International symposium on (Vol. 2, pp. 413–416). [Google Scholar]
- Debaenst, W. , Feys, A. , Cuiñas, I. , Garcia Sanchez, M. , & Verhaevert, J. (2020). RMS delay spread vs. coherence bandwidth from 5g indoor radio channel measurements at 3.5 GHz band. Sensors, 20(3), 750. 10.3390/s20030750 [DOI] [PMC free article] [PubMed] [Google Scholar]
- Du, K. , Ozdemir, O. , Erden, F. , & Guvenc, I. (2021). Sub‐terahertz and mmwave penetration loss measurements for indoor environments. arXiv preprint arXiv:2103.02745. [Google Scholar]
- Fleury, B. H. (2000). First‐and second‐order characterization of direction dispersion and space selectivity in the radio channel. IEEE Transactions on Information Theory, 46(6), 2027–2044. 10.1109/18.868476 [DOI] [Google Scholar]
- Gomez‐Ponce, J. , Burghal, D. , Abbasi, N. A. , Hariharan, A. , Jakhetia, G. , Chaganlal, P. , & Molisch, A. F. (2020). Directional delay spread and interference quotient analysis in sub‐7GHz wi‐fi bands. In Globecom 2020—2020 IEEE global communications conference (pp. 1–6). 10.1109/GLOBECOM42002.2020.9322252 [DOI] [Google Scholar]
- Guerin, S. (1996). Indoor wideband and narrowband propagation measurements around 60.5 GHz in an empty and furnished room. Proceedings of vehicular technology conference‐vtc, 1, 160–164. [Google Scholar]
- Han, C. , Wang, Y. , Li, Y. , Chen, Y. , Abbasi, N. A. , Kürner, T. , & Molisch, A. F. (2021). Terahertz wireless channels: A holistic survey on measurement, modeling, and analysis. arXiv preprint arXiv:2111.04522. [Google Scholar]
- Hur, S. , Cho, Y.‐J. , Lee, J. , Kang, N.‐G. , Park, J. , & Benn, H. (2014). Synchronous channel sounder using horn antenna and indoor measurements on 28 GHz. In 2014 IEEE international black sea conference on communications and networking (blackseacom) (pp. 83–87). 10.1109/BlackSeaCom.2014.6849010 [DOI] [Google Scholar]
- Isberg, R. , & Chufo, R. (1978). Passive reflectors as a means for extending uhf signals down intersecting cross cuts in mines or large corridors. In 28th IEEE vehicular technology conference (Vol. 28, pp. 267–272). 10.1109/vtc.1978.1622546 [DOI] [Google Scholar]
- Kim, S. , & Zajić, A. G. (2015). Statistical Characterization of 300‐GHz propagation on a desktop. IEEE Transactions on Vehicular Technology, 64(8), 3330–3338. 10.1109/TVT.2014.2358191 [DOI] [Google Scholar]
- Kürner, T. , & Priebe, S. (2014). Towards THz Communications—Status in research, standardization and regulation. Journal of Infrared, Millimeter and Terahertz Waves, 35(1), 53–62. 10.1007/s10762-013-0014-3 [DOI] [Google Scholar]
- Molisch, A. F. (2011). Wireless communications (2nd ed.). IEEE Press–Wiley. [Google Scholar]
- Piesiewicz, R. , Jansen, C. , Mittleman, D. , Kleine‐Ostmann, T. , Koch, M. , & Kurner, T. (2007). Scattering analysis for the modeling of Thz communication systems. IEEE Transactions on Antennas and Propagation, 55(11), 3002–3009. 10.1109/tap.2007.908559 [DOI] [Google Scholar]
- Priebe, S. , Jastrow, C. , Jacob, M. , Kleine‐Ostmann, T. , Schrader, T. , & Kurner, T. (2010). A measurement system for Propagation measurements at 300 GHz. PIERS Proceedings, 704. [Google Scholar]
- Rappaport, T. S. , Xing, Y. , Kanhere, O. , Ju, S. , Madanayake, A. , Mandal, S. , & Trichopoulos, G. C. (2019). Wireless communications and applications above 100 GHz: Opportunities and challenges for 6 g and beyond. IEEE Access, 7, 78729–78757. 10.1109/access.2019.2921522 [DOI] [Google Scholar]
- Shafi, M. , Molisch, A. F. , Smith, P. J. , Haustein, T. , Zhu, P. , Silva, P. D. , & Wunder, G. (2017). 5G: A tutorial overview of Standards, trials, challenges, deployment and practice. IEEE Journal on Selected Areas in Communications. 10.1109/JSAC.2017.2692307 [DOI] [Google Scholar]
- Sheikh, F. , Mabrouk, I. B. , Alomainy, A. , Abbasi, Q. H. , & Kaiser, T. (2019). Indoor material properties extraction from scattering parameters at frequencies from 750 GHz to 1.1 Thz. In Ieee MTT‐s international microwave workshop series on advanced materials and processes for RF and Thz applications (IMWS‐AMP) (pp. 28–30). 10.1109/imws-amp.2019.8880096 [DOI] [Google Scholar]
- Siamarou, A. G. , & Al‐Nuaimi, M. (2010). A wideband frequency‐domain channel‐sounding system and delay‐spread measurements at the license‐free 57‐to 64‐GHz band. IEEE Transactions on Instrumentation and Measurement, 59(3), 519–526. 10.1109/tim.2009.2023105 [DOI] [Google Scholar]
- Talbi, L. , & LeBel, J. (2012). Extending 60 GHz UWB coverage to medium distances under NLOS conditions. In 2012 international conference on wireless communications in underground and confined areas (pp. 1–6). 10.1109/icwcuca.2012.6402502 [DOI] [Google Scholar]
- Tataria, H. , Shafi, M. , Molisch, A. F. , Dohler, M. , Sjöland, H. , & Tufvesson, F. (2021). 6g wireless systems: Vision, requirements, challenges, insights, and opportunities. Proceedings of the IEEE. 10.1109/jproc.2021.3061701 [DOI] [Google Scholar]
- Wu, Q. , Zhang, S. , Zheng, B. , You, C. , & Zhang, R. (2021). Intelligent reflecting surface aided wireless communications: A tutorial. IEEE Transactions on Communications. 10.1109/tcomm.2021.3051897 [DOI] [Google Scholar]
- Xing, Y. , & Rappaport, T. S. (2021). Propagation measurements and path loss models for sub‐Thz in urban microcells. arXiv preprint arXiv:2103.01151. [Google Scholar]
- Xing, Y. , Rappaport, T. S. , & Ghosh, A. (2021). Millimeter wave and sub‐Thz indoor radio propagation channel measurements, models, and comparisons in an office environment. arXiv preprint arXiv:2103.00385. [Google Scholar]
- Zhang, G. , Saito, K. , Fan, W. , Cai, X. , Hanpinitsak, P. , Takada, J.‐I. , & Pedersen, G. F. (2018). Experimental characterization of millimeter‐wave indoor propagation channels at 28 GHz. IEEE Access, 6, 76516–76526. 10.1109/access.2018.2882644 [DOI] [Google Scholar]
Associated Data
This section collects any data citations, data availability statements, or supplementary materials included in this article.
Data Availability Statement
Raw measurement data for the current study are confidential based on sponsor agreements. Condensed channel parameters are already tabulated in the paper for use by future studies.


