

Abstract
Background and Aims
Lipopolysaccharide (LPS) clearance is delayed in cholestatic liver diseases. While compromised clearance by Kupffer cells (KCs) is involved, the role of LPS uptake into hepatocytes and canalicular excretion remains unclear.
Approach and Results
Wild‐type (WT) and bile salt export pump (Bsep) knockout (KO) mice were challenged i.p. with LPS. Liver injury was assessed by serum biochemistry, histology, molecular inflammation markers, and immune cell infiltration. LPS concentrations were determined in liver tissue and bile. Subcellular kinetics of fluorescently labeled LPS was visualized by intravital two‐photon microscopy, and the findings in Bsep KO mice were compared to common bile duct–ligated (BDL) and multidrug resistance protein 2 (Mdr2) KO mice. Changes in gut microbiota composition were evaluated by 16S ribosomal RNA gene amplicon sequencing analysis. Bsep KO mice developed more pronounced LPS‐induced liver injury and inflammatory signaling, with subsequently enhanced production of proinflammatory cytokines and aggravated hepatic immune cell infiltration. After LPS administration, its concentrations were higher in liver but lower in bile of Bsep KO compared to WT mice. Intravital imaging of LPS showed a delayed clearance from sinusoidal blood with a basolateral uptake block into hepatocytes and reduced canalicular secretion. Moreover, LPS uptake into KCs was reduced. Similar findings with respect to hepatic LPS clearance were obtained in BDL and Mdr2 KO mice. Pretreatment with the microtubule inhibitor colchicine inhibited biliary excretion of LPS in WT mice, indicating that LPS clearance is microtubule‐dependent. Microbiota analysis showed no change of the gut microbiome between WT and Bsep KO mice at baseline but major changes upon LPS challenge in WT mice.
Conclusions
Absence of Bsep and cholestasis in general impair LPS clearance by a basolateral uptake block into hepatocytes and consequently less secretion into canaliculi. Impaired LPS removal aggravates hepatic inflammation in cholestasis.

Abbreviations
- ALT
alanine aminotransferase
- AP
alkaline phosphatase
- AP‐1
activator protein 1
- AST
aspartate aminotransferase
- ASV
amplicon sequencing variant
- BA
bile acid
- BDL
bile duct ligation
- Bsep
bile salt export pump
- CD
cluster of differentiation
- H&E
hematoxylin and eosin
- Icam
intercellular adhesion molecule
- IF
immunofluorescence
- Inos
induced nitric oxide synthase
- KC
Kupffer cell
- KO
knockout
- LPS
lipopolysaccharide (endotoxin)
- Ly6G
lymphocyte antigen 6 complex locus G6D
- Mac‐2
galectin‐3
- Mcp1
monocyte chemotactic protein 1
- Mdr1a/2
multidrug resistance protein 1a/2
- MPO
myeloperoxidase
- Mrp2/3/4
multidrug resistance–associated protein 2/3/4
- Ntcp
sodium taurocholate cotransporting polypeptide
- Ostα/β
Organic solute transporter alpha/beta
- Vcam
vascular cell adhesion molecule
- WT
wild‐type
INTRODUCTION
The bile salt export pump (Bsep) is the main canalicular efflux system for bile acids (BAs).[ 1 ] Although lack of Bsep causes severe cholestasis in humans,[ 2 , 3 ] mice lacking Bsep develop persistent but nonprogressive intrahepatic cholestasis.[ 4 ] This involves compensatory mechanisms characterized by induction of hepatic BA hydroxylating enzymes, resulting in a hydrophilic and potentially nontoxic hepatic BA pool, as well as recruitment of alternative BA transport systems, facilitating their preferably urinary excretion.[ 5 , 6 , 7 , 8 ] Notably, metabolic preconditioning with a hydrophilic hepatic BA composition protects Bsep knockout (KO) mice from acquired cholestatic liver injury.[ 7 ] Development of hepatic inflammation and injury in cholestasis has mainly been attributed to direct toxicity and proinflammatory properties of accumulating BAs.[ 9 , 10 ] Moreover, interruption of enterohepatic circulation of BAs in cholestasis and subsequent lack of intraluminal BAs may induce changes in gut microbiota and impair intestinal integrity with increased translocation of bacterial components and pathogen‐associated molecular patterns such as lipopolysaccharide (LPS, endotoxin), triggering innate immunity and inflammation.[ 11 , 12 ] Cholestatic patients show increased levels of circulating markers of bacterial translocation, such as lipoprotein binding protein (LBP) and soluble cluster of differentiation 14 (CD14), which were associated with poor prognosis.[ 13 ] Furthermore, development of endotoxemia in cholestasis is frequently related to high susceptibility to an exaggerated systemic inflammatory response and increased postoperative complications in affected patients.[ 14 ] Both Kupffer cells (KCs) and hepatocytes participate in hepatic clearance of gut‐derived LPS. Small amounts of endogenous LPS continuously reaching the liver through the portal circulation can be efficiently removed by KC‐mediated phagocytosis. However, for hepatic detoxification of higher LPS doses, as found in sepsis or upon experimental injection, biliary excretion of LPS by hepatocytes is essential.[ 15 , 16 , 17 , 18 ] Notably, KC‐mediated clearing capacity of the liver for bacterial products including LPS is severely impaired in cholestasis.[ 19 , 20 , 21 ] However, the mechanisms of potentially impaired removal of LPS through bile due to cholestasis are still poorly understood. We hypothesized that hepatic LPS retention in cholestasis may lead to activation of proinflammatory signaling in the liver and subsequent production of proinflammatory cytokines and hepatic infiltration of immune cells. Accordingly, Bsep KO mice, although characterized by an anti‐inflammatory BA pool, might still be more susceptible to LPS‐mediated liver injury due to BA‐independent, LPS‐mediated proinflammatory signaling upon impaired hepatic clearance and biliary excretion in a cholestatic setting.
In this study we explored whether the specific absence of Bsep and/or cholestasis in general (1) modifies hepatic inflammatory signaling and response to LPS and (2) affects clearance and biliary excretion of LPS. A better understanding of the relationship between key steps underlying the development of inflammation in cholestasis could provide the basis for developing therapeutic strategies in treatment and prevention of cholestasis‐associated systemic complications and progression of cholestatic liver disease.
MATERIALS AND METHODS
All animals received humane care according to the criteria outlined in the NIH 'Guide for the Care and Use of Laboratory Animals' and the institutional animal care and use committee approved all treatment.
Animal experiments
Bsep KO FVB/N mice were kindly provided as breeder pairs by the British Columbia Cancer Research Center[ 4 ]; multidrug resistance protein 2 (Mdr2) KO FVB/N mice were initially obtained from Jackson Laboratory (Bar Harbor, ME).[ 22 ] Details on the experimental procedures using LPS and the microtubule inhibitor colchicine are provided in the Supporting Information. Bile duct ligation (BDL) was performed in male C57BL6/N wild‐type (WT) mice (Janvier Labs, France) as described[ 23 ] (also see Supporting Materials and Methods).
Serum biochemistry
Blood was collected from the vena cava at harvesting, and serum liver enzymes and BAs were measured as described.[ 24 ]
Liver histology and immunofluorescence staining
Liver tissue sections were stained with hematoxylin and eosin (H&E) for histological evaluation as described.[ 24 ] Immunofluorescence (IF) staining for the macrophage marker galectin‐3 (Mac‐2) and the neutrophil marker myeloperoxidase (MPO) was used to characterize hepatic immune cell infiltration, and tubulin IF was used for microtubule immunostaining; details are provided in the Supporting Information.
Gene expression analysis and western blotting
Additional information on the methods and antibodies used is provided in the Supporting Information.
Hepatic flow cytometry
A liver single‐cell suspension was prepared using fresh liver tissue and stained with primarily labeled antibodies for relative leukocyte abundance quantification; details are provided in the Supporting Information.
Limulus amebocyte lysate assay
Liver and bile samples were assayed for LPS levels using a commercially available Pierce Chromogenic Endotoxin Quantification kit (catalog no. A39552; Thermo Fisher Scientific) according to the manufacturer's instructions.[ 25 ]
Intravital imaging
Functional intravital imaging of LPS clearance in mouse livers was performed using a customized inverted two‐photon microscope LSM MP7 (Zeiss, Jena, Germany) as described.[ 23 , 26 ] Further details including the dyes/markers used are provided in the Supporting Information.
Gut microbiota analysis
16S Ribosomal RNA gene amplicon sequencing analysis was used to determine the changes in gut microbiota composition between the groups and is described in detail in the Supporting Information.
Statistical analysis
Statistical analysis was performed using the Student t test or two‐way analysis of variance test, followed by the Tukey post hoc test, according to the number of independent groups, unless otherwise stated. Data are reported as means ± SD. p < 0.05 was considered statistically significant.
RESULTS
Absence of Bsep aggravates LPS‐induced liver injury in mice
Already at baseline (without LPS) Bsep KO mice showed elevated serum levels of markers of hepatocellular damage (alanine aminotransferase [ALT] and aspartate aminotransferase [AST]) and cholestasis (alkaline phosphatase [AP] and BAs) (Figure 1A; Figure S1A). LPS treatment increased ALT and AST serum activities more profoundly in Bsep KO than in WT mice (Figure 1A) but not AP or BA levels (Figure 1A; Figure S1A). At the tissue level, H&E staining revealed more inflammatory cell infiltrates in Bsep KO compared to WT mice at baseline, which was further enhanced upon LPS challenge (Figure 1B). Notably, LPS challenge did not alter the adaptive up‐regulation of BA detoxifying/hydroxylating enzymes, cytochrome P450 2b10 (Cyp2b10) and Cyp3a11 (Figure S1B), or the basolateral transporters multidrug resistance–associated protein 3 (Mrp3) and Mrp4 at mRNA levels (Figure S1C) in Bsep KO mice, indirectly indicating that BA metabolism remained unchanged by the LPS treatment. Up‐regulation of Mdr1 (Figure S1D), as an alternative canalicular efflux route in Bsep KO, has been reported.[ 8 ] Moreover, mRNA expression of hepatic sodium taurocholate cotransporting polypeptide (Ntcp) and Mrp2 (Figure S1D) remained unchanged upon Bsep KO, which confirms at least partly maintained enterohepatic circulation in these mice. However, Ntcp and Mrp2 expression was profoundly reduced by LPS treatment independently of the presence or absence of Bsep (Figure S1D), in line with previous reports.[ 27 , 28 ] mRNA expression of intestinal organic solute transporter alpha (Ostα) and Ostβ (Figure S1E) was reduced upon loss of Bsep in mice, while LPS induced Ostβ expression in both treated groups.
FIGURE 1.

Absence of Bsep aggravates LPS‐induced hepatic injury in mice. WT (open bars) and Bsep KO mice (closed bars) were challenged with an i.p. injection of 8 mg/kg LPS from Escherichia coli and harvested after 6 h. (A) Hepatocellular injury, as reflected by elevated levels of transaminases (AST, ALT) in serum, was seen in Bsep KO mice already at baseline and increased by LPS challenge in both groups, again more pronounced in challenged Bsep KO mice compared to challenged WT mice. AP activity in serum, a marker of cholestasis and elevated in Bsep KO at baseline, was not further increased by LPS challenge. (B) H&E staining of liver tissue sections from LPS‐treated WT and Bsep KO mice and their corresponding untreated controls showing hepatic immune cell infiltration in Bsep KO mice at baseline and upon LPS injection, indicated by arrows in representative images (×20 magnification; scale bars, 100 µm). Data represent mean ± SD of n = 5–7 per experimental group. *Significant difference compared to untreated WT controls; #significant difference compared to untreated Bsep KO controls; §significant difference compared to LPS‐treated WT mice; p < 0.05
Aggravated cytokine response is accompanied by exacerbated immune cell infiltration upon LPS challenge in Bsep KO mice
LPS challenge induced an up‐regulation in hepatic proinflammatory cytokine mRNA expression, which was more pronounced in Bsep KO compared to WT mice (Figure 2A). Flow cytometry revealed prominent lymphocyte antigen 6 complex locus G6D–positive (Ly6G+) neutrophil infiltration into the liver tissue upon LPS treatment in both Bsep KO and WT mice (Figure 2B). Notably, a higher number of infiltrating neutrophils in the livers of Bsep KO mice was already noted at baseline. The findings were confirmed by IF staining of livers for the neutrophil marker MPO (Figure 2C).
FIGURE 2.

Aggravated cytokine response is accompanied by exacerbated immune cell infiltration upon LPS challenge in Bsep KO mice. (A) mRNA expression of proinflammatory cytokines Tnfα, Il1β, Il6, and Inos in WT and Bsep KO mice, with and without LPS challenge. Induction of all genes is stronger in Bsep KO (closed bars) compared to WT mice (open bars) upon LPS injection. (B) Representative flow‐cytometric plots of neutrophils in liver single‐cell suspension and quantification graph (upper panel) with mean positive cell number per 105 singlet events (also indicated in representative plots) showing enhanced infiltration of Ly6G+ neutrophils in LPS‐treated compared to control mice. Additionally, a higher number of infiltrating neutrophils in the livers of Bsep KO mice was already noted at baseline. The gating strategy is shown in Figure S2A. (C) IF staining for MPO+ cells (representative images, ×20 magnification; scale bars, 100 µm) shows aggravated neutrophil infiltration at baseline and upon LPS challenge in livers of Bsep KO compared to WT mice. The bar plot shows the number of MPO+ cells (red) per field of view determined using ImageJ (lower panel). Nuclei were counterstained with Hoechst (blue). Data represent mean ± SD of n = 4–7 per experimental group. *Significant difference compared to untreated WT controls; #significant difference compared to untreated Bsep KO controls; §significant difference compared to LPS‐treated WT mice; p < 0.05. Abbreviation: SSC‐A, side scatter A
In line with this, hepatic mRNA expression of markers of chemotaxis and cell adhesion monocyte chemotactic protein 1 (Mcp1), intercellular adhesion molecule (Icam), and vascular cell adhesion molecule (Vcam) was elevated already at baseline in Bsep KO compared to WT mice and further induced upon LPS challenge (Figure 3A). Hepatic CD14 mRNA level, as part of the toll‐like receptor 4 signaling cascade, was up‐regulated in Bsep KO mice at baseline and showed significantly stronger induction upon LPS challenge compared to treated WT mice (p < 0.05) (Figure 3A). Elevated baseline expression of hepatic chemotactic markers and adhesion molecules indicated that in Bsep KO mice immune cells may infiltrate the liver even prior to LPS challenge. This observation was confirmed by flow cytometry, which showed elevated numbers of F4/80+CD11b+ cells in the livers of Bsep KO mice at baseline, with a further increase after LPS treatment (Figure 3B). Mac‐2 immunohistochemical analysis in liver tissue further confirmed macrophage infiltration in livers of Bsep KO mice at baseline, which was enhanced upon LPS injection compared to WT mice (Figure 3C). Furthermore, flow‐cytometric analysis of immune cells revealed higher hepatic numbers of total CD45+ leukocytes, CD3+ T cells, and B220+ B cells in Bsep KO than in WT mice at baseline, which, however, did not change upon LPS challenge (Figure S2B,C). These findings indicate that not only does innate immunity react more strongly upon LPS challenge in Bsep KO mice but Bsep deficiency without LPS challenge is already sufficient to cause a proinflammatory microenvironment with a baseline activation of adaptive immunity.
FIGURE 3.
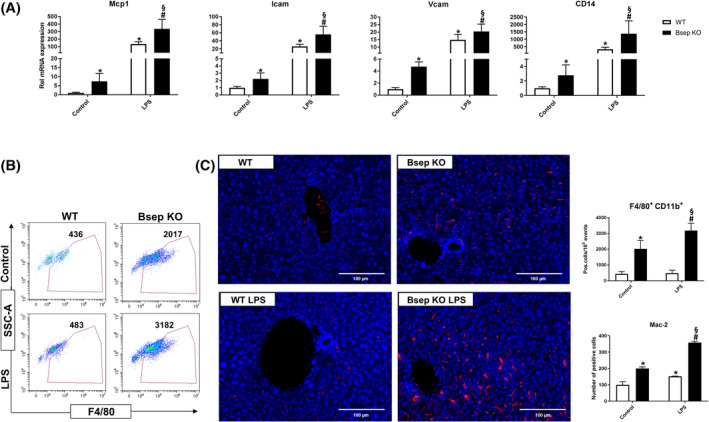
Elevated expression of chemotactic and adhesion markers mediates macrophage infiltration into the liver of Bsep KO mice at baseline and is aggravated upon LPS injection. (A) mRNA expression of chemotactic and adhesion markers Mcp1, Icam, and Vcam in WT and Bsep KO mice, with and without LPS challenge. All three markers are up‐regulated in Bsep KO mice (closed bars) at baseline and show further induction upon LPS treatment, which is stronger compared to WT mice (open bars). CD14, a marker for macrophage sensitivity to LPS, shows a similar expression pattern. (B) Flow‐cytometric analysis showing the relative number of F4/80+ macrophages in liver single‐cell suspensions of Bsep KO and WT mice at baseline as well as after LPS challenge. Representative plots and quantification graph (upper panel) with mean positive cell number per 105 singlet events (also indicated in representative plots) show more F4/80+ CD11b+ cells in livers of Bsep KO compared to WT mice. Gating strategy is shown in Figure S2A. (C) Representative immunohistochemical images for Mac‐2+ cells in liver (×20 magnification; scale bars, 100 µm) show increased macrophage infiltration at baseline in Bsep KO mice, which is further aggravated by LPS challenge. Quantification graph shows number of Mac‐2+ cells (red) per field of view determined using ImageJ (lower panel). Nuclei were counterstained with Hoechst (blue). Data represent mean ± SD of n = 4–7 per experimental group. *Significant difference compared to untreated WT controls; #significant difference compared to untreated Bsep KO controls; §significant difference compared to LPS‐treated WT mice; p < 0.05. Abbreviation: SSC‐A, side scatter A
Loss of Bsep aggravates LPS‐induced hepatic inflammation in mice due to activation of NF‐κB and activator protein 1
Hepatic mRNA expression of Nf‐κb1 and Nf‐κb2, as well as C‐jun and C‐fos, was significantly higher in LPS‐challenged Bsep KO compared to WT mice (Figure 4A). Accordingly, hepatic nuclear protein levels of NF‐κB subunits p50 and p65 were significantly increased in Bsep KO compared to WT mice upon LPS treatment (Figure 4B). In line, stronger nuclear expression of c‐Jun and phospho‐c‐Jun was detected in livers of LPS‐challenged Bsep KO mice, indicative of stronger activation of activator protein 1 (AP‐1) signaling upon LPS injection (Figure 4B). Interestingly, NF‐κB was already up‐regulated in Bsep KO mice at baseline, at both the mRNA and protein levels (Figure 4A,B). Additionally, hepatic nuclear translocation of c‐Jun and phospho‐c‐Jun was detected already at baseline in Bsep KO mice (Figure 4B). In summary, Bsep KO mice develop a stronger LPS‐induced hepatic inflammation compared to corresponding WT mice.
FIGURE 4.

Loss of Bsep aggravates LPS‐induced hepatic inflammation in mice due to activation of NF‐κB and AP‐1. (A) mRNA and (B) nuclear protein levels of NF‐κB and AP‐1 subunits are elevated in Bsep KO mice (closed bars) at baseline as well as upon LPS challenge compared to WT mice (open bars). Representative blots with corresponding quantifications are shown; stain‐free total protein staining was used as the normalization control and corresponding reference membrane photos are shown under each blot. Data represent mean ± SD of n = 5–7 per experimental group. *Significant difference compared to untreated WT controls; #significant difference compared to untreated Bsep KO controls; §significant difference compared to LPS‐treated WT mice; p < 0.05
Systemic LPS challenge leads to hepatic LPS accumulation in Bsep KO mice
Elevated endotoxin (LPS) levels are a common finding in various etiologies of liver disease including intrahepatic cholestasis.[ 29 ] We therefore investigated the effects of Bsep KO on hepatic LPS clearance. For this purpose, Bsep KO and corresponding WT mice were challenged with LPS (8 mg/kg, i.p.), and the levels of LPS were analyzed in liver tissue and in bile 6 h later. Strikingly, hepatic LPS levels were 2‐fold higher in Bsep KO compared to WT mice upon LPS treatment (Figure S3A). Accordingly, Lbp mRNA expression was significantly increased in Bsep KO mice following a similar pattern (Figure S3B). To test our hypothesis that hepatic endotoxin retention in Bsep KO mice may be caused by impaired biliary endotoxin excretion, we measured LPS levels in bile. Indeed, 6 h after LPS injection, the endotoxin concentration in bile was 5‐fold higher in WT compared to Bsep KO mice (Figure S3C). These findings indicate that the biliary route may be essential for LPS excretion and is impaired in Bsep KO mice.
Intravital imaging of fluorescently labeled LPS shows impaired hepatic clearance and biliary excretion of LPS in Bsep KO mice
In order to visualize the dynamics of the fate of LPS in the liver, WT and Bsep KO mice were subjected to i.v. bolus injection of Alexa Fluor 488–coupled LPS and monitored using intravital live imaging. Already within seconds after tail vein injection, the green fluorescent LPS was detected in liver sinusoids in both WT and Bsep KO mice (Figure 5; Video S1A,B). In WT mice, LPS uptake by resident KCs occurred during the first minutes after injection, and the green fluorescence was subsequently detected in bile canaliculi (Figure 5A,C; Video S1A). In contrast, Bsep KO mice showed reduced LPS uptake by KCs, whereas almost no basolateral LPS uptake by hepatocytes, and therefore no enrichment in bile canaliculi, was observed; consequently, injected LPS persisted longer in the sinusoids (Figure 5B,D; Video S1B). These results confirmed impaired hepatic clearance of LPS in Bsep KO mice, due to reduced phagocytic capacity of resident KCs and absence of biliary LPS excretion.
FIGURE 5.

Reduced hepatic clearance of LPS in Bsep KO mice. (A) Stills of liver from a WT mouse before and at different time intervals after i.v. bolus injection of Alexa Fluor 488–coupled LPS. Within seconds after the tail vein injection, the green fluorescent LPS appears in the sinusoids, is then rapidly taken up by KCs, and slowly enriches in bile canaliculi. (B) In Bsep KO mice, the uptake of LPS by KCs is strongly reduced, and the secretion to bile canaliculi is almost completely blocked; consequently, the green fluorescent LPS persists longer in the sinusoids. Red, F4/80; green, Alexa Fluor 488–coupled LPS; blue, autofluorescence. Pictures are representative of n = 3 mice. Images correspond to Video S1A,B. Corresponding quantification of the mean LPS intensity in sinusoids, KCs, and bile canaliculi of WT (C) and Bsep KO (D) mice
Intravital imaging of fluorescently labeled LPS shows blocked hepatic clearance of LPS in obstructive cholestasis and in the Mdr2 KO mouse model of sclerosing cholangitis
To explore whether the impaired hepatic clearance of LPS is a general feature of cholestasis and independent of the composition of accumulated BAs, a mouse model of severe cholestasis induced by biliary obstruction (BDL) and sclerosing cholangitis (Mdr2 KO) was investigated. For this purpose, WT mice were subjected to BDL and 9 days later injected with Alexa Fluor 488–coupled LPS (i.v.) (Figure 6; Video S2A,B). In sham‐operated mice, the green fluorescent LPS was rapidly taken up by KCs, followed by secretion into bile canaliculi, where transiently increased LPS‐fluorophore was detected (Figure 6A,D; Video S2A). In contrast, the uptake of LPS by KCs was almost completely blocked after BDL (Figure 6B,E; Video S2B). Consistently, LPS was taken up by hepatocytes and secreted into the canaliculi of challenged sham‐operated, but not BDL, mice, pointing toward almost complete absence of functional biliary excretion of LPS in obstructive cholestasis. Consequently, the green fluorescent LPS showed prolonged presence in the blood sinusoids of BDL mice. These results show an impaired hepatic LPS removal in cholestasis, which was more pronounced in the BDL than in the Bsep KO mice. Additionally, intravital imaging of LPS clearance in the Mdr2 KO mouse model showed compromised uptake of LPS by KCs and almost complete block of excretion into bile canaliculi compared to the corresponding WT mice (Figure 6C,F; Video S3B).
FIGURE 6.

Impaired hepatic clearance of LPS in obstructive cholestasis and Mdr2 KO mice. (A,B) Mice on day 9 after BDL or sham operation received i.v. bolus injections of Alexa Fluor 488–coupled LPS. In the sham‐operated mouse, the green fluorescent LPS is rapidly taken up by KCs, followed by enrichment in bile canaliculi. In contrast, the uptake of LPS by KCs and the secretion to bile canaliculi are almost completely blocked after BDL. Consequently, the green fluorescent LPS shows prolonged presence in the blood sinusoids. (C) In Mdr2 KO mice uptake of LPS by KCs is compromised and excretion by hepatocytes into bile canaliculi almost completely blocked. Red, F4/80; green, Alexa Fluor 488–coupled LPS; blue, autofluorescence. Images correspond to Videos S2A,B and S3B. Pictures are representative of n = 3 mice. Corresponding quantification of the mean LPS intensity in sinusoids, KCs, and bile canaliculi of sham‐operated (D), BDL (E), and Mdr2 KO (F) mice
Biliary excretion of LPS is microtubule‐dependent and inhibited by colchicine pretreatment in WT mice
In order to explore the mechanism of LPS clearance through excretion into bile, the role of microtubules in LPS cellular transport was assessed experimentally. Tubulin immunostaining showed microtubules in both hepatocytes and KCs in the liver of WT mice (Figure 7A). Intravital imaging in WT mice starting 6 h after administration of the microtubule inhibitor colchicine (300 mg/kg) disrupted the normal microtubular staining pattern and blocked canalicular excretion of LPS. In addition, the uptake of LPS by KCs was weaker compared to the corresponding controls (Figure 7B,C,D; Video S4A,B).
FIGURE 7.

Microtubule inhibitor colchicine inhibits microtubule‐dependent biliary excretion of LPS in WT mice. (A) Immunostaining of microtubules using tubulin antibody shows the microtubules in hepatocytes and KCs of WT mice. Colchicine (300 mg/kg, i.p.) blocked the microtubules in hepatocytes within 6 h and altered the morphology of KCs to circular instead of the elongated shape, with fewer microtubules. Red, tubulin; green, F4/80 LPS; blue, DAPI. (B) Intravital imaging in Alexa Fluor 488–coupled LPS‐treated WT mice starting 6 h after colchicine (300 mg/kg, i.p.) administration. Treatment with colchicine prior to i.v. bolus injections of LPS blocked canalicular excretion of LPS almost completely; in addition, uptake of LPS by KCs was slower and weaker compared to the corresponding controls. Red, F4/80; green, Alexa Fluor 488–coupled LPS; blue, autofluorescence. Images correspond to Video S4A,B. Pictures are representative of n = 3 mice. Corresponding quantification of the mean LPS intensity in sinusoids, KCs, and bile canaliculi of WT controls (C) or WT mice treated with colchicine (D)
Gut microbiota reacts rapidly to systemic LPS challenge in WT, but not in Bsep KO, mice
Because the gut is an important source of LPS, we investigated the impact of Bsep KO on gut microbiota, using 16S amplicon sequencing. Gut microbiota composition did not differ between WT and Bsep KO mice at baseline (Figure 8A), excluding the presence of dysbiosis in Bsep KO mice. Moreover, no intestinal inflammation was detectable in Bsep KO, as indicated by analysis of intestinal proinflammatory cytokine expression and histology (Figure 8B). Surprisingly, we observed a rapid and strong shift in microbiota composition in WT mice 6 h after i.p. LPS treatment (Figure 8A), reflected by paired generalized UniFrac distance between the control and LPS treatment groups (Figure 8C). These changes included an increase in the relative abundance of several bacterial families, such as Desulfovibrionaceae, Oscillospiraceae, Lachnospiraceae, and Ruminococcaceae, as well as a decrease in the relative abundance of the Lactobacillaceae family (Figure S4A). However, these changes were not detected in the microbiome of LPS‐challenged Bsep KO mice. There was no significant difference in Shannon diversity between groups and time points (Figure S4B). To obtain a more comprehensive picture of gut microbiota changes, individual DNA sequences (amplicon sequencing variants [ASVs]) were analyzed (Figure S5). Compared to untreated WT mice, LPS‐treated WT mice had 43 differential abundant ASVs, belonging primarily to the aforementioned bacterial families. This analysis additionally revealed a decrease of ASVs from the Alistipes species, the Muribaculaceae family, and the Clostridia class. There also was an increase of ASVs belonging to the Eubacterium xylanophilum group, as well as Butyricicoccus, Oscillibacter, Bilophila, and Colidextribacter species. In Bsep KO mice there was a decrease of four ASVs, belonging to the Lachnospiraceae family and Lactobacillus species, upon LPS treatment. Untreated Bsep KO mice had only one Lachnospiraceae ASV, which was significantly reduced compared to WT.
FIGURE 8.

Gut microbiota reacts rapidly to systemic LPS challenge in WT, but not in Bsep KO, mice. (A) Multidimensional scaling plot of generalized UniFrac distances (permutational multivariate analysis of variance p = 0.002). (C) Paired generalized UniFrac distance between control and treatment groups in WT (open bars) and Bsep KO mice (closed bars). Data represent mean ± SD of n = 5–8 per experimental group. *Significantly higher paired generalized UniFrac distances between WT and LPS‐treated WT mice than between Bsep KO and LPS‐treated Bsep KO mice; p < 0.05 after correction for multiple testing. (B) No signs of impaired gut barrier or intestinal inflammation were observed in Bsep KO compared to WT mice at baseline and after LPS challenge, based on expression of proinflammatory cytokines Mcp1, Tnfα, and Il6 and H&E staining. Representative images given (×20 magnification; scale bars, 100 µm). Data represent mean ± SD of n = 5–7 per experimental group. *Significant difference compared to untreated WT controls; #significant difference compared to untreated Bsep KO controls; p < 0.05
DISCUSSION
Absence of Bsep results in severe cholestasis and subsequent liver injury in humans.[ 2 , 3 ] In contrast, mice lacking Bsep develop low cholestatic injury and are even protected against acquired cholestasis, which may at least in part be explained by adaptive up‐regulation of hepatic BA hydroxylation and formation of less toxic polyhydroxylated BAs.[ 7 ] In cholestasis, the combination of absence of intraluminal BAs, alterations in intestinal microflora, and impaired gut mucosal integrity promotes the increase of endotoxin (LPS) concentration in the portal circulation.[ 29 , 30 , 31 ] Moreover, obstructive cholestasis impairs clearance of LPS and may contribute to the vicious cycle of aggravation of cholestatic injury by LPS‐induced inflammatory pathways repressing expression and function of hepatobiliary transport systems.[ 19 , 20 , 32 , 33 ] Our data reveal that Bsep KO mice develop a higher degree of hepatic inflammation after LPS challenge, characterized by stronger induction of proinflammatory signaling pathways, as well as higher expression of proinflammatory cytokines, chemokines, and adhesion molecules.
The current study uncovers that enhanced susceptibility to LPS‐induced inflammation in Bsep KO mice may be explained by hepatic LPS retention upon injection, due to impaired phagocytosis by KCs and lack of biliary excretion. In order to determine whether the impaired hepatic removal of LPS is a general feature in cholestasis, the BDL mouse model was used as another animal model of severe, mechanical cholestasis, as well as the Mdr2 KO mouse model of sclerosing cholangitis. In line with the findings in Bsep KO mice, intravital imaging of LPS in mice with obstructive cholestasis and Mdr2 KO showed severely impaired uptake of LPS by KCs and almost complete absence of biliary LPS excretion. Altered phagocytic function of KCs after BDL has been demonstrated in rodent models,[ 19 , 34 , 35 ] and BDL rats have been shown to be more susceptible to LPS‐induced hepatic injury.[ 36 ] Importantly, our intravital imaging now clearly demonstrated impaired LPS clearance by hepatocytes in cholestasis. Biliary excretion of LPS by hepatocytes is microtubule‐dependent.[ 37 ] Indeed, colchicine, an inhibitor of microtubules, impaired biliary excretion of fluorescein isothiocyanate–labeled LPS in rats, but gadolinium chloride (blocker of KCs) did not, indicating that these two processes may occur independently.[ 17 ] In line with this, our experiments using intravital imaging in mice showed impaired biliary excretion of LPS upon colchicine pretreatment. It is possible that high concentrations of accumulated BAs in cholestasis may also inhibit the function of microtubule‐based motor protein kinesin,[ 38 ] thus interfering with LPS clearance. Our results indicate that impaired hepatic LPS removal is a general feature of cholestasis as it occurs in BDL, Mdr2 KO, and Bsep KO mice, although these mouse models show major differences in hepatic BA composition with a more hydrophilic BA pool in Bsep KO mice.[ 7 ]
Intestinal microbiota is an important source of LPS. Absence of intestinal BAs in cholestasis may result in disturbed intestinal bacterial homeostasis with overgrowth of gram‐negative bacteria.[ 12 , 31 ] However, our results did not reveal changes in gut microbiota composition in Bsep KO mice at baseline, despite profound changes in BA composition. Apparently, the enterohepatic circulation is at least partially maintained as reflected by unchanged mRNA expression of the hepatic uptake system Ntcp and induced hepatic mRNA expression of canalicular Mdr1a, as a potential alternative efflux route.[ 39 ] In line with this, intestinal inflammatory markers were not detected in Bsep KO mice. Surprisingly, 16S analysis showed a rapid shift in gut microbiota composition within 6 h after LPS treatment in WT, but not in Bsep KO, mice. At the same time point, LPS levels in gallbladder bile of LPS‐challenged WT mice were 5‐fold higher than those of challenged Bsep KO mice. This suggests that LPS excreted through the bile by healthy livers could contribute to the composition of gut microbiota, although this concept requires confirmation by further studies.
The acute LPS challenge induced nuclear translocation of NF‐κB and AP‐1 subunits with subsequent production of proinflammatory cytokines (TNFα, IL1β, IL6, and induced nitric oxide synthase [INOS]). This effect was stronger in LPS‐challenged Bsep KO compared to WT mice. Another striking finding was that the proinflammatory NF‐κB and AP‐1 pathways were up‐regulated in livers of Bsep KO mice already at baseline. In line with this, downstream targets such as MCP1, ICAM, and VCAM were increased at baseline in livers of Bsep KO mice and further induced upon LPS challenge. These changes may mediate neutrophil and macrophage infiltration, which was further aggravated upon LPS injection. Up‐regulation of hepatic CD14 is believed to enhance the sensitivity of KCs to LPS and has been described in cholestasis, as well as upon experimental LPS challenge.[ 40 ] Indeed, we detected elevated hepatic CD14 expression in Bsep KO mice at baseline, which was further enhanced by LPS challenge. In this way, accumulation of gut‐derived endogenous LPS may lead to up‐regulation of hepatic proinflammatory signaling and infiltration of immune cells in Bsep KO mice at baseline.
While compensatory BA detoxifying mechanisms protect Bsep KO mice from cholestasis,[ 7 ] these mechanisms appear to be inefficient against inflammation caused by LPS challenge. Impaired biliary LPS excretion in Bsep KO mice may play a crucial role in determining the degree of LPS‐induced inflammation, independently of hepatic BA composition. Exacerbated immune cell recruitment may promote liver injury by secreting proinflammatory cytokines and producing reactive oxygen species.[ 41 ]
In summary, this study underlines the importance of functional biliary excretion in successful hepatic detoxification of gut‐derived endotoxin. Our results support the suitability of the Bsep KO model for studying pathological changes in cholestasis, beyond BA‐mediated toxicity. Using two‐photon microscopy‐based intravital imaging, we were able to visualize impaired hepatic clearance of LPS in three mouse models of cholestasis: Bsep KO, Mdr2 KO, and BDL. Therefore, better understanding and therapeutic modulation of KC and hepatocyte dysfunction in cholestasis may be pivotal for restoring the impaired hepatic endotoxin clearance in patients. Additional studies are needed to determine the involvement of LPS retention in pathologies of other progressive liver conditions, such as liver cirrhosis.
CONFLICT OF INTEREST
Dr. Trauner consults for, is on the speakers’ bureau for, and received grants from Falk, Gilead, Intercept, and MSD. He consults for and received grants from Albireo. He consults for BioMx, Boehringer Ingelheim, Genfit, Janssen, Novartis, Shire, Phenex, and Regulus. He received research grants from Alnylam, CymaBay, Takeda, and UltraGenyx and travel support from Abbvie, Falk. Gilead and Intercept.
AUTHOR CONTRIBUTIONS
Jelena Remetic was responsible for study design, acquisition, analysis, and interpretation of data, and manuscript writing. Ahmed Ghallab was responsible for acquisition, analysis, and interpretation of data and manuscript writing. Richard Radun, Claudia D. Fuchs, Maximilian Baumgartner, Veronika Mlitz, Zaynab Hobloss, Lisa Brackhagen, Reham Hassan, Maiju Myllys, Ci Zhu, Waltraud C. Schrottmaier, Marion Mussbacher, Gerald Timelthaler, Hubert Scharnagl, Tatjana Stojakovic, and Alice Assinger were responsible for acquisition, analysis, and interpretation of data. Jan G. Hengstler was responsible for acquisition, analysis, and interpretation of data; manuscript writing; and obtaining funding. Michael Trauner was responsible for study concept, analysis and interpretation of data, manuscript writing, and obtaining funding. All authors critically revised and approved the final version of the manuscript.
Supporting information
Supplementary Material
Video S1A
Video S1B
Video S2A
Video S2B
Video S3A
Video S3B
Video S4A
Video S4B
Acknowledgment
We thank Victoria Kunczer for excellent technical support. The graphical abstract has been created with BioRender.com.
Remetic J, Ghallab A, Hobloss Z, Brackhagen L, Hassan R, Myllys M, et al. Loss of bile salt export pump aggravates lipopolysaccharide‐induced liver injury in mice due to impaired hepatic endotoxin clearance. Hepatology. 2022;75:1095–1109. 10.1002/hep.32289
Funding information
Supported by the Austrian Science Foundation through projects I2755 and the doctoral program “Inflammation and Immunity” (DK‐IAI W1212; to M.T.) and by the Federal Ministry of Education and Research (Germany) Liver‐LiSyM grant FKZ 031L0052 (to A.G.), and FKZ 031L0045 (to J.G.H)
Contributor Information
Jan G. Hengstler, Email: hengstler@ifado.de.
Michael Trauner, Email: michael.trauner@meduniwien.ac.at.
REFERENCES
- 1. Stieger B, Meier Y, Meier PJ. The bile salt export pump. Pflugers Arch. 2007;453:611–20. [DOI] [PubMed] [Google Scholar]
- 2. Stieger B. Role of the bile salt export pump, BSEP, in acquired forms of cholestasis. Drug Metab Rev. 2010;42:437–45. [DOI] [PubMed] [Google Scholar]
- 3. Strautnieks SS, Byrne JA, Pawlikowska L, Cebecauerová D, Rayner A, Dutton L, et al. Severe bile salt export pump deficiency: 82 different ABCB11 mutations in 109 families. Gastroenterology. 2008;134:1203–14. [DOI] [PubMed] [Google Scholar]
- 4. Wang R, Salem M, Yousef IM, Tuchweber B, Lam P, Childs SJ, et al. Targeted inactivation of sister of P‐glycoprotein gene (spgp) in mice results in nonprogressive but persistent intrahepatic cholestasis. Proc Natl Acad Sci U S A. 2001;98:2011–6. [DOI] [PMC free article] [PubMed] [Google Scholar]
- 5. Wang R, Sheps JA, Liu L, Han J, Chen PSK, Lamontagne J, et al. Hydrophilic bile acids prevent liver damage caused by lack of biliary phospholipid in Mdr2–/– mice. J Lipid Res. 2019;60:85–97. [DOI] [PMC free article] [PubMed] [Google Scholar]
- 6. Hrycay E, Forrest D, Liu L, Wang R, Tai J, Deo A, et al. Hepatic bile acid metabolism and expression of cytochrome P450 and related enzymes are altered in Bsep–/– mice. Mol Cell Biochem. 2014;389:119–32. [DOI] [PubMed] [Google Scholar]
- 7. Fuchs CD, Paumgartner G, Wahlström A, Schwabl P, Reiberger T, Leditznig N, et al. Metabolic preconditioning protects BSEP/ABCB11–/– mice against cholestatic liver injury. J Hepatol. 2017;66:95–101. [DOI] [PubMed] [Google Scholar]
- 8. Wang R, Chen HL, Liu L, Sheps JA, Phillips MJ, Ling V. Compensatory role of P‐glycoproteins in knockout mice lacking the bile salt export pump. Hepatology. 2009;50:948–56. [DOI] [PubMed] [Google Scholar]
- 9. Trauner M, Meier PJ, Boyer JL. Molecular pathogenesis of cholestasis. N Engl J Med. 1998;339:1217–27. [DOI] [PubMed] [Google Scholar]
- 10. Wagner M, Zollner G, Trauner M. New molecular insights into the mechanisms of cholestasis. J Hepatol. 2009;51:565–80. [DOI] [PubMed] [Google Scholar]
- 11. Reynolds JV, Murchan P, Leonard N, Clarke P, Keane FB, Tanner WA. Gut barrier failure in experimental obstructive jaundice. J Surg Res. 1996;62:11–6. [DOI] [PubMed] [Google Scholar]
- 12. Cabrera‐Rubio R, Patterson AM, Cotter PD, Beraza N. Cholestasis induced by bile duct ligation promotes changes in the intestinal microbiome in mice. Sci Rep. 2019;9:12324. [DOI] [PMC free article] [PubMed] [Google Scholar]
- 13. Dhillon AK, Kummen M, Trøseid M, Åkra S, Liaskou E, Moum B, et al. Circulating markers of gut barrier function associated with disease severity in primary sclerosing cholangitis. Liver Int. 2019;39:371–81. [DOI] [PubMed] [Google Scholar]
- 14. Pavlidis ET, Pavlidis TE. Pathophysiological consequences of obstructive jaundice and perioperative management. Hepatobiliary Pancreat Dis Int. 2018;17:17–21. [DOI] [PubMed] [Google Scholar]
- 15. Schwabe RF, Seki E, Brenner DA. Toll‐like receptor signaling in the liver. Gastroenterology. 2006;130:1886–900. [DOI] [PubMed] [Google Scholar]
- 16. Van Bossuyt H, De Zanger RB, Wisse E. Cellular and subcellular distribution of injected lipopolysaccharide in rat liver and its inactivation by bile salts. J Hepatol. 1988;7:325–37. [DOI] [PubMed] [Google Scholar]
- 17. Mimura Y, Sakisaka S, Harada M, Sata M, Tanikawa K. Role of hepatocytes in direct clearance of lipopolysaccharide in rats. Gastroenterology. 1995;109:1969–76. [DOI] [PubMed] [Google Scholar]
- 18. Maitra SK, Rachmilewitz D, Eberle D, Kaplowitz N. The hepatocellular uptake and biliary excretion of endotoxin in the rat. Hepatology. 1981;1:401–7. [DOI] [PubMed] [Google Scholar]
- 19. Clements WD, Halliday MI, McCaigue MD, Barclay RG, Rowlands BJ. Effects of extrahepatic obstructive jaundice on Kupffer cell clearance capacity. Arch Surg. 1993;128:200–4; discussion 204–5. [DOI] [PubMed] [Google Scholar]
- 20. Pain JA. Reticulo‐endothelial function in obstructive jaundice. Br J Surg. 1987;74:1091–4. [DOI] [PubMed] [Google Scholar]
- 21. Shibayama Y. Endotoxaemia and hepatic injury in obstructive jaundice. J Pathol. 1989;159:335–9. [DOI] [PubMed] [Google Scholar]
- 22. Fuchs CD, Paumgartner G, Mlitz V, Kunczer V, Halilbasic E, Leditznig N, et al. Colesevelam attenuates cholestatic liver and bile duct injury in Mdr2–/– mice by modulating composition, signalling and excretion of faecal bile acids. Gut. 2018;67:1683–91. [DOI] [PMC free article] [PubMed] [Google Scholar]
- 23. Ghallab A, Hofmann U, Sezgin S, Vartak N, Hassan R, Zaza A, et al. Bile microinfarcts in cholestasis are initiated by rupture of the apical hepatocyte membrane and cause shunting of bile to sinusoidal blood. Hepatology. 2019;69:666–83. [DOI] [PMC free article] [PubMed] [Google Scholar]
- 24. Fuchs CD, Krivanec S, Steinacher D, Mlitz V, Wahlström A, Stahlman M, et al. Absence of Bsep/Abcb11 attenuates MCD diet‐induced hepatic steatosis but aggravates inflammation in mice. Liver Int. 2020;40:1366–77. [DOI] [PMC free article] [PubMed] [Google Scholar]
- 25. Petruk G, Puthia M, Petrlova J, Samsudin F, Strömdahl A‐C, Cerps S, et al. SARS‐CoV‐2 spike protein binds to bacterial lipopolysaccharide and boosts proinflammatory activity. J Mol Cell Biol. 2021;12:916–32. [DOI] [PMC free article] [PubMed] [Google Scholar]
- 26. Reif R, Ghallab A, Beattie L, Günther G, Kuepfer L, Kaye PM, et al. In vivo imaging of systemic transport and elimination of xenobiotics and endogenous molecules in mice. Arch Toxicol. 2017;91:1335–52. [DOI] [PMC free article] [PubMed] [Google Scholar]
- 27. Geier A, Dietrich CG, Voigt S, Ananthanarayanan M, Lammert F, Schmitz A, et al. Cytokine‐dependent regulation of hepatic organic anion transporter gene transactivators in mouse liver. Am J Physiol Gastrointest Liver Physiol. 2005;289:G831–41. [DOI] [PubMed] [Google Scholar]
- 28. Trauner M, Arrese M, Soroka CJ, Ananthanarayanan M, Koeppel TA, Schlosser SF, et al. The rat canalicular conjugate export pump (Mrp2) is down‐regulated in intrahepatic and obstructive cholestasis. Gastroenterology. 1997;113:255–64. [DOI] [PubMed] [Google Scholar]
- 29. Bailey ME. Endotoxin, bile salts and renal function in obstructive jaundice. Br J Surg. 1976;63:774–8. [DOI] [PubMed] [Google Scholar]
- 30. Deitch EA, Sittig K, Li M, Berg R, Specian RD. Obstructive jaundice promotes bacterial translocation from the gut. Am J Surg. 1990;159:79–84. [DOI] [PubMed] [Google Scholar]
- 31. Assimakopoulos SF, Scopa CD, Vagianos CE. Pathophysiology of increased intestinal permeability in obstructive jaundice. World J Gastroenterol. 2007;13:6458–64. [DOI] [PMC free article] [PubMed] [Google Scholar]
- 32. Trauner M, Arrese M, Lee H, Boyer JL, Karpen SJ. Endotoxin downregulates rat hepatic ntcp gene expression via decreased activity of critical transcription factors. J Clin Invest. 1998;101:2092–100. [DOI] [PMC free article] [PubMed] [Google Scholar]
- 33. Trauner M, Fickert P, Stauber RE. Inflammation‐induced cholestasis. J Gastroenterol Hepatol. 1999;14:946–59. [DOI] [PubMed] [Google Scholar]
- 34. Scott‐Conner CE, Grogan JB. The pathophysiology of biliary obstruction and its effect on phagocytic and immune function. J Surg Res. 1994;57:316–36. [DOI] [PubMed] [Google Scholar]
- 35. Kennedy JA, Clements WDB, Kirk SJ, McCaigue MD, Campbell GR, Erwin PJ, et al. Characterization of the Kupffer cell response to exogenous endotoxin in a rodent model of obstructive jaundice. Br J Surg. 1999;86:628–33. [DOI] [PubMed] [Google Scholar]
- 36. Nakano H, Fujiwara Y, Kitamura N, Kumada K, Matsumiya A, Sakai H, et al. Susceptibility to lipopolysaccharide of cholestatic rat liver produced with bile duct ligation: assessments of the mitochondrial glutathione pool and the effects of N‐acetylcysteine. Eur Surg Res. 2000;32:148–54. [DOI] [PubMed] [Google Scholar]
- 37. Hori Y, Ohyanagi H. Biliary excretion of lipopolysaccharide is microtubule‐dependent in isolated perfused rat liver. J Gastroenterol. 1994;29:800–1. [DOI] [PubMed] [Google Scholar]
- 38. Marks DL, LaRusso NF, McNiven MA. Isolation of the microtubule‐vesicle motor kinesin from rat liver: selective inhibition by cholestatic bile acids. Gastroenterology. 1995;108:824–33. [DOI] [PubMed] [Google Scholar]
- 39. Lam P, Wang R, Ling V. Bile acid transport in sister of P‐glycoprotein (ABCB11) knockout mice. Biochemistry. 2005;44:12598–605. [DOI] [PubMed] [Google Scholar]
- 40. Chou MH, Chuang JH, Eng HL, Tsai PC, Hsieh CS, Liu HC, et al. Effects of hepatocyte CD14 upregulation during cholestasis on endotoxin sensitivity. PLoS One. 2012;7:e34903. [DOI] [PMC free article] [PubMed] [Google Scholar]
- 41. Ju C, Tacke F. Hepatic macrophages in homeostasis and liver diseases: from pathogenesis to novel therapeutic strategies. Cell Mol Immunol. 2016;13:316–27. [DOI] [PMC free article] [PubMed] [Google Scholar]
Associated Data
This section collects any data citations, data availability statements, or supplementary materials included in this article.
Supplementary Materials
Supplementary Material
Video S1A
Video S1B
Video S2A
Video S2B
Video S3A
Video S3B
Video S4A
Video S4B