

Abstract
The atmospheric concentration of nitrous oxide (N2O) has increased by 23% since the pre‐industrial era, which substantially destructed the stratospheric ozone layer and changed the global climate. However, it remains uncertain about the reasons behind the increase and the spatiotemporal patterns of soil N2O emissions, a primary biogenic source. Here, we used an integrative land ecosystem model, Dynamic Land Ecosystem Model (DLEM), to quantify direct (i.e., emitted from local soil) and indirect (i.e., emissions related to local practices but occurring elsewhere) N2O emissions in the contiguous United States during 1900–2019. Newly developed geospatial data of land‐use history and crop‐specific agricultural management practices were used to force DLEM at a spatial resolution of 5 arc‐min by 5 arc‐min. The model simulation indicates that the U.S. soil N2O emissions totaled 0.97 ± 0.06 Tg N year−1 during the 2010s, with 94% and 6% from direct and indirect emissions, respectively. Hot spots of soil N2O emission are found in the US Corn Belt and Rice Belt. We find a threefold increase in total soil N2O emission in the United States since 1900, 74% of which is from agricultural soil emissions, increasing by 12 times from 0.04 Tg N year−1 in the 1900s to 0.51 Tg N year−1 in the 2010s. More than 90% of soil N2O emission increase in agricultural soils is attributed to human land‐use change and agricultural management practices, while increases in N deposition and climate warming are the dominant drivers for N2O emission increase from natural soils. Across the cropped acres, corn production stands out with a large amount of fertilizer consumption and high‐emission factors, responsible for nearly two‐thirds of direct agricultural soil N2O emission increase since 1900. Our study suggests a large N2O mitigation potential in cropland and the importance of exploring crop‐specific mitigation strategies and prioritizing management alternatives for targeted crop types.
Keywords: crop‐specific N2O emissions; factorial contributions, the contiguous U.S; soil N2O emissions; spatial patterns; temporal dynamics
We used a process‐based land ecosystem model and newly developed environmental input data to quantify the U.S. soil nitrous oxide (N2O) emissions during 1900–2019. This study estimated a national total soil N2O emissions of 0.97 ± 0.06 Tg N year−1 during the 2010s, with 94% and 6% from direct and indirect emissions, respectively. We found a threefold increase in total soil N2O emission since 1900, 73% of which is from agricultural soils. Corn production accounted for nearly two‐thirds of direct agricultural soil N2O emission increase over this period, implying a potential of developing crop‐specific N2O mitigation strategies.

1. INTRODUCTION
Anthropogenic activities such as land‐use change and agricultural management practices have substantially enhanced biogenic emissions of nitrous oxide (N2O), a potent greenhouse gas and a major contributor to stratospheric ozone depletion (Ravishankara et al., 2009; Tian et al., 2020). Global atmospheric N2O concentration has increased by more than 23% since the pre‐industrial era, from 270.1 parts per billion (ppb) in 1750 to 333 ppb in 2020 (Canadell et al., 2021). The annual increase in global N2O concentration averaged at a rate of 1.0 ppb per year in the past decade, with the largest increase of 1.4 ppb per year found in 2020, even with reduced human activities due to the coronavirus pandemic (NOAA/GML—gml.noaa.gov/ccgg/trends_n2o). More importantly, it is projected to continue to rise as global nitrogen (N) fertilizer use increases (Cavigelli et al., 2012; Thompson et al., 2019). Increasing food production is the dominant driver of growing N2O concentration in the atmosphere (Syakila & Kroeze, 2011; Tian et al., 2020), primarily due to widespread increases in N fertilizer uses and cultivation of N2‐fixing crops (Nevison et al., 2018). The U.S. agricultural sector, annually consuming ~11% of global total N fertilizer in recent years (Lu & Tian, 2017), ranked as one of the hotspots of N2O emissions in the world. Additionally, biological N fixation from soybean, a crop not widely grown in the United States until the 20th century (David et al., 2001), has also surged since the last three decades (Griffis et al., 2017), which contributed to soil N accumulation and subsequent N2O emissions. As a result, agricultural soils accounted for 77% of national total N2O emissions in 2016, and their share increased by 13% from 1990 to 2016 with large inter‐annual variations (EPA, 2018).
The estimation of U.S. N2O emissions has been reported by a wide variety of studies using process‐based modeling approaches, which are notably advantageous in attributing the spatiotemporal variations in terrestrial N2O emissions to different driving forces (Xu et al., 2012). Nonetheless, large variations exist in these estimations due to the various ways in which biogeochemical processes are represented in different models and the uncertainty of the input data (Li et al., 1996; Tian et al., 2019; Xu et al., 2012). The 95% confidence interval of the US agricultural soil N2O emissions was reported to range from about –35% to +50% of “the best estimate” (i.e., the mean value) for major crops, while the ranges were larger for non‐major crops and grasslands (Cavigelli et al., 2012; Del Grosso et al., 2010). As a result, we have little capacity to validate the impacts of management interventions on N2O emissions, and management guidelines for reducing N2O emissions remain tentative at best. In addition, bottom‐up predictions of regional N2O emissions based on known nitrogen inputs to croplands are often substantially lower than top‐down atmospheric measurements (Griffis et al., 2017), which limits its climate feedback in current mechanistic Earth system models (Gaillard et al., 2018).
To reduce the estimation uncertainty, the N2O Model Intercomparison Project (NMIP) was launched for developing a multi‐model ensemble estimation on the global/regional N2O budgets using consistent driver data sets (Tian et al., 2018). However, because the estimates were designed for global assessment, the majority of these simulations were performed in coarse resolution (e.g., 0.5° by 0.5° in NMIP) and simplified in representing agricultural management practices (e.g., without consideration of tillage). Regarding modeling schemes, many existing models simplify or even lack representation of various agricultural management practices (e.g., crop rotation, crop‐specific fertilizer use rate, type, and timing, historical tillage intensity, tile drainage), while these practices are essential in determining N2O emissions (Grossel et al., 2016; Petersen et al., 2011). Thus, the accuracy of estimations or attributions of N2O flux dynamics has to be sacrificed to some extent in global assessments. Moreover, input driving data developed for global simulations may not be suitable for regional assessment. Our previous studies revealed that the global land use data, such as History Database of the Global Environment (HYDE) cropland data and Land‐use Harmonization (LUH2), serving as the major input driver of previously published N2O estimations at both global and regional scales, is largely biased in characterizing both the spatial distribution and temporal dynamics of cropland acres across the United States (Yu & Lu, 2018; Yu et al., 2019). HYDE cropland, which originated from the FAO national statistics and was designed for global assessment, depicts the historical changes in arable land and permanent crops (Hurtt et al., 2011). Such representation overestimated U.S. cropped lands by 30%–44% (Yu & Lu, 2018), which inevitably diluted N fertilizer use rate per unit cropland area when we use them to spatialize the country‐level N fertilizer consumption amount into pixel level for driving spatial model simulations. Consequently, large underestimation may exist in previous assessments relying on HYDE and LUH2 cropland data set as the driver data since N2O emission exponentially rises with increasing N inputs (Shcherbak et al., 2014). More importantly, our previous study also found that the U.S. cropland area reduction in the last two decades shown by HYDE data was inconsistent with the U.S.‐specific land cover history databases (e.g., USDA Crop Production Historical Report‐CPHR and USDA Census of Agriculture Historical Archive‐CAHA). Aside from the potential bias from input data and simplified representation of agricultural managements in models, most of the previous modeling studies focus on the recent few decades, but the historical trend in soil N2O emissions has been rarely examined. This leaves a knowledge gap because the contemporary N2O fluxes in terrestrial ecosystems are influenced by legacy effects of the land‐use and agricultural management history (Abraha et al., 2018; Meurer et al., 2016; Van Lent et al., 2015). Thus, there is an urgent need to improve the driving data and agricultural management modules for a comprehensive assessment and a full attribution of soil N2O fluxes in the United States.
In this study, we quantified historical direct and indirect N2O emissions from agricultural and natural soils using updated, long‐term land use and historical management data (e.g., crop‐specific N fertilizer uses, manure application, tillage practices, etc.). We aim (1) to estimate the soil N2O emissions in the contiguous United States driven by changes in climate conditions, atmospheric composition, and historical land use and agricultural management practices spanning from 1900 to 2019, (2) to quantify the factorial contributions to spatiotemporal variations in soil N2O emissions across the country, and (3) to examine the changes in crop‐specific N2O emissions and emission factors (EFs) across the United States.
2. METHODS
In this study, we used a well‐established, process‐based land ecosystem model, Dynamic Land Ecosystem Model (DLEM; Tian, Chen, et al., 2010; Tian, Xu, et al., 2010), to quantify N2O fluxes in the contiguous United States. The DLEM is driven by spatially explicit time‐series data sets including daily climate conditions (e.g., average, minimum and maximum temperature, precipitation, shortwave radiation, and relative humidity), annual land use and cover change (LUCC), monthly concentration of atmospheric CO2, N deposition, and agricultural management practices (e.g., N fertilizer use, irrigation, manure N application, tillage, and tile drainage). The basic model simulation is conducted on plant functional types that co‐exist in each 5‐arc min by 5‐arc min pixel at a daily time step. Here, all the model input data are developed at the same spatial resolution for driving the model.
2.1. Model input data
2.1.1. LUCC data sets
The LUCC data set in this study was developed by adopting methodologies from Liu et al. (2013), Liu and Tian (2010), Tian, Chen, et al. (2010), Yu and Lu (2018), and Yu et al. (2019). The annual LUCC maps characterize the area percentage of croplands, natural vegetation (e.g., grassland, forest, shrub, wetland), and non‐vegetated land (e.g., lakes, streams, oceans, glaciers, bare ground, impervious land). The cropland maps were reconstructed by harmonizing multi‐source databases including county‐based census data, reports, publications, and satellite images (Yu & Lu, 2018). Area dynamics of natural vegetation, such as forest and wetland were tracked using North American Forest Dynamics (NAFD), Land Use Harmonization (LUH) data and national wetland inventory (NWI) reports (https://www.fws.gov/wetlands/), where vegetation areas between reported years were linearly interpolated. The crop rotation maps (annual crop‐type maps) were reconstructed using satellite images (e.g., Cropland Layer Data, https://nassgeodata.gmu.edu/CropScape/) and the USDA National Agricultural Statistics Service (NASS) county‐level survey data. More details can be found in Lu et al. (2018), Yu and Lu (2018), and Yu et al. (2019).
2.1.2. Agricultural management data
The annual time‐series maps of chemical N fertilizer use (including N fertilizer use rate, N fertilizer types, and application timing) across the United States at 1‐km by 1‐km resolution were produced in our previous study (Cao et al., 2018). By integrating and gap‐filling the data of national total N fertilizer consumption, national crop‐specific N fertilizer use rates, and state‐level total N fertilizer consumption from multiple sources, we reconstructed annual state‐level crop‐specific N fertilizer use rate for 10 major crop types from 1900 to 2019. The 10 crops considered include corn, soybean, winter wheat, spring wheat, cotton, sorghum, rice, barley, durum wheat, and cropland pasture. We calculated the annual N fertilizer use amount for non‐farm (e.g., lawn, golf turf, and airport grassland) and permanent pasture in each state from 1900 to 2019 based on the records of N fertilizer sales (Brakebill & Gronberg, 2017) and national surveys of crop‐specific N fertilizer consumption (Heffer, 2013). All other crop types were grouped as “others.” The N fertilizer use amount of others was calculated as the difference between state‐level total N fertilizer amount and fertilizer used by major crops, no‐farm, and permanent pasture. Then, the average N fertilizer use rate was obtained by dividing the fertilizer use amount and the crop planting acreage. According to the state‐level crop‐specific survey data in the latest years (USDA‐ERS, 2019), we identified four application timings, namely fall (the previous year after harvesting), spring (before planting), at‐planting, and after‐planting. We used the application rate fraction of each timing to split the annual N fertilizer use rate into four timings. We tracked annual consumption amounts of 11 major single N fertilizer types at the state level since 1900. Based on the annual NH4 +‐N/NO3 −‐N ratio calculated from 11 N fertilizer types at four application timings in each state, we further obtained the N fertilizer use rate of NH4 +‐N and NO3 −‐N at four timings for all crops. Details of the development of N fertilizer data are described in Cao et al. (2018).
We modified the annual manure N application maps of the United States from 1900 to 2017 at 1‐km resolution produced by Bian et al. (2021). The manure N application was estimated by integrating county‐level livestock population, recoverability factors, cropland fraction, and cropland nutrient demand maps. The animal excretion, manure production, was first calculated based on livestock population, dynamic animal body weight, and N excretion rates. Then the recovered manure N, after accounting for the loss of collection, transportation, and application, was estimated by multiplying the manure production with the recoverability factors. By considering the fraction of cropland manure N demand, the recovered manure N was further split into manure N application. Details of the development of manure N application data are described in Bian et al. (2021). However, the manure N application data is largely biased from 2007 to 2017 in some counties due to the unavailable livestock population data. We reconstructed the manure N application based on the inter‐annual variations of recovered manure estimated by NuGIS (https://nugis.tfi.org/Methods/Manure) to replace the biased data during this period. Additionally, the incubation and field experiments concluded that manure N releases rapidly in the first month followed by a slow release phase (Agehara & Warncke, 2005; Cusick et al., 2006). We, therefore, added a soil temperature and moisture‐constrained single exponential model to mimic the manure N release process.
We further developed the annual tillage intensity maps by combining annual crop type and distribution maps and a nationwide commercial survey regarding corn‐soybean farming practices during 1998–2016 (Yu et al., 2020). Tile drainage maps in the United States were produced based on poorly drained soil maps from the State Soil Geographic (STATSGO) database, county‐level acres of subsurface tile drainage maps (Sugg, 2007), and cropland maps from National Land Cover Database (NLCD; Nakagaki et al., 2016).
2.1.3. Climate, CO2, and nitrogen deposition data
Daily climate data (temperature, precipitation, relative humidity, and shortwave radiation) were downloaded and resampled to 5 arc‐min × 5 arc‐min from high‐resolution, gridded meteorological data products TS 2.1 from station observations by the Climatic Research Unit (CRU) of the University of East Anglia TS 2.1 and North America Regional Reanalysis (NARR) data set from a combination of modeled and observed data. Atmospheric CO2 was retrieved from the data set developed by Wei et al. (2014). The annual time‐series N deposition maps were obtained from the National Atmospheric Deposition Program (https://nadp.slh.wisc.edu/maps‐data/ntn‐gradient‐maps/) that spans from 1985 to 2019 and were extended to the entire study period by using the North American N deposition trend (Wei et al., 2014). Specifically, the annual N deposition rate, including NH4 +‐N and NO3 −‐N, was used to feed the model and enter soil NH4 +‐N and NO3 −‐N pools, respectively.
2.2. N2O emission estimation
2.2.1. Model representation of N2O emission
N2O production in soils is predominantly triggered by biological nitrification and denitrification processes (Tian et al., 2012). In the DLEM, the N2O module has been designed to capture the two processes by considering N availability, soil properties, soil thermal condition, and soil moisture status:
| (1) |
where is the N2O produced from soil, is the daily nitrification rate (g N m−2 day−1), is the daily denitrification rate (g N m−2 day−1), is the scaled factor of soil temperature (, °C) on N2O emission process (unitless), and is the effects of water‐filled porosity (, unitless).
Nitrification is a process that converts ammonium () into nitrate (). In DLEM, the nitrification rate is simulated as a function of soil temperature, moisture, and available content in soil ():
| (2) |
where is the daily maximum fraction of that is converted into and nitrogen gases, is the soil temperature's effect on nitrification (unitless), and is the soil moisture effect. More details can be found in Yang et al. (2015).
Denitrification is the process that converts into nitric oxide (), , and dinitrogen (). In DLEM it is calculated as:
| (3) |
where is the potential rate of denitrification (g N m−2 day−1), is the percentage of clay content in soil (%), is the soil respiration rate (g C m−2 day−1), is a parameter depending on plant functional type to tune the potential denitrification rate (g N m−2 day−1), is the same soil temperature effect as that defined in the nitrification process (unitless), is the soil water effect (unitless), represents the effect of concentration (g N g−1 soil), is the content in the soil per unit area (g N m−2), and is the soil bulk density (g soil m−3).
In this model, we have incorporated impacts of tillage practices with various intensity levels of carbon, nitrogen and water cycling processes in the terrestrial ecosystems (Yu et al., 2020). Following the modeling representation of tillage‐related mechanisms described in Fox and Bandel (1986), Lemunyon and Gross (2003), Li et al. (1994), Linn and Doran (1984), and Gilley (2005), we assume that (1) conservation and conventional tillage boost decomposition rate by 1.5 and 3 times, respectively; (2) residue retention rates decrease from 80% under no‐till, to 30% under conservation tillage, and to 15% under conventional tillage; (3) conservation and conventional tillage increase soil evaporation by 1.207 and 1.448 times comparing with no‐till; (4) conservation and conventional tillage suppress denitrification by 15% and 30% due to the enhanced soil exposure to oxidization; and (5) conservation and conventional tillage enhance soil erosion and the impacts are determined by the residue type. The grid‐level total N2O emission is summarized by the area and rate of each crop type or natural vegetation type using the approach described in Xu et al. (2017).
2.2.2. N2O emission from non‐farm, permanent pasture, and cropland pasture
Due to the paucity of spatial distribution information, we adopted a quadratic model (Equation 4) to estimate state‐level N2O emission by non‐farm, permanent pasture, and cropland pasture. This quadratic model was produced based on 78 published studies with 233 site‐year samples, which well represents the exponential response of N2O emissions as N fertilizer increases (Shcherbak et al., 2014).
| (4) |
where Emis is N2O emissions in grams of N per hectare. N is N fertilizer use rate in kilograms per hectare.
2.2.3. Indirect N2O emissions
We also included the annual indirect emissions from soil and leaching and runoff (Equation 5). Annual indirect N2O losses from soil N leaching were calculated based on the global fraction of the net N leaching rate simulated by DLEM, as assumed by Seitzinger and Kroeze (1998). We calculated the indirect N2O emissions from rivers and estuaries based on the equations from Seitzinger and Kroeze (1998) and the EF refined by the Intergovernmental Panel on Climate Change (IPCC) (Hergoualc'h et al., 2019) to represent the indirect N2O emission from soil N leaching:
| (5) |
where and are respectively N2O emitted from rivers and estuaries (g N m−2); is the sum of and leaching from local grid cells (g N m−2); is the emission factor (0.011 with an uncertainty range from 0.000 to 0.020). The total indirect N2O emission was calculated by summing the emissions from both rivers and estuaries at local grid cells. The indirect N2O emissions through volatilization and re‐deposition and harvest of crop biomass are not reported in this study.
2.3. Model spin‐up and experiment design
2.3.1. Model initialization
To simulate N2O fluxes from different biomes, we first ran the model to achieve an equilibrium state using drivers set to 1900 level providing the baseline C, N, and water pools for each biome in each grid‐cell. The equilibrium state is defined as the interannual variations of net fluxes less than 1 g C m−2 year−1 for C, 1 g N m−2 year−1 for N, and 1 mm m−2 year−1 for water within a 20‐year simulation cycle (Yu et al., 2018). Then, a 100‐year spin run was performed using detrended climate data randomly picked between 1900 and 1930, while other input drivers were kept constant at the 1900 level, before switching to transient runs.
2.3.2. Model calibration and validation
We have rigorously calibrated and validated the DLEM model at both site and regional scales (Yu et al., 2018). The DLEM model's performance has been previously compared with observations in the United States using data obtained from the Long‐Term Ecological Research (LTER) Network, Long‐Term Agroecosystem Research (LTAR) Network, and measurements at flux towers (Liu et al., 2013; Lu and Tian, 2013; Tian, Xu, et al., 2010; Yu et al., 2018). Additional validation for gross primary productivity and soil organic carbon was conducted using published data collected in the contiguous United States. (Yu et al., 2019, 2020). Crop technology improvement (e.g., plant breeding) was represented and calibrated against national crop yield records for each crop type obtained from USDA NASS (see details in Lu et al., 2018). In this study, we particularly calibrated and validated the DLEM model with a focus on N2O emissions using observations obtained from multiple sites. In total, 116 site‐year were used for N2O validation covering major cropping systems (e.g., corn, soybean, barley, wheat, alfalfa) and natural vegetations (e.g., forest, grassland, wetland) (Figure 1). Moreover, we further validated the model performance in estimating the daily magnitude of and variations in soil N2O fluxes at a corn‐soybean rotation site located in central Iowa (42.05° N, 93.71° W) with 7‐year observation data provided by Parkin et al. (2016) and personal communication with T. B. Parkin (Figure 2).
FIGURE 1.
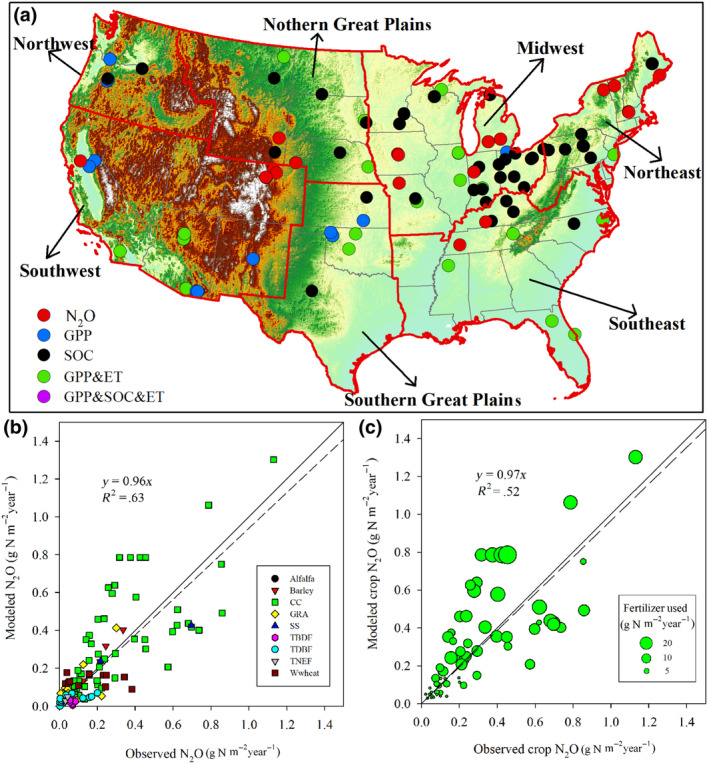
Map of model validation sites and sub‐regions of United States (a), and comparison between model‐estimated and observed annual N2O fluxes in major biomes (b) and major cropping systems (c) across the United States. Dash line is the regression of observed data and modeled results, and the solid line is the 1:1 line; CC: continuous corn; SS: soybean; Wwheat: winter wheat; GRA: grassland; TBDF: temperate deciduous broadleaf forest; TNEF: temperate evergreen needle‐leaf forest
FIGURE 2.

Model performance in reproducing the observed daily N2O emissions at a corn‐soybean rotation site in central Iowa (42.05˚ N, 93.71˚ W, Parkin et al., 2016 and personal communication with T. B. Parkin in April 6, 2017; the blue dash arrows indicate the applications of two nitrogen fertilizers in corn‐planting years)
2.3.3. Experimental design
We performed 10 simulation experiments to distinguish the factorial contributions of climate, CO2, land use and cover change (including crop rotation), N deposition, N fertilizer use, manure N application, and tillage practices on soil N2O flux over the U.S. terrestrial ecosystems from 1900 to 2019 (Table 1). More specifically, the first simulation experiment (S1) was designed to keep all drivers unchanged since the earliest available years (e.g., CO2 of 1900, climate data of 1900). The second simulation experiment (S2) was designed to represent the “best estimate” of N2O emission in the United States. It was driven by all historically varying input forcings that are critical to regulate N2O emissions during 1900–2019. Net changes in N2O emissions driven by all the input factors were estimated as the difference between S1 and S2 experiment. Other experiments (S3–S8) were set up with only one driver that did not vary over time in each simulation (Table 1). Factorial contributions from individual drivers were estimated by subtracting the simulated results obtained in the “All‐drivers‐without‐one” experiments (S3–S8) from the “best‐estimated” results (S2). There is an exception to quantify the impacts of LUCC for which we use the difference between experiments S9 and S10. Because land cover changes the could also change total input of agricultural management practices (e.g., fertilizer and manure applications, acres of tilled croplands), in these two experiments, we keep the management practice constant at the level of 1900 to distinguish the contributions of LUCC without the impacts of farming practices.
TABLE 1.
The design of simulation experiments in this study
| Experiments | Abbr. | Period of drivers used | ||||||
|---|---|---|---|---|---|---|---|---|
| CLIM a | CO2 | LUCC | Ndep | Nfer | Manure b | Tillage c | ||
| Baseline | S1 | 1900 | 1900 | 1900 | 1900 | 1900 | 1900 | 1998 |
| With all drivers | S2 | 1900–2019 | 1900–2019 | 1900–2019 | 1900–2019 | 1900–2019 | 1900–2019 | 1998–2016 |
| All drivers w/o climate | S3 | 1900 | 1900–2019 | 1900–2019 | 1900–2019 | 1900–2019 | 1900–2019 | 1998–2016 |
| All drivers w/o CO2 | S4 | 1900–2019 | 1900 | 1900–2019 | 1900–2019 | 1900–2019 | 1900–2019 | 1998–2016 |
| All drivers w/o Ndep | S5 | 1900–2019 | 1900–2019 | 1900–2019 | 1900 | 1900–2019 | 1900–2019 | 1998–2016 |
| All drivers w/o Nfer | S6 | 1900–2019 | 1900–2019 | 1900–2019 | 1900–2019 | 1900 | 1900–2019 | 1998–2016 |
| All drivers w/o manure | S7 | 1900–2019 | 1900–2019 | 1900–2019 | 1900–2019 | 1900–2019 | 1900 | 1998–2016 |
| All drivers w/o tillage | S8 | 1900–2019 | 1900–2019 | 1900–2019 | 1900–2019 | 1900–2019 | 1900–2019 | 1998 |
| CLIM + CO2 + Ndep | S9 | 1900–2019 | 1900–2019 | 1900 | 1900–2019 | 1900 | 1900 | 1998 |
| CLIM + CO2 + Ndep + LUCC | S10 | 1900–2019 | 1900–2019 | 1900–2019 | 1900–2019 | 1900 | 1900 | 1998 |
Abbreviation: LUCC, land use and cover change.
CLIM in model simulations includes daily mean, minimum and maximum temperature, precipitation, and shortwave solar radiation. Since the earliest climate is available in 1901, the climate data of 1900 represent a long‐term average condition during 1901–1930.
We assume the manure N application rate after 2017 were kept constant at the level of 2017 due to limited data.
In the simulation experiments with tillage practices, the spatial distributions of tillage practices in the US corn‐soybean cropping system before 1998 and after 2016 were assume to be constant at the level of 1998 and 2016, respectively.
2.4. Uncertainty analysis
Additional experiments were also set up to quantify the uncertainties of the N2O emission estimates caused by model parameters and crop distribution maps. Model parameter‐related uncertainties were primarily attributed to the LUCC and residue removal processes. The parameters used in LUCC‐induced soil C and N loss in the areas continuously encroached by cropland largely varied in studies (Yu et al., 2019). Besides, residue retention rates also greatly differed by location. We hereby adopted values of average LUCC‐induced C/N loss percentage ± 1 standard deviation and 40% and 60% residue retention rates for uncertainty simulations. For “best‐estimate” simulations, the average soil C and N loss values and a 50% residue retention rate were adopted. Moreover, we also accounted for uncertainty introduced by the crop type distributions, which was caused by the model we developed in reconstructing rotation maps before the remotely sensed crop‐type distribution data (e.g., CDL) are available. More details can be found in Yu et al. (2018) and Yu et al. (2019). The N2O emissions reported in this study were depicted by the spread of model estimates represented as the “best‐estimate” average ± 1 standard deviation derived from all experiments.
3. RESULTS
3.1. Changes in the key environmental drivers
Terrestrial ecosystems of the contiguous United States have experienced substantial environmental changes over the past century. Here, we present the spatial distribution of the key environmental changes since 1980 in the Supplementary Materials. During the period from 1980 to 2019, air temperature in the United States overall showed a significantly increasing trend, with a maximum annual increasing rate >0.04° C year−1 found in the northeast, the Norther Great Plains and the west, while it showed a decreasing trend in the western coast (Figure S1a in the Supplementary Materials). Since 1980, the increasing trend in precipitation was found in the entire Midwest (0–2.5 mm year−1), the northeast (>2.5 mm year−1), the southeast (>2.5 mm year−1), and the majority of Texas (0–2.5 mm year−1) (Figure S1b). In contrast, the western US showed a decreasing trend in precipitation over the past four decades (Figure S1b). Solar radiation also demonstrated a contrasting spatial pattern with an increasing trend found in the eastern and the southwestern parts of the United States and a decreasing trend in the northwestern United States (Figure S1c). Cropland distribution showed large spatial heterogeneity across the country. Specifically, higher cropland percentage mainly centered in the Midwestern United States, the central Great Plains, and the Lower Mississippi Alluvia Valley (Figure S1d). Over the past two decades, we find that the nationwide tillage intensity in the corn‐soybean cropping system has shifted from a declining trend to an increasing trend (Figure S2). The total cropland acreage percentage under no‐till and conservation tillage demonstrates a first‐increasing‐and‐then‐declining trend (Yu et al., 2020).
Enhanced N input is a dominant driver contributing to increases in soil N2O emissions. Our data show that synthetic N fertilizer uses, manure N application, and atmospheric N deposition in the contiguous United States increased from less than 0.01 Tg N year−1, 0.3 Tg N year−1, and 1.3 Tg N year−1 in 1900 to 10.3 Tg N year−1, 1.3 Tg N year−1, and 5.8 Tg N year−1 in 2019, respectively. Specifically, N fertilizer use increased rapidly since the 1960s, followed by a slower increase after the 1980s, while manure N application and N deposition have kept growing at a relatively low rate since 1900 (Figure 3). We divide the contiguous United States into seven regions and examine the changes in individual and combined N input sources (Figure 3). Regionally, the largest N fertilizer consumer region is the US Midwest, accounting for 44% of the national total fertilizer input in 2019, followed by the Northern Great Plains (23%) and the Southern Great Plains (12%). The remaining four regions together accounted for nearly 21%. By contrast, a large amount of manure N applied in the croplands were found in the Southeast (34%) and the Midwest (28%), with the remaining one‐third of manure N application in other areas of the United States. Regional shares of N deposition varied less than the other two N inputs, ranging from 3% of the national total in the Northwest to 25% in the Southeast. Due to the generally small manure N application across all seven regions (less than 15%), the Northeast, the Southeast, and the Southwest are the N deposition‐dominant regions (with N deposition contributing nearly 50% of total N input). In comparison, the N input in the remaining four regions is dominated by fertilizer application in the recent decade (Figure 3 and Figure S3 in the Supplementary Material). The Midwest and the Northern Great Plains, in particular, received more than 70% of N input from fertilizer use. It is noteworthy that according to the state‐wide survey by USDA‐Economic Research Service, the field‐level manure N application rate can be as high as N fertilizer use rate. However, the total manure N application amount is significantly smaller compared to N fertilizer use and N deposition due to the low adoption rate regionally and nationally.
FIGURE 3.

Spatial pattern of total N input across the United States in 2019 (center map) and time series of regional N input, including fertilizer uses, manure N application, and atmospheric N deposition from 1900 to 2019. N dep refers to atmospheric N deposited onto land surface, manure N and N fer refer to manure N and chemical N fertilizer application on croplands, respectively
3.2. National magnitude and dynamics of terrestrial N2O emissions
Soil N2O emission in the contiguous United States totaled 0.97 ± 0.06 Tg N year−1 during 2010–2019, among which 94% is from direct soil emissions, including 53% from cropland, followed by 17% from grassland, 9% from forests, 1% from other fertilizer use (including cropland pasture, permanent pasture, and non‐farm use), and 14% from all the other ecosystems (Figure 4). Indirect emissions following N leaching loss are found to result in an N2O source of 0.06 Tg N year−1 (the remaining 6% of the national total). The pre‐industrial soil N2O emission is estimated to be 0.32 ± 0.01 Tg N year−1 in the 1900s, with the largest N2O source residing in grassland (27%). Our estimation shows a threefold increase in total soil N2O emission (0.65 Tg N year−1) in the contiguous United States during 1900–2019, 74% of which has been attributed to N2O released from croplands, increasing by nearly 12 times from 0.04 Tg N year−1 in the 1900s to 0.51 Tg N year−1 in the 2010s. The enhanced N2O emissions from indirect sources and grassland soils contribute to 5% and 11% of the N2O increase since 1900, respectively, with the remaining 10% increase from other sources (Figure 4).
FIGURE 4.

Decadal average soil N2O emissions from terrestrial ecosystems in the United States during 1900–2019 as estimated by Dynamic Land Ecosystem Model. OtherFer represents N2O emissions due to N fertilizer uses in cropland pasture, permanent pasture, and non‐farm use. More than 65% of N2O increase is found before the 1980s
We find that total soil N2O emissions increased by 0.43 Tg N year−1 (135% relative to the 1900s average) during 1900–1980. Cropland N2O source has accounted for 72% of this increase, primarily owing to the increased agricultural N fertilizer input over this period. Since 1980, the N2O emission increase has slowed down, with an increase of 0.22 Tg N year−1 (30% relative to the 1980s average) during the last four decades. Cropland soil is still the dominant source, contributing to 76% of this increase, followed by grassland (15 of the N2O increase). However, N2O emissions from wetlands have declined after 1980, with the magnitude of the reduction equivalent to 4% of the total N2O increase.
3.3. Spatial pattern of direct soil N2O emission across the contiguous United States
Our results show that the hotspots of direct soil N2O emission over the 2010s located in the Corn Belt and the Rice Belt in the Lower Mississippi Alluvial Valley, with large areas releasing N2O at a rate of more than 0.2 g N2O‐N m−2 year−1. The peak N2O emissions are estimated to be higher than 0.8 g N2O‐N m−2 year−1 in the core areas of the U.S. Corn Belt, in which a large amount of fertilizer has been applied to stimulate crop growth. Spatially, the areas characterized by high N2O emissions have expanded from a few Corn Belt states (e.g., Iowa, Illinois, and Indiana) since the 1960s to a broader intensive agriculture region across the Midwest, and expanded northwestward into the Northern Great Plains in recent decades primarily owing to cropland expansion (Figure 5).
FIGURE 5.

Average annual direct soil N2O emission (g N m−2 year−1) across the contiguous United States in the 1900s (a), 1960s (b), 1990s (c), and 2010s (d)
We break down soil N2O emissions into agricultural and natural sources (Figure 6). Agricultural soils are dominant N2O sources across the US Midwest and the Lower Mississippi Alluvial Valley, with extensive areas releasing N2O at a rate of 0.8 g N2O‐N m−2 year−1 or higher. By contrast, the soils under natural ecosystems play an important role in emitting N2O in the southern and Southeastern United States (e.g., Texas, Lower Mississippi, Florida, etc.) and the Southwest (e.g., California), but the peak annual emission rate is only equivalent to or less than a quarter of agricultural soil emissions (mostly 0.1–0.2 g N2O‐N m−2 year−1). Except for these hotspots, most of the agricultural and natural soils across the United States display a low emission rate of less than 0.1 g N2O‐N m−2 year−1.
FIGURE 6.

Average annual direct N2O emission (g N m−2 year−1) from (a) agricultural and (b) natural soils during the 2010s
3.4. Regional distribution and dynamics of direct N2O emissions
Regardless of indirect emission and N2O sources from pasture and non‐farm fertilizer use, we estimate that the direct soil N2O emission has increased by 0.61 Tg N year−1 during the period 1900–2019, 78% of which (0.48 Tg N year−1) is attributed to cropland, while the remaining 22% (0.13 Tg N year−1) is attributed to natural soils. The total N2O emission from agricultural soils is shown to increase exponentially (Figure 4), with an increasing trend of 0.01 Tg N year−1 decade−1 (R2 = .84) in the pre‐1960 period, and a post‐1960 trend of 0.07 Tg N year−1 decade−1 (R 2 = .89). It corresponds to the exponential increase in national N fertilizer input over the entire study period.
We split the contiguous United States into seven sub‐regions (Figure 7). Among them, the Midwest has the largest share, releasing N2O at a rate of 0.30 Tg N year−1 during 2010–2019, followed by the Northern Great Plains with an emission rate of 0.10 Tg N year−1. Consequently, in cropped soils, 60% of the national total N2O emission increase is attributed to the Midwest, followed by 21% in the Northern Great Plains, and ~9% each from the Southern Great Plains and Southeast.
FIGURE 7.

Model‐estimated decadal average direct N2O emissions from agricultural (a) and natural soils (b) in the seven sub‐regions of the United States. (c, d) Indicate regional contributions to the national total changes in agricultural and natural soil N2O emissions, respectively, during 1900–2019
However, natural soil N2O emissions are found to have a slightly increasing trend over the entire study period, with a changing rate of 0.01 Tg N year−1 decade−1 (R 2 = .95, Figure 7b). By contrast, increases in N2O emissions from natural soils are more evenly distributed among regions. The Southeast and the Southern Great Plains together account for nearly 60% of emission increase in natural soils, followed by 17% from the Southwest, 11% from the Midwest, and 14% from the remaining regions.
3.5. Assessment of by‐crop N2O emission dynamics
Our assessment indicates that historical agricultural soil N2O emissions are of critical significance in shaping the dynamics of biogenic N2O fluxes across the country and over the century‐long period. However, the role of specific crop types varied over time, depending on their planting areas, anthropogenic N inputs, and crop‐specific capacity in fixing and using N. We sum up the time‐series crop‐specific fertilizer use rate and annual crop distribution maps, both used to force the modeling assessment in this study, to quantify the share of each crop in fertilizer input (Figure 8a). Since the 1960s, corn production has been the top N fertilizer consumer in the United States, accounting for approximately 41%–58% (i.e., min–max decadal average) of the national total cropland N fertilizer consumption, which excludes N fertilizer used in cropland pasture, permanent pasture, and non‐farm use. Winter wheat is the second largest single N consumer only next to corn, with its percentage ranging from 10% to 15% of the national total. Legume and other grain crops, including soybean, spring wheat, durum wheat, sorghum, rice, barley and other grains, together consume about 15% of the national total, while the remaining ~20% is applied to other crops such as cotton, fruits, and vegetables. Our analysis indicates that the U.S. crop N fertilizer consumption increased by 10.3 Tg N during 1900–2019, of which corn, winter wheat, and other crops received 58%, 10%, and 18%, respectively. Despite substantial changes found in N fertilizer use rate for the remaining crop types, they together contribute only 14% of the national increase in crop fertilizer uses due to relatively small planting areas or low fertilizer use rates.
FIGURE 8.

Decadal average crop‐specific N fertilizer consumption (a) and model‐estimated soil N2O emissions (b) across the United States during 1900–2019. Other represents all other crop types except the crops listed in (a), such as vegetables, fruits, and tree crops
Considering crop N uptake and environmental drivers that determine denitrification rates, our model simulations show that nearly two‐thirds of the N2O emission increase since 1900 in cropped soils came from corn production (an increase of 0.30 Tg N year−1, Figure 8b), and 28% from soybean (0.13 Tg N year−1). Winter wheat and other crops each contributed 3% of this increase owing to large amount of N additions, while the remaining 3% was attributed to the rest crop types. These results illustrate why the core Corn Belt area shows the highest level of N2O emission and the largest increases across the country.
3.6. Modeling attribution of soil N2O emission changes
Through multiple simulation experiments designed as Table 1, we distinguish and quantify the contributions of key environmental drivers to N2O emission changes relative to the background emission, which is estimated by keeping all the input drivers constant at the year 1900 values. Our results show that N fertilizer application is the dominant contributor in agricultural soil N2O emissions, leading to an increase of 0.33 Tg N year−1 (64% of the net change) during 1900–2019 (Figure 9). Land use and cover change, including both cropland expansion, abandonment, and inter‐annual rotations (i.e., crop type change year by year), is the second largest driving force, increasing agricultural soil N2O emission by 0.16 Tg N year−1, equivalent to 31% of the net change. We find a small contribution from other management practices, including 4% from tillage and 2% from manure N application. Human land use and agricultural management practices (including rotation, changes in fertilizer use rate, type, and timing, and manure N input in our case) together explain over 90% of the U.S. agricultural N2O emission growth since 1900 (Figure 9a). Changes in climate and atmosphere composition (including CO2 concentration and N deposition) together contribute to ~20% of net N2O increase from cropland. It's noteworthy that the sum of individual factorial contribution (i.e., stacked bars in Figure 8) does not exactly equal the net changes in N2O emissions. This is because the design of simulation experiments we adopted in this study (differences between all‐drivers‐on and all‐but‐one‐driver‐on experiment) assesses the full impacts of each factor by including the impacts of a given driver alone plus its interaction with others. This approach provides a fair estimation for each input driver but some interactions may have been double‐counted if we calculate the sum of the factorial contributions. For example, the impacts of rising CO2 concentration include CO2 fertilization effects under N additions and vice versa.
FIGURE 9.

Model estimates of the factorial contributions to changes in agricultural (a) and natural soil N2O emissions (b) in each decade since 1900. CLM, Ndep, LC, and Nfer denote the impacts of climate change, atmospheric N deposition, land use and cover changes, and N fertilizer uses (including annual changes in fertilizer use rate, type, and application timing). Note: the sum of factorial contributions doesn't equal the net change (black line) because each bar represents the impact of one individual driver plus its interactions with all other drivers
In natural soils, however, the key driving forces are found to be atmospheric N deposition and climate changes, leading to N2O emission increases of 0.14 Tg N year−1 and 0.05 Tg N year−1, respectively, during the period 1900–2019 (Figure 9b). Land use and cover change are estimated to reduce natural soil N2O emission by 0.12 Tg N year−1 because natural ecosystems have been converted to cropland to meet the growing demands of food and biofuel over the past century. Although land use changes reduce N2O emissions in the natural soil sector, it is noteworthy that the converted areas have become a stronger N2O source due to intensive cultivation and N addition for enhancing crop production. There is a minor contribution from N fertilizer use in natural soils because of the legacy effect when fertilized croplands are retired or converted to non‐agricultural lands (such as CRP—Conservation Reserve Program in the US).
4. DISCUSSIONS
In this work, we quantified the changes in direct and indirect soil N2O emissions over a century‐long period, and attributed the increased direct N2O emissions to various source groups, such as natural and agricultural ecosystems, seven sub‐regions of the United States, major crop types, as well as key driving forces. In the following section, we discussed the differences and similarity between this study and other work, identified the mitigation potentials revealed by the model‐estimated emissions factors across the nation and among crops, and possible uncertainty sources in this study. The source partitioning and estimations of crop‐specific N2O EFs and ratio of N2O to crop N balance imply a large N2O mitigation potential in croplands and identify dominant contributing crops for future greenhouse gas (GHG) mitigation efforts.
4.1. Comparison with other studies
Estimates of the U.S. soil N2O emissions have varied among studies, primarily because of the inconsistent study area, various N2O sources considered, and inherent differences between approaches (such as bottom‐up and top‐down estimations). Our estimates of N2O emissions from the U.S. soils totaled 0.97 ± 0.065 Tg N year−1 during 2010–2019, which is composed of direct emissions of 0.51 ± 0.045 Tg N year−1 from agricultural soils, 0.39 ± 0.019 Tg N year−1 from natural soils, 0.06 ± 0.01 Tg N year−1 from indirect emissions, and 0.01 ± 0.0002 Tg N year−1 from fertilizer used in pasture land and non‐farm sectors. These estimates fall well within the national total ranges by bottom‐up estimations (such as Li et al., 1996; Tian, Xu, et al., 2010; Xu et al., 2012; Table 2), as well as the estimation of agricultural sources alone. For example, our estimates of agricultural soil N2O emissions (0.37 ± 0.031 Tg N year−1 during the 1990s) are in between the bottom‐up estimates from the improved NGAS model (0.448–0.478 Tg N year−1) under hypothetic tillage scenarios (Mummey et al., 1998) and the estimated from combined DAYCENT model with IPCC methodology (0.262 Tg N year−1; Del Grosso et al., 2006) during the same period. It's noteworthy that the national indirect emission estimated by this study (0.056 ± 0.01 Tg N year−1 in the 1990s) is much lower than that estimated by Del Grosso et al. (2006), that is, 0.168 Tg N year−1 (calculated from the reported value, 70 Tg CO2 eq). Using the 2006 IPCC guidelines, the EPA (2021) reported an N2O source in the agriculture soils including both direct and indirect emissions (0.47–0.51 Tg N year−1 during 1990–2019) that is very close to our estimates. They consider several management activities that lead to direct soil N2O emissions, such as synthetic N fertilization, application of managed livestock manure, application of other organic materials, retention of crop residues (N‐fixing legumes and nonlegume crops and forages), and drainage of organic soils.
TABLE 2.
Comparisons of N2O emission from different studies
| References |
N2O (Tg N year−1) |
Reported region | Time period | Approach |
|---|---|---|---|---|
| Li et al. (1996) | 0.9–1.2 | US | 1990s | Model + extrapolation |
| Kort et al. (2008) | 2.74 a | US + southern Canada | 2003 | Atmospheric inversion |
| Miller et al. (2012) | 2.1–2.6 | US + southern Canada | 2004–2008 | Atmospheric inversion + extrapolation |
| Nevison et al. (2018) | 1.6 ± 0.3 | North America | 2008–2014 | Atmospheric inversion |
| Chen et al. (2016) b | 0.319 ± 0.184 | The Corn Belt agricultural sources | 2010 | Atmospheric inversion |
| 0.471 ± 0.326 | 2011 | |||
| Griffis et al. (2013) | 0.42 ± 0.05 | The Corn Belt agricultural sources | 2010 | Extrapolation from one tall tower measurement |
| 0.23 ± 0.18 | The Intergovernmental Panel on Climate Change (IPCC) EFs | |||
| Mummey et al. (1998) | 0.448–0.478 | US agricultural land | 1990s | Model + extrapolation |
| Del Grosso et al. (2006) | 0.439 c | US agricultural land | 1990–2003 | County‐level model simulation |
| EPA (2018) | 0.47–0.51 | US cropland soils (direct + indirect) | 1990–2019 | 2006 IPCC Guidelines |
| Xu et al. (2012) | 1.68 ± 0.15 | North America | 1979–2010 | Process‐based model |
| 1.01 | US | |||
| Tian et al. (2010) | 1.94 ± 0.1 | North America | 1979–2008 | Process‐based model |
| 1.10 | US | |||
| Tian et al. (2019) | 0.8 ± 0.3 | US total | 2007–2016 | Model ensemble (NMIP) |
| 0.3 ± 0.2 | US ag soils | |||
| 0.4 ± 0.2 | US natural soils | |||
| Yao et al. (2020) d | 0.05 ± 0.005 | US indirect emissions | 2007–2016 | Process‐based model |
| This study |
0.44 ± 0.044 0.51 ± 0.051 |
US ag soils‐direct |
2000s 2010s |
Process‐based model |
|
0.38 ± 0.01 0.38 ± 0.008 |
US natural soils‐direct |
2000s 2010s |
||
| 0.06 (0–0.1) | US indirect emissions | 2010s | ||
|
0.88 ± 0.042 0.97 ± 0.065 |
US total e |
2000s 2010s |
Abbreviations: EF, emission factor; NMIP, N2O Model Intercomparison Project.
Converted from 4.3 Tg N2O.
N2O from agricultural soil, direct emission at 0.188 ± 0.066 in 2010 and 0.198 ± 0.080 Tg N year−1 in 2011, while indirect emission at 0.131 ± 0.118 in 2010 and 0.273 ± 0.246 Tg N year−1 in 2011.
Unknown year in 1990–2003.
Only include indirect emissions from streams and rivers.
The US total reported in this study includes N2O emission from agricultural soils, natural soils, fertilizer used in pasture land and non‐farm use (0.01 ± 0.0002 Tg N year−1 in the 2000s), and indirect emissions.
However, top‐down estimations usually aggregate more N2O source types than direct and indirect emissions, such as fossil fuel combustion, industry non‐combustion processes, biomass burning, manure management (mainly the part of manure not applied in croplands), and solid waste and sewage water. Therefore, the top‐down N2O emission estimates are reported to be much higher than those from bottom‐up approaches (Griffis et al., 2013; Miller et al., 2012; Xiang et al., 2013). Due to the nature of atmospheric inversion studies, top‐down estimations are limited in quantifying N2O emissions from specific source types (Chen et al., 2016). This limitation makes it implausible to directly compare top‐down N2O estimates with bottom‐up results unless the total N2O emissions in the compared region are dominated by the known sources that are included by both approaches (e.g., agricultural emission in the US Midwest). In this study, our estimates of the total N2O emissions in the Midwest region (e.g., 0.36 ± 0.03 and 0.02 ± 0.003 Tg N year−1 from direct and indirect emissions, respectively, in the 2000s) are very close to top‐down estimates in the Corn Belt [e.g., 0.319 ± 0.184 Tg N year−1 in 2010 from Chen et al. (2016) and 0.42 ± 0.05 Tg N year−1 from Griffis et al. (2013)].
Specifically, our study presents a similar magnitude and dynamics of N2O emissions as the a top‐down estimation (Carbon Tracker‐Lagrange [CTL] reported by Nevison et al., 2018), which quantified the rate of N2O emissions across the United States from 2008 to 2013 (Figure 10). The spatial extent of multi‐year average N2O emissions shown by this study generally agrees well with the CTL regional inversion, identifying the Midwest as a hotspot of N2O emissions (Figure 10a,c). On average, our estimation shows that the national soil N2O emissions (including direct and indirect) account for 74% of the CTL‐reported national total N2O sources, while our estimates explain 93% of the CTL‐estimated N2O sources in the US Midwest (Figure 10b,d). Due to its coarse resolution (e.g., 1° × 1°), however, the CTL estimations fail to capture the mesoscale spatial heterogeneity in N2O emissions across the United States.
FIGURE 10.

N2O emission comparisons between Dynamic Land Ecosystem Model (DLEM) and top‐down estimation. Spatial distributions of multi‐year average N2O emissions (g N m−2 year−1) estimated by DLEM (a) and Carbon Tracker‐Lagrange (CTL) approach (c) from 2008 to 2013. The Midwest region is highlighted by the red boundary. Time series of annual N2O emissions (Tg N year−1) estimated by DLEM and CTL across the United States (b) and the U.S. Midwest (d)
4.2. Assessment of crop‐specific N2O emissions
By using the simulation experiments with and without fertilizer changes (Table 1), we obtain the model estimates of fertilizer‐induced N2O emissions and calculate their ratios to annual fertilizer input as N2O EFs (i.e., N2O‐N emitted by per unit fertilizer input). The spatial map of EF in the 2010s shows hot spots in the US Corn‐Belt and Rice‐Belt areas, including Iowa, Illinois, Indiana, Ohio, and the eastern part of Nebraska and Kansas, in which EF values are higher than 4% (Figure 11a). We also estimate by‐crop EF values as the ratio of fertilizer‐induced N2O emissions for each crop type each year to crop‐specific fertilizer use amount. The decadal median and range of by‐crop EFs is calculated for the soils under each crop. On average, our results suggest an EF of 2.6% (median) and the interquartile range (IQR), defined as the difference between the 25th quartile and the 75th quartile, of 0.6% for direct emissions across the U.S. cropped soil (Figure 11b). The highest EF is found in corn planting area (median of 4% and IQR of 0.5%), rice fields (median 1.4% and IQR 0.3%), compared to an EF value of 0.9%–1.1% in other major crop types. These values are higher than the EFs (1.5%–1.6%) suggested by atmospheric inversions (Chen et al., 2016; Griffis et al., 2013) and studies using a nonlinear response model (Grace et al., 2011; Shcherbak et al., 2014). However, our EF estimate (2.6%), specifically for fertilizer use in the US agricultural soils, agrees well with a recent top‐down estimate for global lands (2.3% ± 0.6% in Thompson et al. (2019)) and the fertilizer‐derived EF (2%) estimated by Davidson (2009). Our EF values in cornfields alone (4%) are close to those suggested by a more recent atmospheric inversion study (e.g., 4.2%–4.6% for the Midwest Corn‐Soybean Belt, Nevison et al., 2018) and a 3‐year high‐frequency measurement in central Iowa (4% on average, Lawrence et al., 2021). These values likely reflect the high levels of annual N fertilizer use in the US corn and rice planted areas, which is over 15 g N m−2 since the 1980s (Cao et al., 2018). In some Midwest states such as Illinois and Indiana, the state‐level average N fertilizer use rates in cornfields are reported as high as 18 g N m−2 year−1. The extra N input exceeding crop demand potentially ends up as N2O emission and thus elevates the EF in these crops. Moreover, our study considers historical records of N fertilizer application timing, which may also explain the higher EF estimates for soils under corn compare to previous bottom‐up studies. On average, 68% of annual N fertilizer is applied before planting, including 18% applied in the previous fall after the crops are harvested (Cao et al., 2018). The intensive agricultural states such as Illinois, Iowa, and Minnesota apply over 75% of annual N fertilizer before planting, including over 25% of fertilizer applied in the previous fall (Cao et al., 2018). A large amount of N stored in soils during the non‐growing season increases the likelihood of N2O emission, especially during the spring thawing period (Wagner‐Riddle et al., 2017), and results in higher EF. On the other hand, the EF‐based empirical N2O estimations mostly adopt a fixed EF value or ignore the impacts of spatially heterogeneous and temporally dynamic crop‐specific management practices (e.g., fertilizer management, irrigation, tillage, and tile drainage) (Hergoualc'h et al., 2019), which could lead to underestimation of N2O emissions.
FIGURE 11.

Spatial patterns of emission factor (EF, the ratio of fertilizer‐induced direct soil N2O emissions to fertilizer inputs, indicating how much N fertilizer has been emitted as N2O) in the 2010s (a), crop‐specific EF (b) and the ratio of by‐crop soil N2O emissions to N surplus [(c) indicating how much unused N input in croplands has been released as N2O] during the period 1970–2019. A “crop total” EF indicates the ratio of the direct agricultural soil N2O emissions induced by fertilizer input to the national total N fertilizer amount. The N surplus of the eight crop types was obtained from Zhang et al. (2021). The negative N2O:N surplus ratio is due to the negative N surplus indicating that soil mining likely occurs for the crops. The box, which is referred to as the interquartile range (IQR), includes the middle 50% of values of the EF and the N2O:N surplus when ordered from lowest to highest. The upper and lower hinge of the box indicates the 25% and the 75% quantile, respectively. The horizontal line within the box is the median value (the 50% quantile). The upper and lower whiskers extend from the box hinge to the existing values within the range of 1.5 × IQR, respectively. The black dots beyond the end of the whiskers are outlier data points
We then calculate the ratio of the annual N2O emission in each crop type estimated by this study to the crop‐specific annual N surplus reported in a recent study (Zhang et al., 2021) during 1970–2019 (Figure 11c). Crop N surplus, the part of unused N, is calculated as the difference between total N input and N harvested in each crop each year. Therefore, this ratio indicates how much unused N in croplands ended up as N2O emissions. We find that the N2O emissions in cornfields account for 8.4% (median) of annual crop N surplus, with the IQR of 2.9% (Figure 11c), indicating a large potential of mitigating N2O emission from corn‐planting soils by reducing N surplus. For the rest of crops, this ratio ranges between 2.7% (median, IQR of 0.6%) in rice fields and 6.5% (median, IQR of 3%) in winter wheat. Although the EF value of rice is second only to corn, the relatively lower N2O share of its annual N surplus is likely caused by the fact that the proportion of unused N in the rice‐planting area remains high due to its relatively low nitrogen use efficiency (Zhang et al., 2021). It indicates a large proportion of unused N in rice fields is lost via NH3 volatilization, N in surface runoff, and as N2 via denitrification (Cao et al., 2020; Choudhury & Kennedy, 2005; Griggs et al., 2007; Linquist et al., 2014). The large range of N2O:N surplus ratio in durum wheat (median 2.4%, IQR of 9.0%) is mainly related to the large variations in its N balance ranging from soil mining (negative balance) to N surplus over years.
4.3. Uncertainty in the estimation of direct and indirect N2O emission
In this study, the spatial heterogeneity of N2O emissions estimated for each crop type may be underrepresented due to the paucity of sub‐state fertilizer use details. The use of nitrification inhibitor with ammonium N fertilizer can significantly reduce the release of N2O by inhibiting the conversion from NH4 + to NO3 − (Guardia et al., 2018; Shi et al., 2017). Applying N fertilizer in the fall or spring before planting increases the risk of N2O loss; thus, the adoption of inhibitors at pre‐planting application is highly recommended. For example, USDA‐ERS reports that about 12% of the corn‐planting areas in the US received the N inhibitors in recent years. However, due to the lack of information on where it was used, the impacts of fertilizer inhibitors on suppressing N2O emission were not considered in this study. We may overestimate the N2O emission in the regions with the popularity of the pre‐planting application of fertilizer with inhibitors. Besides, the tillage intensity was set to a constant level before 1998 due to a lack of information on early‐stage tillage dynamics at the national scale. Yet, it should be noted that historical changes of tillage intensity, which is obvious due to the conservative agricultural managements enforced after the “dust bowl,” could affect the dynamics of N2O emissions. Thus, further study is needed to more accurately account for N2O emission during the period before 1998, in which the details of the tillage practices adopted are required.
There is a large N2O estimation uncertainty in indirect emissions, although its proportion to the total biogenic source is small. Here we considered several indirect emission sources, including leaching and runoff of N from fertilizer, manure, and soil N residue. Due to a lack of observations at the appropriate spatial and temporal scales, indirect emissions from leaching and runoff have a wide emission factor range from 0.0005 to 0.025 (a 50‐fold range) (Nevison, 2000; Outram & Hiscock, 2012; Turner et al., 2015). The widely used 2006 IPCC recommended N2O EFs also consider the spatial heterogeneity of fertilizer types (e.g., synthetic fertilizer vs. manure fertilizer) and climate regimes, although they may underestimate N2O emission (Griffis et al., 2013; Turner et al., 2015). In 2019, the IPCC has refined the 2006 EFs incorporating groundwater and surface drainage, rivers and reservoirs, and estuaries, increasing the combined leaching/runoff EF from 0.0075 to 0.011 with an uncertainty range from 0.000 to 0.02 (Hergoualc’h et al., 2019). The indirect N2O emissions in our study are based on pixel‐level modeled N leaching amount and the IPCC refined EF. Therefore, the estimated indirect N2O emissions in the United States in this study range from 0 to 0.1 Tg N year−1 with the mean value of 0.06 Tg N year−1 in the 2010s, which is consistent with the previously reported values (e.g., 0.04–0.18 Tg N year−1 with a mean of 0.09 Tg N year−1 estimated by Turner et al., 2015; and 0.15 Tg N year−1 estimated by Del Grosso et al., 2006). More measurement data are needed to support future process‐based modeling of indirect N2O emissions and to reduce the estimation uncertainty (Beaulieu et al., 2011; Quick et al., 2019; Yao et al., 2020).
5. CONCLUSION
As the United States has re‐joined the Paris Agreement on climate change with ambitious goals for mitigating greenhouse gas emissions, it is of critical importance to understand and quantify how soil N2O emissions, one important biogenic GHG source, varied over space and time, and who primarily contributed to the historical increase in N2O emissions. By using the newly‐developed land use and agricultural management data, this study presents a comprehensive bottom‐up assessment and delineates the spatial and temporal patterns of terrestrial soil N2O emissions across the contiguous United States since 1900. We attribute the changes in direct soil N2O emissions to various source groups, such as natural and agricultural ecosystems, seven sub‐regions of the United States, major crop types, as well as key forcing drivers. We find a threefold increase in the total soil N2O emissions in the United States since 1900, 74% of which came from agricultural soils. Corn and soybean production account for more than 90% of agricultural soil N2O emission increase, which implies a dominant role of the US corn‐soybean cropping system in greenhouse gas emissions and climate warming. Increasing fertilizer use and land use change (including changes in cropland acreage, distribution, crop types, and rotation) are found to be two dominant drivers, accounting for 64% and 31% of agricultural soil N2O emission increase since 1900, respectively. Therefore, our study indicates a large N2O mitigation potential in the US agricultural soil management, given the dominant contribution of agricultural soils and a large share of N2O emissions in N surplus of certain crops (e.g., direct soil N2O emission in corn‐planting areas accounting for ~9% of its N surplus). We suggest that soil N2O emissions in the United States could be reduced through properly managing N inputs (e.g., following 4R principles‐Right source, Right rate, Right time, and Right place) to enhance N use efficiency and reduce the amount of unused N in crop production. In addition, improved management alternatives on targeted crops ought to be tested and adopted by identifying the top N2O sources, like corn and soybean cropping systems.
CONFLICT OF INTEREST
The authors declare that there is no conflict of interest regarding the publication of this article.
Supporting information
Supplementary Material
ACKNOWLEDGMENTS
This work was supported by National Science Foundation (#1903722), NSF CAREER award (#1945036), and Iowa State University Postdoctoral Seed Grant Award. We are greatly thankful for Dr. Timothy B. Parkin at USDA‐ARS who provided the site‐level measurement data of soil N2O emissions to validate our model. We thank two anonymous reviewers for their constructive comments in improving this paper. Open access funding provided by the Iowa State University Library.
Lu, C. , Yu, Z. , Zhang, J. , Cao, P. , Tian, H. , & Nevison, C. (2022). Century‐long changes and drivers of soil nitrous oxide (N2O) emissions across the contiguous United States. Global Change Biology, 28, 2505–2524. 10.1111/gcb.16061
DATA AVAILABILITY STATEMENT
The model estimates of annual soil N2O emissions across the United States at the resolution of 5 arc‐min by 5 arc‐min can be accessed at: https://doi.org/10.6084/m9.figshare.17207348.v1.
REFERENCES
- Abraha, M. , Gelfand, I. , Hamilton, S. K. , Chen, J. , & Robertson, G. P. (2018). Legacy effects of land use on soil nitrous oxide emissions in annual crop and perennial grassland ecosystems. Ecological Applications, 28(5), 1362–1369. 10.1002/eap.1745 [DOI] [PubMed] [Google Scholar]
- Agehara, S. , & Warncke, D. D. (2005). Soil moisture and temperature effects on nitrogen release from organic nitrogen sources. Soil Science Society of America Journal, 69(6), 1844–1855. 10.2136/sssaj2004.0361 [DOI] [Google Scholar]
- Beaulieu, J. J. , Tank, J. L. , Hamilton, S. K. , Wollheim, W. M. , Hall, R. O. , Mulholland, P. J. , Peterson, B. J. , Ashkenas, L. R. , Cooper, L. W. , Dahm, C. N. , Dodds, W. K. , Grimm, N. B. , Johnson, S. L. , McDowell, W. H. , Poole, G. C. , Valett, H. M. , Arango, C. P. , Bernot, M. J. , Burgin, A. J. , … Thomas, S. M. (2011). Nitrous oxide emission from denitrification in stream and river networks. Proceedings of the National Academy of Sciences United States of America, 108(1), 214–219. 10.1073/pnas.1011464108 [DOI] [PMC free article] [PubMed] [Google Scholar]
- Bian, Z. , Tian, H. , Yang, Q. , Xu, R. , Pan, S. , & Zhang, B. (2021). Production and application of manure nitrogen and phosphorus in the United States since 1860. Earth System Science Data, 13(2), 515–527. 10.5194/essd-13-515-2021 [DOI] [Google Scholar]
- Brakebill, J. W. , & Gronberg, J. M. (2017). County‐level estimates of nitrogen and phosphorus from commercial fertilizer for the conterminous United States, 1987–2012. US Geological Survey. [Google Scholar]
- Canadell, J. G. , Monteiro, P. M. S. , Costa, M. H. , Cotrim da Cunha, L. , Cox, P. M. , Eliseev, A. V. , Henson, S. , Ishii, M. , Jaccard, S. , Koven, C. , Lohila, A. , Patra, P. K. , Piao, S. , Rogelj, J. , Syampungani, S. , Zaehle, S. , & Zickfeld, K. (2021). Global carbon and other biogeochemical cycles and feedbacks. In Masson‐Delmotte V., Zhai P., Pirani A., Connors S. L., Péan C., Berger S., Caud N., Chen Y., Goldfarb L., Gomis M. I., Huang M., Leitzell K., Lonnoy E., Matthews J. B. R., Maycock T. K., Waterfield T., Yelekçi O., Yu R., & Zhou B. (Eds.), Climate change 2021: The physical science basis. Contribution of Working Group I to the Sixth Assessment Report of the Intergovernmental Panel on Climate Change. Cambridge University Press, in press. [Google Scholar]
- Cao, P. , Lu, C. , & Yu, Z. (2018). Historical nitrogen fertilizer use in agricultural ecosystems of the contiguous United States during 1850–2015: Application rate, timing, and fertilizer types. Earth System Science Data, 10(2), 969–984. 10.5194/essd-10-969-2018 [DOI] [Google Scholar]
- Cao, P. , Lu, C. , Zhang, J. , & Khadilkar, A. (2020). Northwestward cropland expansion and growing urea‐based fertilizer use enhanced NH3 emission loss in the contiguous United States. Atmospheric Chemistry and Physics, 20(20), 11907–11922. [Google Scholar]
- Cavigelli, M. A. , Del Grosso, S. J. , Liebig, M. A. , Snyder, C. S. , Fixen, P. E. , Venterea, R. T. , Leytem, A. B. , McLain, J. E. , & Watts, D. B. (2012). US agricultural nitrous oxide emissions: context, status, and trends. Frontiers in Ecology and the Environment, 10(10), 537–546. 10.1890/120054 [DOI] [Google Scholar]
- Chen, Z. , Griffis, T. J. , Millet, D. B. , Wood, J. D. , Lee, X. , Baker, J. M. , Xiao, K. , Turner, P. A. , Chen, M. , Zobitz, J. , & Wells, K. C. (2016). Partitioning N2O emissions within the U.S. Corn Belt using an inverse modeling approach. Global Biogeochemical Cycles, 30(8), 1192–1205. 10.1002/2015GB005313 [DOI] [Google Scholar]
- Choudhury, A. , & Kennedy, I. R. (2005). Nitrogen fertilizer losses from rice soils and control of environmental pollution problems. Communications in Soil Science and Plant Analysis, 36(11–12), 1625–1639. 10.1081/CSS-200059104 [DOI] [Google Scholar]
- Cusick, P. R. , Powell, J. M. , Kelling, K. A. , Hensler, R. F. , & Muňoz, G. R. (2006). Dairy manure N mineralization estimates from incubations and litterbags. Biology and Fertility of Soils, 43(2), 145–152. 10.1007/s00374-006-0071-z [DOI] [Google Scholar]
- David, M. B. , McIsaac, G. F. , Royer, T. V. , Darmody, R. G. , & Gentry, L. E. (2001). Estimated historical and current nitrogen balances for Illinois. The Scientific World Journal, 1(Suppl 2), 597–604. 10.1100/tsw.2001.283 [DOI] [PMC free article] [PubMed] [Google Scholar]
- Davidson, E. A. (2009). The contribution of manure and fertilizer nitrogen to atmospheric nitrous oxide since 1860. Nature Geoscience, 2(9), 659–662. 10.1038/ngeo608 [DOI] [Google Scholar]
- Del Grosso, S. J. , Ogle, S. M. , Parton, W. J. , & Breidt, F. J. (2010). Estimating uncertainty in N2O emissions from U.S. cropland soils. Global Biogeochemical Cycles, 24(1). 10.1029/2009gb003544 [DOI] [Google Scholar]
- Del Grosso, S. J. , Parton, W. J. , Mosier, A. R. , Walsh, M. K. , Ojima, D. S. , & Thornton, P. E. (2006). DAYCENT national‐scale simulations of nitrous oxide emissions from cropped soils in the United States. Journal of Environmental Quality, 35(4), 1451–1460. 10.2134/jeq2005.0160 [DOI] [PubMed] [Google Scholar]
- EPA . (2018). U.S. greenhouse gas emissions and sinks, 1990‐2016. Epa 430‐R‐18‐003.
- EPA . (2021). Inventory of US greenhouse gas emissions and sinks: 1990‐‐ 2019. US EPA.
- Fox, R. H. , & Bandel, V. A. (1986). Nitrogen utilization with no‐tillage. In Sprague M. A., & Triplett G. B. (Eds.), No‐tillage and surface‐tillage agriculture. The tillage revolution (pp. 117–148). Wiley‐Interscience. [Google Scholar]
- Gaillard, R. K. , Jones, C. D. , Ingraham, P. , Collier, S. , Izaurralde, R. C. , Jokela, W. , Osterholz, W. , Salas, W. , Vadas, P. , & Ruark, M. D. (2018). Underestimation of N2O emissions in a comparison of the DayCent, DNDC, and EPIC models. Ecological Applications, 28(3), 694–708. [DOI] [PubMed] [Google Scholar]
- Gilley, J. E. (2005). EROSION|water‐induced. Encyclopedia of Soils in the Environment, 4, 463–469. https://www.sciencedirect.com/science/article/pii/B0123485304002629 [Google Scholar]
- Grace, P. R. , Robertson, G. P. , Millar, N. , Colunga‐Garcia, M. , Basso, B. , Gage, S. H. , & Hoben, J. (2011). The contribution of maize cropping in the Midwest USA to global warming: A regional estimate. Agricultural Systems, 104(3), 292–296. 10.1016/j.agsy.2010.09.001 [DOI] [Google Scholar]
- Griffis, T. J. , Chen, Z. , Baker, J. M. , Wood, J. D. , Millet, D. B. , Lee, X. , Venterea, R. T. , & Turner, P. A. (2017). Nitrous oxide emissions are enhanced in a warmer and wetter world. Proceedings of the National Academy of Sciences of the United States of America, 114(45), 12081–12085. 10.1073/pnas.1704552114 [DOI] [PMC free article] [PubMed] [Google Scholar]
- Griffis, T. J. , Lee, X. , Baker, J. M. , Russelle, M. P. , Zhang, X. , Venterea, R. , & Millet, D. B. (2013). Reconciling the differences between top‐down and bottom‐up estimates of nitrous oxide emissions for the U.S. Corn Belt. Global Biogeochemical Cycles, 27(3), 746–754. 10.1002/gbc.20066 [DOI] [Google Scholar]
- Griggs, B. R. , Norman, R. J. , Wilson, C. E. , & Slaton, N. A. (2007). Ammonia volatilization and nitrogen uptake for conventional and conservation tilled dry‐seeded, delayed‐flood rice. Soil Science Society of America Journal, 71(3), 745–751. 10.2136/sssaj2006.0180 [DOI] [Google Scholar]
- Grossel, A. , Nicoullaud, B. , Bourennane, H. , Lacoste, M. , Guimbaud, C. , Robert, C. , & Hénault, C. (2016). The effect of tile‐drainage on nitrous oxide emissions from soils and drainage streams in a cropped landscape in Central France. Agriculture, Ecosystems and Environment, 230, 251–260. 10.1016/j.agee.2016.06.015 [DOI] [Google Scholar]
- Guardia, G. , Marsden, K. A. , Vallejo, A. , Jones, D. L. , & Chadwick, D. R. (2018). Determining the influence of environmental and edaphic factors on the fate of the nitrification inhibitors DCD and DMPP in soil. Science of the Total Environment, 624, 1202–1212. 10.1016/j.scitotenv.2017.12.250 [DOI] [PubMed] [Google Scholar]
- Heffer, P. (2013). Assessment of fertilizer use by crop at the global level. International Fertilizer Industry Association. [Google Scholar]
- Hergoualc'h, K. , Akiyama, H. , Bernoux, M. , Chirinda, N. , del Prado, A. , Kasimir, Å. , MacDonald, J. D. , Ogle, S. M. , Regina, K. , & van der Weerden, T. J. (2019). N2O emissions from managed soils, and CO2 emissions from lime and urea application. In Calvo Buendia E., Tanabe K., Kranjc A., Baasansuren J., Fukuda M., Ngarize S., Osako A., Pyrozhenko Y., Shermanau P., & Federici S. (Eds.), 2019 Refinement to the 2006 IPCC guidelines for national greenhouse gas inventories, volume 4: Agriculture, forestry and other land use switzerland. Intergovernmental Panel on Climate Change (IPCC). [Google Scholar]
- Hurtt, G. C. , Chini, L. P. , Frolking, S. , Betts, R. A. , Feddema, J. , Fischer, G. , Fisk, J. P. , Hibbard, K. , Houghton, R. A. , Janetos, A. , Jones, C. D. , Kindermann, G. , Kinoshita, T. , Klein Goldewijk, K. , Riahi, K. , Shevliakova, E. , Smith, S. , Stehfest, E. , Thomson, A. , … Wang, Y. P. (2011). Harmonization of land‐use scenarios for the period 1500–2100: 600 years of global gridded annual land‐use transitions, wood harvest, and resulting secondary lands. Climatic Change, 109(1), 117–161. 10.1007/s10584-011-0153-2 [DOI] [Google Scholar]
- Kort, E. A. , Eluszkiewicz, J. , Stephens, B. B. , Miller, J. B. , Gerbig, C. , Nehrkorn, T. , Daube, B. C. , Kaplan, J. O. , Houweling, S. , & Wofsy, S. C. (2008). Emissions of CH4 and N2O over the United States and Canada based on a receptor‐oriented modeling framework and COBRA‐NA atmospheric observations. Geophysical Research Letters, 35(18), L18808. 10.1029/2008GL034031 [DOI] [Google Scholar]
- Lawrence, N. C. , Tenesaca, C. G. , VanLoocke, A. , & Hall, S. J. (2021). Nitrous oxide emissions from agricultural soils challenge climate sustainability and in the US Corn Belt. Proceedings of the National Academy of Sciences, 118(46). https://doi.org.10.1073/pnas.2112108118 [DOI] [PMC free article] [PubMed] [Google Scholar]
- Lemunyon, J. , & Gross, C. (2003). Conservation tillage and crop residue management. http://agris.fao.org/agris‐search/search.do?recordID=US201300115130 [Google Scholar]
- Li, C. , Frolking, S. , & Harriss, R. (1994). Modeling carbon biogeochemistry in agricultural soils. Global Biogeochemical Cycles, 8(3), 237–254. 10.1029/94GB00767 [DOI] [Google Scholar]
- Li, C. , Narayanan, V. , & Harriss, R. C. (1996). Model estimates of nitrous oxide emissions from agricultural lands in the United States. Global Biogeochemical Cycles, 10(2), 297–306. 10.1029/96GB00470 [DOI] [Google Scholar]
- Linn, D. M. , & Doran, J. W. (1984). Aerobic and anaerobic microbial populations in no‐till and plowed soils. Soil Science Society of America Journal, 48(4), 794–799. 10.2136/sssaj1984.03615995004800040019x [DOI] [Google Scholar]
- Linquist, B. A. , Ruark, M. D. , Mutters, R. , Greer, C. , & Hill, J. E. (2014). Nutrients and sediments in surface runoff water from direct‐seeded rice fields: Implications for nutrient budgets and water quality. Journal of Environmental Quality, 43(5), 1725–1735. 10.2134/jeq2014.03.0135 [DOI] [PubMed] [Google Scholar]
- Liu, M. , & Tian, H. (2010). China’s land cover and land use change from 1700 to 2005: Estimations from high‐resolution satellite data and historical archives. Global Biogeochemical Cycles, 24(3), GB3003. 10.1029/2009GB003687 [DOI] [Google Scholar]
- Liu, M. , Tian, H. , Yang, Q. , Yang, J. , Song, X. , Lohrenz, S. E. , & Cai, W. J. (2013). Long‐term trends in evapotranspiration and runoff over the drainage basins of the Gulf of Mexico during 1901–2008. Water Resources Research, 49(4), 1988–2012. 10.1002/wrcr.20180 [DOI] [Google Scholar]
- Lu, C. , & Tian, H. (2017). Global nitrogen and phosphorus fertilizer use for agriculture production in the past half century: shifted hot spots and nutrient imbalance. Earth System Science Data, 9(1), 181–192. 10.5194/essd-9-181-2017 [DOI] [Google Scholar]
- Lu, C. , Tian, H. (2013). Net greenhouse gas balance in response to nitrogen enrichment: perspectives from a coupled biogeochemical model. Global change Biology, 19(2), 571–588. 10.1111/gcb.12049 [DOI] [PubMed] [Google Scholar]
- Lu, C. , Yu, Z. , Tian, H. , Hennessy, D. A. , Feng, H. , Al‐Kaisi, M. , Zhou, Y. , Sauer, T. , & Arritt, R. (2018). Increasing carbon footprint of grain crop production in the US Western Corn Belt. Environmental Research Letters, 13(12), 124007. 10.1088/1748-9326/aae9fe [DOI] [Google Scholar]
- Meurer, K. H. E. , Franko, U. , Stange, C. F. , Dalla Rosa, J. , Madari, B. E. , & Jungkunst, H. F. (2016). Direct nitrous oxide (N2O) fluxes from soils under different land use in Brazil ‐ A critical review. Environmental Research Letters, 11(2), 023001. 10.1088/1748-9326/11/2/023001 [DOI] [Google Scholar]
- Miller, S. M. , Kort, E. A. , Hirsch, A. I. , Dlugokencky, E. J. , Andrews, A. E. , Xu, X. , Tian, H. , Nehrkorn, T. , Eluszkiewicz, J. , Michalak, A. M. , & Wofsy, S. C. (2012). Regional sources of nitrous oxide over the United States: Seasonal variation and spatial distribution. Journal of Geophysical Research Atmospheres, 117(6), D06310. 10.1029/2011JD016951 [DOI] [Google Scholar]
- Mummey, D. L. , Smith, J. L. , & Bluhm, G. (1998). Assessment of alternative soil management practices on N2O emissions from US agriculture. Agriculture, Ecosystems and Environment, 70(1), 79–87. 10.1016/S0167-8809(98)00117-0 [DOI] [Google Scholar]
- Nakagaki, N. , Wieczorek, M. E. & Qi, S. L. (2016). Estimates of subsurface tile drainage extent for the conterminous United States, early 1990s. U.S. Geological Survey Data Release. 10.5066/F7RB72QS [DOI] [Google Scholar]
- Nevison, C. (2000). Review of the IPCC methodology for estimating nitrous oxide emissions associated with agricultural leaching and runoff. Chemosphere‐Global Change Science, 2(3–4), 493–500. 10.1016/S1465-9972(00)00013-1 [DOI] [Google Scholar]
- Nevison, C. , Andrews, A. , Thoning, K. , Dlugokencky, E. , Sweeney, C. , Miller, S. , Saikawa, E. , Benmergui, J. , Fischer, M. , Mountain, M. , & Nehrkorn, T. (2018). Nitrous oxide emissions estimated with the carbontracker‐Lagrange North American regional inversion framework. Global Biogeochemical Cycles, 32(3), 463–485. 10.1002/2017GB005759 [DOI] [Google Scholar]
- Outram, F. N. , & Hiscock, K. M. (2012). Indirect nitrous oxide emissions from surface water bodies in a lowland arable catchment: A significant contribution to agricultural greenhouse gas budgets? Environmental Science & Technology, 46(15), 8156–8163. 10.1021/es3012244 [DOI] [PubMed] [Google Scholar]
- Parkin, T. B. , Kaspar, T. C. , Jaynes, D. B. , & Moorman, T. B. (2016). Rye cover crop effects on direct and indirect nitrous oxide emissions. Soil Science Society of America Journal, 80(6), 1551–1559. 10.2136/sssaj2016.04.0120 [DOI] [Google Scholar]
- Petersen, S. O. , Mutegi, J. K. , Hansen, E. M. , & Munkholm, L. J. (2011). Tillage effects on N2O emissions as influenced by a winter cover crop. Soil Biology and Biochemistry, 43(7), 1509–1517. 10.1016/j.soilbio.2011.03.028 [DOI] [Google Scholar]
- Quick, A. M. , Reeder, W. J. , Farrell, T. B. , Tonina, D. , Feris, K. P. , & Benner, S. G. (2019). Nitrous oxide from streams and rivers: A review of primary biogeochemical pathways and environmental variables. Earth‐Science Reviews, 191, 224–262. 10.1016/j.earscirev.2019.02.021 [DOI] [Google Scholar]
- Ravishankara, A. R. , Daniel, J. S. , & Portmann, R. W. (2009). Nitrous oxide (N2O): The dominant ozone‐depleting substance emitted in the 21st century. Science, 326(5949), 123–125. 10.1126/science.1176985 [DOI] [PubMed] [Google Scholar]
- Seitzinger, S. P. , & Kroeze, C. (1998). Global distribution of nitrous oxide production and n inputs in freshwater and coastal marine ecosystems. Global Biogeochemical Cycles, 12(1), 93–113. 10.1029/97GB03657 [DOI] [Google Scholar]
- Shcherbak, I. , Millar, N. , & Robertson, G. P. (2014). Global metaanalysis of the nonlinear response of soil nitrous oxide (N2O) emissions to fertilizer nitrogen. Proceedings of the National Academy of Sciences of the United States of America, 111(25), 9199–9204. 10.1073/pnas.1322434111 [DOI] [PMC free article] [PubMed] [Google Scholar]
- Shi, X. , Hu, H. , Zhu‐Barker, X. , Hayden, H. , Wang, J. , Suter, H. , Chen, D. , & He, J. (2017). Nitrifier‐induced denitrification is an important source of soil nitrous oxide and can be inhibited by a nitrification inhibitor 3, 4‐dimethylpyrazole phosphate. Environmental Microbiology, 19(12), 4851–4865. [DOI] [PubMed] [Google Scholar]
- Sugg, Z. (2007). Assessing U.S. farm drainage: Can GIS lead to better estimates of subsurface drainage extent? World Resource Institute. [Google Scholar]
- Syakila, A. , & Kroeze, C. (2011). The global nitrous oxide budget revisited. Greenhouse Gas Measurement and Management, 1(1), 17–26. 10.3763/ghgmm.2010.0007 [DOI] [Google Scholar]
- Thompson, R. L. , Lassaletta, L. , Patra, P. K. , Wilson, C. , Wells, K. C. , Gressent, A. , Koffi, E. N. , Chipperfield, M. P. , Winiwarter, W. , Davidson, E. A. , Tian, H. , & Canadell, J. G. (2019). Acceleration of global N2O emissions seen from two decades of atmospheric inversion. Nature Climate Change, 9(12), 993–998. 10.1038/s41558-019-0613-7 [DOI] [Google Scholar]
- Tian, H. , Chen, G. , Liu, M. , Zhang, C. , Sun, G. , Lu, C. , Xu, X. , Ren, W. , Pan, S. , & Chappelka, A. (2010). Model estimates of net primary productivity, evapotranspiration, and water use efficiency in the terrestrial ecosystems of the southern United States during 1895–2007. Forest Ecology and Management, 259(7), 1311–1327. 10.1016/j.foreco.2009.10.009 [DOI] [Google Scholar]
- Tian, H. , Lu, C. , Chen, G. , Tao, B. , Pan, S. , Del Grosso, S. J. , Xu, X. , Bruhwiler, L. , Wofsy, S. C. , Kort, E. A. , & Prior, S. A. (2012). Contemporary and projected biogenic fluxes of methane and nitrous oxide in North American terrestrial ecosystems. Frontiers in Ecology and the Environment, 10(10), 528–536. 10.1890/120057 [DOI] [Google Scholar]
- Tian, H. , Xu, R. , Canadell, J. G. , Thompson, R. L. , Winiwarter, W. , Suntharalingam, P. , Davidson, E. A. , Ciais, P. , Jackson, R. B. , & Janssens‐Maenhout, G. (2020). A comprehensive quantification of global nitrous oxide sources and sinks. Nature, 586(7828), 248–256. [DOI] [PubMed] [Google Scholar]
- Tian, H. , Xu, X. , Liu, M. , Ren, W. , Zhang, C. , Chen, G. , & Lu, C. (2010). Spatial and temporal patterns of CH4 and N2O fluxes in terrestrial ecosystems of North America during 1979–2008: Application of a global biogeochemistry model. Biogeosciences, 7(9), 2673–2694. [Google Scholar]
- Tian, H. , Yang, J. , Lu, C. , Xu, R. , Canadell, J. G. , Jackson, R. B. , Arneth, A. , Chang, J. , Chen, G. , Ciais, P. , Gerber, S. , Ito, A. , Huang, Y. , Joos, F. , Lienert, S. , Messina, P. , Olin, S. , Pan, S. , Peng, C. , … Zhu, Q. (2018). The global N2O model intercomparison project. Bulletin of the American Meteorological Society, 99(6), 1231–1251. 10.1175/BAMS-D-17-0212.1 [DOI] [Google Scholar]
- Tian, H. , Yang, J. , Xu, R. , Lu, C. , Canadell, J. G. , Davidson, E. A. , Jackson, R. B. , Arneth, A. , Chang, J. , Ciais, P. , Gerber, S. , Ito, A. , Joos, F. , Lienert, S. , Messina, P. , Olin, S. , Pan, S. , Peng, C. , Saikawa, E. , … Zhang, B. (2019). Global soil nitrous oxide emissions since the preindustrial era estimated by an ensemble of terrestrial biosphere models: Magnitude, attribution, and uncertainty. Global Change Biology, 25(2), 640–659. 10.1111/gcb.14514 [DOI] [PubMed] [Google Scholar]
- Turner, P. A. , Griffis, T. J. , Lee, X. , Baker, J. M. , Venterea, R. T. , & Wood, J. D. (2015). Indirect nitrous oxide emissions from streams within the US Corn Belt scale with stream order. Proceedings of the National Academy of Sciences of the United States of America, 112(32), 9839–9843. 10.1073/pnas.1503598112 [DOI] [PMC free article] [PubMed] [Google Scholar]
- USDA‐ERS . (2019). U.S. Department of Agriculture‐Economic Research Service, Tailored Reports: Crop Production Practices. https://data.ers.usda.gov/reports.aspx?ID=17883
- Van Lent, J. , Hergoualc'h, K. , & Verchot, L. V. (2015). Reviews and syntheses: Soil N2O and NO emissions from land use and land‐use change in the tropics and subtropics: A meta‐analysis. Biogeosciences, 12(23), 7299–7313. 10.5194/bg-12-7299-2015 [DOI] [Google Scholar]
- Wagner‐Riddle, C. , Congreves, K. A. , Abalos, D. , Berg, A. A. , Brown, S. E. , Ambadan, J. T. , Gao, X. , & Tenuta, M. (2017). Globally important nitrous oxide emissions from croplands induced by freeze–thaw cycles. Nature Geoscience, 10(4), 279–283. 10.1038/ngeo2907 [DOI] [Google Scholar]
- Wei, Y. , Liu, S. , Huntzinger, D. N. , Michalak, A. M. , Viovy, N. , Post, W. M. , Schwalm, C. R. , Schaefer, K. , Jacobson, A. R. , Lu, C. , Tian, H. , Ricciuto, D. M. , Cook, R. B. , Mao, J. , & Shi, X. (2014). The North American carbon program multi‐scale synthesis and terrestrial model intercomparison project – part 2: Environmental driver data. Geoscientific Model Development, 7(6), 2875–2893. 10.5194/gmd-7-2875-2014 [DOI] [Google Scholar]
- Xiang, B. , Miller, S. M. , Kort, E. A. , Santoni, G. W. , Daube, B. C. , Commane, R. , Angevine, W. M. , Ryerson, T. B. , Trainer, M. K. , Andrews, A. E. , Nehrkorn, T. , Tian, H. , & Wofsy, S. C. (2013). Nitrous oxide (N2O) emissions from California based on 2010 CalNex airborne measurements. Journal of Geophysical Research Atmospheres, 118(7), 2809–2820. 10.1002/jgrd.50189 [DOI] [Google Scholar]
- Xu, R. , Tian, H. , Lu, C. , Pan, S. , Chen, J. , Yang, J. , & Zhang, B. (2017). Preindustrial nitrous oxide emissions from the land biosphere estimated by using a global biogeochemistry model. Climate of the Past, 13(7), 977–990. 10.5194/cp-13-977-2017 [DOI] [Google Scholar]
- Xu, X. F. , Tian, H. Q. , Chen, G. S. , Liu, M. L. , Ren, W. , Lu, C. Q. , & Zhang, C. (2012). Multifactor controls on terrestrial N2O flux over North America from 1979 through 2010. Biogeosciences, 9(4), 1351–1366. [Google Scholar]
- Yang, Q. , Tian, H. , Friedrichs, M. A. M. , Hopkinson, C. S. , Lu, C. , & Najjar, R. G. (2015). Increased nitrogen export from eastern North America to the Atlantic Ocean due to climatic and anthropogenic changes during 1901–2008. Journal of Geophysical Research: Biogeosciences, 120(6), 1046–1068. 10.1002/2014JG002763 [DOI] [Google Scholar]
- Yao, Y. , Tian, H. , Shi, H. , Pan, S. , Xu, R. , Pan, N. , & Canadell, J. G. (2020). Increased global nitrous oxide emissions from streams and rivers in the Anthropocene. Nature Climate Change, 10(2), 138–142. 10.1038/s41558-019-0665-8 [DOI] [Google Scholar]
- Yu, Z. , & Lu, C. (2018). Historical cropland expansion and abandonment in the continental US during 1850 to 2016. Global Ecology and Biogeography, 27(3), 322–333. 10.1111/geb.12697 [DOI] [Google Scholar]
- Yu, Z. , Lu, C. , Cao, P. , & Tian, H. (2018). Long‐term terrestrial carbon dynamics in the Midwestern United States during 1850–2015: Roles of land use and cover change and agricultural management. Global Change Biology, 24(6), 2673–2690. 10.1111/gcb.14074 [DOI] [PubMed] [Google Scholar]
- Yu, Z. , Lu, C. , Hennessy, D. A. , Feng, H. , & Tian, H. (2020). Impacts of tillage practices on soil carbon stocks in the US corn‐soybean cropping system during 1998 to 2016. Environmental Research Letters, 15(1), 14008. 10.1088/1748-9326/ab6393 [DOI] [Google Scholar]
- Yu, Z. , Lu, C. , Tian, H. , & Canadell, J. (2019). Largely underestimated carbon emission from land use and cover change in the conterminous U.S. Global Change Biology, 25(11), 3741–3752. 10.1111/gcb.14768 [DOI] [PubMed] [Google Scholar]
- Zhang, J. , Cao, P. , & Lu, C. (2021). Half‐century history of crop nitrogen use efficiency budget in the conterminous United States: Variations over time, space and crop types. Global Biogeochemical Cycles, 35(10). e2020GB006876. [Google Scholar]
Associated Data
This section collects any data citations, data availability statements, or supplementary materials included in this article.
Supplementary Materials
Supplementary Material
Data Availability Statement
The model estimates of annual soil N2O emissions across the United States at the resolution of 5 arc‐min by 5 arc‐min can be accessed at: https://doi.org/10.6084/m9.figshare.17207348.v1.