

Abstract
Background and Purpose
Airway remodelling is a critical feature of chronic lung diseases. Epithelial‐mesenchymal transition (EMT) represents an important source of myofibroblasts, contributing to airway remodelling. Here, we investigated the sphingosine‐1‐phosphate (S1P) role in EMT and its involvement in asthma‐related airway dysfunction.
Experimental Approach
A549 cells were used to assess the S1P effect on EMT and its interaction with TGF‐β signalling. To assess the S1P role in vivo and its impact on lung function, two experimental models of asthma were used by exposing BALB/c mice to subcutaneous administration of either S1P or ovalbumin (OVA).
Key Results
Following incubation with TGF‐β or S1P, A549 acquire a fibroblast‐like morphology associated with an increase of mesenchymal markers and down‐regulation of the epithelial. These effects are reversed by treatment with the TGF‐β receptor antagonist LY2109761. Systemic administration of S1P to BALB/c mice induces asthma‐like disease characterized by mucous cell metaplasia and increased levels of TGF‐β, IL‐33 and FGF‐2 within the lung. The bronchi harvested from S1P‐treated mice display bronchial hyperresponsiveness associated with overexpression of the mesenchymal and fibrosis markers and reduction of the epithelial.The S1P‐induced switch from the epithelial toward the mesenchymal pattern correlates to a significant increase of lung resistance and fibroblast activation. TGF‐β blockade, in S1P‐treated mice, abrogates these effects. Finally, inhibition of sphingosine kinases by SK1‐II in OVA‐sensitized mice, abrogates EMT, pulmonary TGF‐β up‐regulation, fibroblasts recruitment and airway hyperresponsiveness.
Conclusion and Implications
Targeting S1P/TGF‐β axis may hold promise as a feasible therapeutic target to control airway dysfunction in asthma.
Keywords: asthma, epithelial cells, lung function, sphingosine‐1‐phosphate
What is already known
EMT is recognized as a myofibroblast source contributing to airway remodelling.
S1P clinical relevance in asthma has been described both in the clinical and pre‐clinical setting.
What this study adds
S1P induces EMT characterized by a fibroproliferative environment within the lung.
The existence of a causal link between EMT and the asthma‐like features with a pivotal role of the S1P/TGF axis has been demonstrated.
What is the clinical significance
Targeting the S1P/TGF‐β axis may hold promise as a therapeutic target to control asthma features.
Abbreviations
- 2−ΔCt FN1
fibronectin 1
- AHR
airway hyperresponsiveness
- COL2A1
type I collagen
- COL3A1
type III collagen
- EMT
epithelial–mesenchymal transition
- OVA
ovalbumin
- RT‐PCR
quantitative real‐time polymerase chain reaction
- S1P
sphingosine‐1‐phosphate
- SPKs
sphingosine kinases
1. INTRODUCTION
Sphingosine 1‐phosphate (S1P) belongs to a class of potent bioactive molecules involved in a variety of cellular processes, including cell differentiation, proliferation and migration (Spiegel & Milstien, 2011). Its clinical relevance in lung diseases has been widely defined both in the clinical and preclinical setting (Ebenezer et al., 2016). Sphingosine phosphorylation, catalysed by sphingosine kinases (SPKs), significantly increases after allergen challenge or following exposure to cigarette smoke (Ammit et al., 2001; Oskeritzian et al., 2007; Rosenfeldt et al., 2003; Ryan & Spiegel, 2008). In animal models of asthma or mild chronic obstructive pulmonary disease, inhibition of S1P signalling reduces symptoms implying a key role for S1P in driving molecular mechanisms involved in pulmonary diseases (De Cunto et al., 2020; Price et al., 2013; Roviezzo et al., 2007; Tibboel et al., 2014; Tran et al., 2016). Systemic administration of S1P to mice, without any adjuvant addition, induces asthma‐like disease characterized by a time and dose‐dependent airway hyperresponsiveness and lung inflammation (Roviezzo et al., 2004, 2010, 2015; Sorrentino et al., 2014). These features are mediated by a concerted cellular activity, with an obligatory role for the Th2‐like adaptive immunity (Roviezzo et al., 2015). Elevated S1P levels have been also detected in patients with idiopathic pulmonary fibrosis (IPF). Microarray analysis of human peripheral blood mononuclear cells (PBMC) from IPF patients has shown a correlation among enzymes regulating synthesis or catabolism of S1P, pulmonary function and overall survival (Huang et al., 2015; Milara et al., 2012).
Airway dysfunction is a common denominator of chronic lung diseases. The airway epithelium constitutes the first barrier to the external environment and plays a key role in the protection of the internal milieu of the lung (Holgate, 2008). In this framework, the epithelial‐mesenchymal trophic unit ensures lung homeostasis (Lambrecht & Hammad, 2012; Schleimer et al., 2007). In pulmonary inflammatory‐based diseases, alteration of this homeostatic mechanism leads to changes in airway structure and in turn, lung function decline. This phenomenon is generally defined as airway remodelling. This includes subepithelial fibrosis, hyperplasia of myofibroblasts and myocytes and an increase in smooth muscle fibres (Al‐Muhsen et al., 2011; Jendzjowsky & Kelly, 2019). Pathogens, allergens, environmental pollutants and cigarette smoke trigger the production of mediators from epithelium promoting a remodelling involving the epithelial‐mesenchymal transition unit (EMTU; Aghapour et al., 2018; Bartis et al., 2014; Cardinale et al., 2013; Hiemstra et al., 2015; Holgate et al., 2000; Jeanne et al., 2019; Lambrecht & Hammad, 2014). These events cause down‐regulation of epithelial cell–cell adhesion and mesenchymal gene expression programs promotion providing the background for Th2‐biased lung inflammation. This interaction among structural changes, altered immunity and inflammation allows the persistence of chronic airway inflammation also in the absence of environmental stimuli (Jeanne et al., 2019; Wynn, 2008). Clinical studies have demonstrated a significant positive correlation between S1P levels and epithelial‐mesenchymal transition (EMT) in lung diseases (Huang et al., 2015; Milara et al., 2012).
Although sphingolipid synthesis represents a metabolic pathway influencing airway function in physiological and pathological conditions, the link between S1P, TGF‐β (TGFβ1; Stephen et al., 2017), EMT and the development of airway diseases has not been clearly defined yet. This is mainly due to the obvious technical and ethical difficulties (i.e., invasive techniques are required such as biopsy or segmental lung lavage) to address mechanistic issues in patients enrolled in a clinical study (Bartis et al., 2014). Besides, the sole measurement of S1P, or the activity of the enzymes involved in its synthesis and metabolism, does not allow the definition of the link between S1P‐induced effects on airways and lung dysfunction. Animal models mimicking features of human diseases are in this case instrumental to perform a reverse translational approach allowing to test in detail hypotheses stemming from clinical evidence. Here, we sought to investigate the contribution of S1P as an inducer of EMT through regulation of TGF‐β signalling in asthma‐features development. For this purpose, we have used two experimental models to evaluate the direct effect of S1P. The first was triggered by the administration of exogenous S1P as previously described (Roviezzo et al., 2015) and the second by ovalbumin by using BALB/c mice.
2. METHODS
2.1. Animals
Female BALB/c mice (8 weeks old; RRID:IMSR_ORNL: BALB/cRl) were purchased by Charles River (Lecco, Italy). The animals were housed in a controlled environment and provided with standard rodent chow and water. All animals were anaesthetized with isoflurane 3% before being humanely killed by CO2 euthanasia. The condition of death was confirmed by rigor mortis. All efforts were made to minimize the number of animals used and their suffering. Mice were randomized. Animal studies are reported in compliance with the ARRIVE guidelines (Percie du Sert et al., 2020) and with the recommendations made by the British Journal of Pharmacology (Lilley et al., 2020) in compliance with national (Direttiva 2010/63/UE) laws and policies and approved by the Italian Ministry of Health.
2.2. Antigen exposure and drug treatment
S1P EXPOSURE: Each experimental group consisted of six mice. Each mouse received a subcutaneous (s.c) injection of S1P (10 ng) dissolved in sterile saline containing bovine serum albumin (BSA 0.001%). S1P was administered at 0 and 7 days (Figure 3a) as previously described (Roviezzo et al., 2015). Mice were killed at day 14 or 21 for molecular and functional studies. In another set of experiments, mice were pretreated with the well‐known antagonist of receptor type I and II of TGF‐β (Flechsig et al., 2012; Melisi et al., 2008) LY2109761 (50 mg·kg−1) 15 min before S1P administration.
FIGURE 3.

Systemic administration of S1P induces a fibroproliferative environment within the lung. BALB/c mice received subcutaneous administration of S1P (10 ng) at days 0 and 7 (a). Mice were killed at 7, 14 and 21 days and bronchial reactivity was assessed (a) ***p < 0.001 vs. vehicle as assessed by two‐way ANOVA followed by Bonferroni post‐test. TGF‐β (b), IL‐33 (c) and FGF‐2 (d) were measured in lung homogenate. Data are expressed as mean ± SEM. **p < 0.01 vs. vehicle; ***p < 0.001 vs. vehicle as assessed by one‐way ANOVA followed by Tukey's multiple comparison test. Bronchi were harvested after 14 days from vehicle or S1P treated mice and a flow cytometry analysis (e) of CD326+ (epithelial marker) and CD90+ (mesenchymal marker) cells were performed. n = 6; data are expressed as mean ± SEM. **p < 0.01 vs. vehicle; ***p < 0.001 vs. vehicle as assessed by the Student's t‐test
OVALBUMIN SENSITIZATION: Each experimental group was consisted of six mice receiving a subcutaneous (s.c) injection of 0.4 ml of 100‐μg ovalbumin (OVA) absorbed to 3.3 mg of aluminium hydroxide gel in sterile saline on days 0 and 7 (Figure 8a). Mice were killed at day 14 or 21 for molecular and functional studies. In separate experiments, mice (n = 6) were pretreated with the sphingosine kinase inhibitor (SK1‐II, 3 mg·kg−1) before OVA sensitization.
FIGURE 8.

Sphingosine kinase blockade inhibits changes in airway hyperreactivity, EMT and TGF‐β triggered by OVA. Mice received subcutaneous (s.c) injection of 0.4 ml of 100‐μg ovalbumin (OVA) absorbed to 3.3 mg of aluminium hydroxide gel in sterile saline on days 0 and 7 (a). A group of mice were treated with SKI‐II (sphingosine kinases inhibitor; 3 mg/kg) prior to OVA challenge. Airway reactivity to carbachol was assessed at 21 days on isolated bronchi in vitro (b); ***p < 0.001 vs. vehicle. TGF‐β secretion (c) was measured at 14 days in lung homogenates by ELISA; ***p < 0.01 vs. vehicle assessed by one‐way ANOVA followed by Tukey's multiple comparison test. The epithelial marker CD326 (d) and the mesenchymal marker CD90 (d) were assessed in bronchi by using flow cytometry analysis. n = 6; data are expressed as mean ± SEM; *p < 0.05 and ***p < 0.001 vs. vehicle as assessed by one‐way ANOVA followed by Tukey's post‐test. Pulmonary fibroblasts were harvested from treated mice and their differentiation (e) was assessed as evident by light microscopy (panels A–C) and immunofluorescence analysis by using a monoclonal antibody against α‐SMA (Figure 8e, panels D–F)
2.3. Airway responsiveness
Main bronchi were placed in organ baths mounted to isometric force transducers (type 7006, Ugo Basile, Comerio, Italy) and connected to a Powerlab 800 (AD Instruments). Bronchial rings were challenged with carbachol (10–6 mol·L−1) until the response was reproducible. Once a reproducible response was achieved bronchial reactivity was assessed performing a cumulative concentration‐response curve to carbachol (1 × 10⁻⁸ to 3 × 10⁻⁵ mol·L−1).
Lungs were perfused in a non‐recirculating fashion through the pulmonary artery at a constant flow of 1 ml·min−1 resulting in a pulmonary artery pressure of 2‐ to 3‐cm H2O. The perfusion medium used was RPMI 1640 lacking phenol red (37°C). The lungs were ventilated by negative pressure (−3 and −9 cm H2O) with 90 breath per minute and a tidal volume of about 200 μl. Artificial thorax chamber pressure was measured with a differential pressure transducer (Validyne DP 45‐24) and airflow velocity with a pneumotachograph tube connected to a differential pressure transducer (Validyne DP 45‐15). The lungs respired humidified air. The arterial pressure was continuously monitored through a pressure transducer (Isotec Healthdyne). All data were transmitted to a computer and analysed with the Pulmodyn software (Hugo Sachs Elektronik, March Hugstetten, Germany). The data were analysed through the following formula: P = V·C − 1 + RL·dV·dt − 1, where P is chamber pressure, C pulmonary compliance, V tidal volume and RL airway resistance.
2.4. Elisa
TGF‐β was measured in lung homogenates according to the manufacturer's instructions (R&D). Briefly, lungs were isolated and digested with 1 U·ml−1 of collagenase. Cytokine level was expressed as pg·mg−1 of protein.
2.5. Immunohistochemistry
Left lung lobes harvested from mice were processed, and 7‐μm cryosections were obtained. Anti‐FGF2 (1:250) or anti‐IL‐33 (1:250) or isotype control anti‐rabbit IgG were used. The diamino‐benzidinic acid system was used to detect complexes and visualized using a Zeiss microscope (Germany).
2.6. Flow cytometry
Markers such as CD326 also known as an epithelial cell adhesion molecule (EpCAM) and mesenchymal marker such as CD90 were analysed using flow cytometry (Camerlingo et al., 2011). Main bronchi were excised in sterile conditions by using a digestive solution containing a mixture of collagenase, trypsin and hyaluronidase. After digestion, cell suspension was incubated with CD90 PE mouse and rat (Milteny iBiotec, Calderara di Reno, Bologna, Italy), CD326 APC mouse (Milteny iBiotec, Calderara di Reno, Bologna, Italy). After incubation, the samples were analysed by FACS AriaII (Becton Dickinson, Franklin Lakes, NJ, USA). All data were analysed by Diva 6.1 Software (Becton Dickinson, Franklin Lakes, NJ, USA).
2.7. Quantitative real‐time polymerase chain reaction
RNA was extracted from bronchi using PureZOL RNA isolation reagent (Bio‐Rad, Hercules, CA). RNA retro‐transcription was performed by using the High‐Capacity cDNA Reverse Transcription Kits (Applied Biosystems, Carlsbad, CA). Quantitative real‐time polymerase chain reaction (RT‐PCR) was performed with SYBR Green Real‐Time PCR Master Mix (ThermoFisher Scientific, Monza, Italy). The reactions were performed and analysed on CFX Connect Real‐Time PCR Detection System (Bio‐Rad, Hercules, CA). Data were calculated using the 2−ΔCt method. All the primers used, were designed by using PrimerBank (RRID:SCR_006898), a PCR primer database for quantitative gene expression analysis and then searched against an appropriate nucleotide sequence database using BLAST to examine the potential targets (RRID:SCR_001653). The primers designed were custom made by TEMA Ricerca SrL (Castenaso, Bologna, Italy). The primers used are summarized in Table 1.
TABLE 1.
List of genes screened by quantitative real‐time polymerase chain reaction
| Genes | NCBI ID | Primer sequences |
|---|---|---|
| mmALPHASMA | 11475 |
Forward: 5′‐GTCCCAGACATCAGGGAGTAA‐3′ Reverse: 5′‐TCGGATACTTCAGCGTCAGGA‐3′ |
| mmCOL2A1 | 12824 |
Forward: 5′‐CAGGATGCCCGAAAATTAGGG‐3′ Reverse: 5′‐ACCACGATCACCTCTGGGT‐3′ |
| mmCOL3A1 | 12825 |
Forward: 5′‐CTGTAACATGGAAACTGGGGAAA‐3′ Reverse: 5′‐CCATAGCTGAACTGAAAACCACC‐3′ |
| mmCYTOKERATIN | 16678 |
Forward: 5′‐GAGCAGATCAAGTCACTCAATGA‐3′ Reverse: 5′‐CCCATTTGGTTTGTAGCACCT‐3′ |
| mmE‐CADHERIN | 12550 |
Forward: 5′‐CAGGTCTCCTCATGGCTTTGC‐3′ Reverse: 5′‐CTTCCGAAAAGAAGGCTGTCC‐3′ |
| mmFIBRONECTIN | 14268 |
Forward: 5′‐ATGTGGACCCCTCCTGATAGT‐3′ Reverse: 5′‐GCCCAGTGATTTCAGCAAAGG‐3′ |
| mmGAPDH | 14433 |
Forward: 5′‐TGACCTCAACTACATGGTCTACA‐3′ Reverse: 5′‐CTTCCCATTCTCGGCCTTG‐3′ |
| mmSLUG | 20583 |
Forward: 5′‐TGGTCAAGAAACATTTCAACGCC‐3′ Reverse: 5′‐GGTGAGGATCTCTGGTTTTGGTA‐3′ |
| mmSNA1 | 20613 |
Forward: 5′‐AAACCCACTCGGATGTGAAG‐3′ Reverse: 5′‐GAAGGAGTCCTGGCAGTGAG‐3′ |
| mmTGFβ | 21803 |
Forward: 5′‐CTCCCGTGGCTTCTAGTGC‐3′ Reverse: 5′‐GCCTTAGTTTGGACAGGATCTG‐3′ |
| mmTWIST | 22160 |
Forward: 5′‐CCCCACTTTTTGACGAAGAA‐3′ Reverse: 5′‐CAGTTTGATCCCAGCGTTTT‐3′ |
| mmVIMENTIN | 22352 |
Forward: 5′‐CGTCCACACGCACCTACAG‐3′ Reverse: 5′‐GGGGGATGAGGAATAGAGGCT‐3′ |
2.8. In vitro experiments
A549 cells (RRID:CVCL_0023) were maintained under standard culture conditions. Cells were harvested at 80% confluence. Cells were treated in vitro with TGF‐β (2 ng·ml−1; AbCAM) or S1P (10−7 M) for 72 h in presence of the vehicle or incubated with LY2109761 (2 μM; n = 5 independent experiments). Morphology of the cells on phase‐contrast microscopy was examined. Cells were photographed at ×20 magnification.
2.9. Fibroblast culture
Mice were killed and the thorax was opened, and then the lungs were removed. Lungs were minced and incubated with DMEM containing 15% FCS. Cultures were replaced three times weekly. Pulmonary fibroblasts were harvested from mice treated as described above. All cultures were evaluated by immunohistochemistry to assess vimentin and all stained positively with vimentin. Morphology of the cells on phase‐contrast microscopy was examined. Cells were photographed at ×20 magnification. Fibroblast proliferation was assessed by the MTT (3‐[4,5‐dimethylthiazol‐2‐yl]‐2,5‐diphenyl tetrazolium bromide), colourimetric assay. Fibroblast differentiation was tested by a monoclonal antibody against α‐SMA (SigmaAldrich, Italy) or rabbit polyclonal antibody against vimentin (Santa Cruz, CA). For detection fluorescein‐labelled anti‐mouse IgG (ABNOVA, Italy) or Texas‐Red labelled anti‐rabbit IgG (ABNOVA, Italy) were used.
2.10. Immunofluorescence assay
Cells were plated in 24 well plates and fixed with 70% ethanol/0.1% Triton for 30 min at 4°C, treated with 5% BSA for 60 min at room temperature and then stained with primary antibodies at 4°C overnight anti‐mouse Cytokeratin (AbCAM) and anti‐mouse Vimentin (AbCAM). The secondary antibody, goat anti‐mouse FITC (AbCAM) was incubated for 60 min at 4°C, and the DAPI (Sigma, Milan, Italy) used to stain the nucleus, was incubated for 7 min at room temperature. Appropriate isotype control was used. Cells were observed under the fluorescence microscope (Zeiss, Milan, Italy). The Immuno‐related procedures used comply with the recommendations made by the British Journal of Pharmacology (Alexander et al., 2018).
2.11. Periodic acid/Alcian blue/Schiff (PAS) staining
Left lung lobes were fixed in OCT medium (Pella Inc., Milan, Italy) and 7‐μm cryosections were cut. The degree of inflammation was scored by blinded observers by using PAS staining (Sigma Aldrich, Milan Italy). PAS + cryosections were graded with scores 0 to 4 to describe low to severe lung inflammation as follows: 0: <5%; 1: 5–25%; 2: 25–50%; 3: 50–75%; 4: <75% positive staining/total lung area.
2.12. Statistical analysis
The data and statistical analysis comply with the recommendations of the British Journal of Pharmacology on experimental design and analysis in pharmacology (Curtis et al., 2018). The study was designed to generate groups of equal size, using randomisation and blinded analysis. Immunohistochemistry experiments also conform to BJP guidelines (Alexander et al., 2018). The number of experiments for each panel is n = 6. The RT PCR was performed with tissues harvested from six animals for each treatment; however, for the analysis, we have processed the samples put together in pairs and expressed them as media of the triplicates, due to limited sample availability. No statistical analysis was performed when the number of samples was below 5. Statistical analyses were performed using Prism 7 software (PRISM, RRID:SCR_005375,GraphPad Software; San Diego, CA). Data are expressed as mean ± SEM from at least 6 mice in each group. To determine differences between two groups, data were tested using unpaired and/or paired Student's t‐test. To determine differences between groups with multiple factors, data were tested using two‐way analysis of variance (ANOVA) followed by Bonferroni's test. For multiple group comparisons, normal data were compared via one‐way ANOVA with Tukey's post hoc test analysis when appropriate. Post‐hoc tests were conducted only if F in ANOVA achieved P<0.05 and there was no significant variance inhomogeneity. Statistical significance was defined as p < 0.05.
2.12.1. Materials
Sphingosine‐1‐phosphate (S1P) was purchased from Enzo Life Science, (USA Cat# BML‐SL140‐000). Sphingosine kinase inhibitor (SK1‐II) was purchased from Tocris (Cat# 2097). LY2109761 was purchased from Sigma Aldrich (Italy, Cat# SML2051). Periodic acid‐Schiff was purchased from Sigma Aldrich (St Louis, USA Cat # 395B‐1KT). TGF‐β was purchase by R&D (USA, Cat #DB100B). Anti‐actin alpha SMA from Sigma Aldrich (Cat # A5228). Anti‐IL33 was purchased from ThermoFisher (Italy Car# AF3626). Anti‐FGF2 was purchased from Santa Cruz Technology (USA Cat# sc‐74412). Diamino‐benzidinic acid system was purchased from Sigma Aldrich (Italy Cat# D3939). OCT medium was purchased from Tissue‐Tek OCT (Pella Inc. Italy, Cat # 27050). High‐capacity cDNA kit and SYBR Green Real‐Time PCR Master Mix were purchased from ThermoFisher Scientific (Monza, Italy Cat # 4368814 and 4385612). CD90 PE mouse/rat and CD326 APC mouse were purchase from a Milteny iBiotec (Bologna, Italy Cat# 130‐094‐528 and #130‐096‐417). TGF‐β1 protein (Cat #ab50036), anti‐wide spectrum Cytokeratin (Cat #ab9377), rabbit anti‐mouse, Vimentin (Cat # ab92547), goat anti‐mouse IgG H&L FITC GtxMu‐003‐D (Cat # ab96885594) and goat anti‐rabbit IgG H&L DyLight (Cat #ab96886) were purchased from AbCAM (Cambridge, UK). Other compounds (e.g., ovalbumin, DAPI, collagenase) were purchased from Sigma Aldrich (Italy).
2.12.2. Nomenclature of targets and ligands
Key protein targets and ligands in this article are hyperlinked to corresponding entries in http://www.guidetopharmacology.org and are permanently archived in the Concise Guide to PHARMACOLOGY 2021/22 (Alexander, Christopoulos et al., 2021; Alexander, Fabbro et al., 2021a,b).
3. RESULTS
3.1. TGF‐β is involved in S1P‐induce EMT
The role of S1P in EMT was evaluated by using A549 cells. Epithelial cells cultured in absence of TGF‐β maintained a classic cobblestone epithelial morphology and growth pattern (Figure 1a). A549 cells following incubation for 72 h with TGF‐β or S1P assumed elonged shape and many cells lost contact with their neighbour and displayed a spindle‐shape, acquiring a fibroblast‐like morphology. These effects were reversed by incubation of cells with TGF‐β receptor antagonist LY2109761 (Figure 1a). A549 cells exposed to S1P show also an up‐regulation of the mesenchymal marker CD90 and down‐regulation of the epithelial marker CD326 (Figure 1b). Incubation with LY2109761 before TGF‐β or S1P induces either CD90 up‐regulation or CD326 down‐regulation (Figure 1b). Consistent with this cell morphology and flow analysis, alteration in the expression and distribution of vimentin and cytokeratin has been confirmed by immunofluorescence assay (Figure 1c). Cytokeratins are keratin proteins found in the intracytoplasmic cytoskeleton of epithelial tissue that is essential for the structural integrity of bronchial epithelium, while vimentin is the major cytoskeletal component of mesenchymal cells. Immunofluorescence studies show that either S1P (Figure 1c, panels B and G) or TGF‐β (panels D and I) induce a down‐regulation of cytokeratin (Figure 1c, left panels) and up‐regulation of vimentin (Figure 1c, right panels) when compared to vehicle (panels A and F) and the cells acquire a fibroblast like morphology (panel G and I). Pretreatment of cells with LY2109761 before S1P (panels C and H) or TGF‐β (panels E and L) reverses both the down‐regulation of cytokeratin (left panels) and up‐regulation of vimentin (right panels) and the cells maintain their classic cobblestone epithelial morphology. This data was confirmed by colocalization staining of vimentin and α‐SMA (Figure 2). α‐SMA, an actin isoform of the vascular smooth muscle cell type, is thought to be one of the most useful markers for myofibroblast phenotype. Immunofluorescence staining was examined for the mesenchymal markers, α‐SMA (green fluorescence, Figure 2 A.III, B.III, C.III, D.III, E.III) and vimentin (red fluorescence, A.II, B.II, C.II, D.II, E.II), while in the right panels the co‐expression of markers (Figure 2 A.IV, B.IV, C.IV, D.IV, E.IV) were reported. As evident from merging experiments (Figure 2) both S1P and TGF‐β induced up‐regulation of vimentin and α‐SMA (Figure 2 panel B.II, B.III, C.II and C.III.) and the cells showed ultrastructural features of intracytoplasmic bundles of microfilaments, consistent with myofibroblast differentiation (B.IV and C.IV).
FIGURE 1.

S1P induces EMT in a TGF‐β dependent manner. A549 cells were exposed to vehicle, TGF‐β or S1P in the presence or absence of LY2109761 (TGF‐β antagonist of both type I and II receptors). Morphological changes were assessed by light microscopy ×10 magnification (a). A flow cytometry analysis of CD326+ (epithelial marker,) and CD90+ (mesenchymal marker) cells was performed. (b) Data are expressed as mean ± SEM as assessed by one‐way ANOVA followed by Tukey's multiple comparison test p < ***p < 0.001 vs. vehicle. ###p < 0.001 vs. S1P or TGF‐β. Immunofluorescence staining (c) was examined for the following markers: cytokeratin the epithelial marker (red fluorescence, left panels A–E) and vimentin the mesenchymal markers (green fluorescence, right panels F–L). Cells were photographed at ×20 magnification. The arrows in panels G and I indicate cells undergoing to mesenchymal transition displaying an increased staining for vimentin (green) and down regulation of cytokeratin. Panels A, C and E indicate the epithelial phenotype
FIGURE 2.

TGF‐β and S1P‐induce expression of mesenchymal markers. A549 cells were exposed to TGF‐β or S1P in the presence or absence of LY2109761 (TGF‐β antagonist of both types I and II receptors). Immunofluorescence staining was examined for the mesenchymal markers, α‐SMA (green fluorescence, A.III, B.III, C.III, D.III, E.III) and vimentin (red fluorescence, A.IV, B.IV, C.IV, D.IV, E.IV), in the right panels the co‐expression of markers (A.V, B.V, C.V, D.V, E.V). Nuclear DAPI staining (A.I, B.I, C.I, D.I, E.I). Cells were photographed at 40× magnification. The arrows indicate a single cell undergoing each staining performed, that is, DAPI or Vimentin or α‐SMA and the staining MERGE (column IV) for each treatment
3.2. S1P induces EMT in a fibroproliferative environment within the lung
Subcutaneous administration of S1P (Figure 3a) to mice induces a time and dose‐dependent airway hyperresponsiveness and lung inflammation (Roviezzo et al., 2004, 2010, 2015; Sorrentino et al., 2014). These features are mediated by a concerted cellular activity, with an obligatory role for the Th2‐like adaptive immunity. Lungs harvested from S1P‐treated mice display a time‐dependent increase within the lung of TGF‐β (Figure 3b), IL‐33 (Figure 3c) and FGF‐2 (Figure 3d). Concomitantly, bronchi harvested from S1P‐treated mice display a shift in the expression from an epithelial to a mesenchymal repertoire as confirmed by the two key markers analysed by flow cytometry (Figures 3e and S1). CD90, a mesenchymal marker, is only weakly expressed in bronchial tissues harvested from vehicle‐treated mice, as opposed to bronchi harvested from S1P‐treated mice. Conversely, the expression of CD326, an epithelial marker, is elevated in bronchi harvested from vehicle‐treated mice and decreases in those harvested from S1P‐treated mice (Figure 3e). These results are matched in the different morphology (Figure 4a) of fibroblasts isolated from lungs of vehicle or S1P treated mice. Besides, a significant increase also occurs in the proliferation rate in the fibroblasts harvested from S1P treated mice when compared to the vehicle (Figure 4b). As clearly visible in Figure 4c, a significant up‐regulation of α‐SMA occurs in fibroblasts harvested from S1P‐treated mice.
FIGURE 4.

Systemic administration of S1P primes pulmonary fibroblasts. Pulmonary fibroblasts were harvested from mice (n = 6) treated with either vehicle or S1P. Morphological changes were assessed by light microscopy ×10 magnification (a). Fibroblast proliferation was assessed by MTT assay (b). Data are expressed as mean ± SEM. **p < 0.01 vs. vehicle; ***p < 0.001 vs. vehicle as assessed by two‐way ANOVA followed by Bonferroni post‐test. Fibroblast differentiation was evaluated by immunofluorescence analysis by using a mouse monoclonal antibody against α‐SMA (c)
3.3. S1P shifts the epithelial‐mesenchymal repertoire in airways, which correlates well with the increase in lung resistance
EMT induction by S1P in vivo has been further analysed by RT‐PCR performed on bronchi harvested from both vehicle and S1P treated mice. The EMT regulators Twist and Snail (Figure 5a,b) increase at day 14 in S1P treated mice. Next, the expression of type I (COL2A1) and type III (COL3A1) collagens have been analysed as myofibroblast and EMT markers, respectively. The increase in mRNA levels of COL1A1 and COL3A1 genes (Figure 5c,d) correlate well to the development of asthma‐like features induced by S1P. To further define this phenomenon, we have measured other markers that have been previously identified as characteristic of either epithelial or mesenchymal cells (Thiery & Sleeman, 2006).
FIGURE 5.
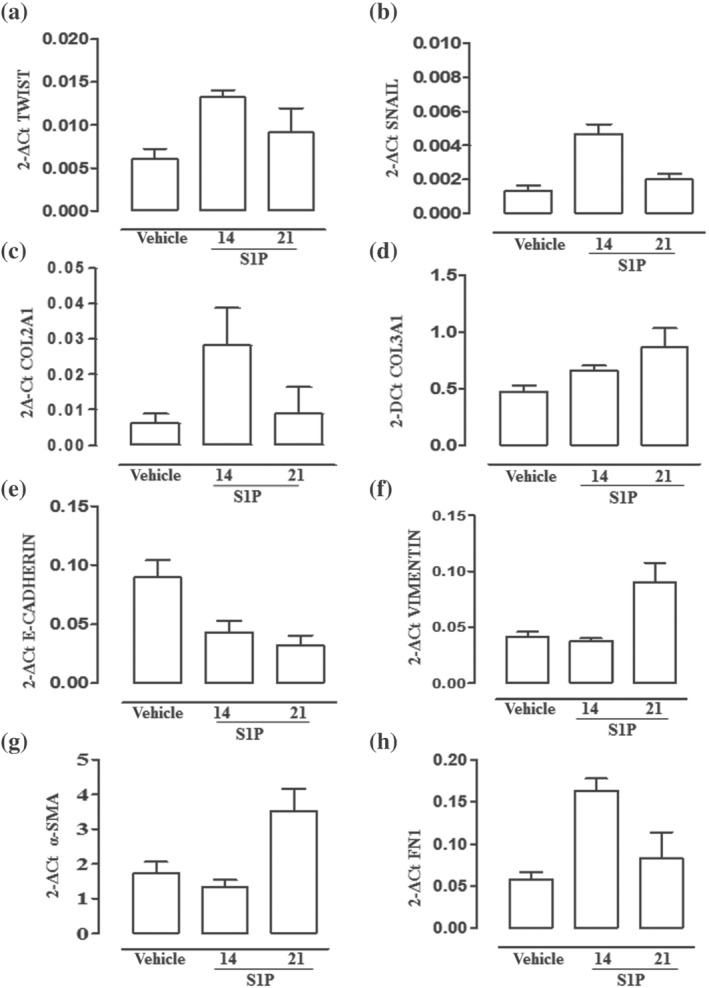
S1P promotes EMT in the bronchi. Bronchi were harvested from mice (n = 6) treated with vehicle or S1P and killed at 14 days. mRNA expression levels of TWIST (a), SNAIL 1 (b), COL2A1 (c) and COL3A1 (d) E‐cadherin (e), vimentin (f), alpha‐smooth muscle actin (α‐SMA) (g) and fibronectin 1 (h) were measured by quantitative reverse‐transcription polymerase chain reaction (qRT‐PCR) on samples put together in pairs and expressed as media of the triplicates. Data are expressed as mean ± SEM, and the results were normalized to glyceraldehyde‐3‐phosphate dehydrogenase (GAPDH) mRNA by using the 2−ΔCt formula. (exploratory data not subjected to statistical analysis)
Bronchi harvested from S1P treated mice show a significant decrease in the epithelial marker E‐cadherin (Figure 5e) in a time‐dependent manner. On the other hand, we observed a significant increase in the expression of mesenchymal markers such as vimentin (Figure 5f), alpha‐smooth muscle actin (α‐SMA) (Figure 5g) and fibronectin 1 (Figure 5h). The shift in the epithelial‐mesenchymal repertoire was associated with an increase in lung resistance in a time‐dependent manner (Figure 6a). Pearson correlation analysis was employed to analyse the correlation between lung resistance increase and EMT‐related transcription factors. The expression of E‐cadherin decreased with the increase of lung resistance (Figure 6b), and the expression level of COL3A1 was positively correlated with the increase in lung resistance content (Figure 6C). Thus, EMT also contributes to increasing lung resistance by promoting a remodelling process. This is confirmed by α‐SMA staining performed on lung sections, which clearly show an up‐regulation of α‐SMA around bronchi following S1P treatment (Figure 6d).
FIGURE 6.

S1P‐induced AHR is related to the increase of the pulmonary fibrosis degree. Mice received subcutaneous administration of S1P (10 ng) at days 0 and 7 (see Figure 1a). Lung resistances were measured at 7, 14 and 21 days (a). Data are expressed as mean ± SEM, **p < 0.01; ***p < 0.001 vs. vehicle as assessed by one‐way ANOVA followed by Bonferroni post‐test. Correlation between E‐cadherin or COL3A1 and lung resistance was evaluated. Pearson correlation analysis demonstrated that E‐cadherin (b) was negatively correlated with lung resistances (r = 0.9751) and COL3A1 (c) was positively correlated with lung resistances (r = 0.9955). α‐SMA was evaluated through immunohistochemistry (d). Blue arrows indicate α‐SMA+ myofibroblasts surrounding airways compared to the black arrows indicating smooth muscle cells, further highlighting the differential morphology of S1P‐treated vs. vehicle‐treated mice
3.4. The S1P/TGF‐β axis promotes asthma‐like features
To assess the contribution of TGF‐β signalling in the S1P‐induced effect also in vivo, S1P‐exposed mice were pretreated with LY2109761. TGF‐β blockade blunts the development of S1P‐induced AHR (Figure 7a) and mucus hyperproduction as determined by PAS staining (Figure 7b). Accordingly, the immunohistochemical analysis of pulmonary sections shows significant inhibition of S1P‐induced cell infiltration in mice treated with LY2109761(Figure 7c). To assess whether the inhibitory effects of LY2109761 on AHR and pulmonary metaplasia translates into a modulation of EMT, a FACS analysis was performed on the main bronchi. The data clearly show that LY2109761 reverses both CD90 up‐regulation and CD326 down‐regulation induced by S1P (Figure 7d).
FIGURE 7.

TGF‐β obligatory role for lung S1P‐induced effects in vivo. Mice were treated in vivo with the vehicle, S1P or LY2109761 + S1P. Reactivity to carbachol (a) was evaluated by using isolated bronchi. Data are expressed as mean ± SEM, ***p < 0.001 vs. vehicle as assessed by two‐way ANOVA followed by Bonferroni post‐test. The degree of inflammation was scored by blinded observers by using PAS staining (b). PAS‐positive cryosections were graded with scores 0 to 4 to describe low to severe lung inflammation as follows: 0: <5%; 1: 5–25%; 2: 25–50%; 3: 50–75%; 4: <75% PAS‐positive staining/total lung area. *p < 0.05 vs. vehicle as assessed by one‐way ANOVA followed by Tukey's post‐test. Representative H&E staining of the pulmonary sections photographed under light microscopy at ×10 magnification (c). Flow cytometry analysis (d) of CD326 (epithelial markers) and CD90 (mesenchymal markers) was performed on bronchi. n = 6; data are expressed as mean ± SEM, ***p < 0.001 vs. vehicle as assessed by one‐way ANOVA followed by Tukey's post‐test
3.5. Blocking of the S1P/TGF‐β axis blunts EMT and asthma features in OVA‐sensitized mice
S1P signalling is triggered during sensitization by different allergens. To further assess the relevance of the S1P/TGF‐β axis, we used the mouse model of OVA‐induced asthma features (Figure 8a). As shown in Figure 8b, pretreatment with SK1‐II abrogates OVA‐induced AHR evaluated as a contractile response to carbachol ex vivo at 21 days (Figure 8b) and TGF‐β expression at 14 days (Figure 8c). In addition, SK1‐II also inhibits EMT. Indeed, the flow cytometry analysis performed at 14 days on bronchi shows a clear up‐regulation of the mesenchymal marker CD90 coupled to a down‐regulation of the epithelial marker CD326 (Figure 8d) that is reversed by the pretreatment of mice in vivo with SK1‐II (Figure 8d). SK1‐II pretreatment also reverses OVA‐induced fibroblast differentiation in myofibroblasts as evident by light microscopy (Figure 8e panels A–C) and immunofluorescence analysis (Figure 8e, panels D–F).
4. DISCUSSION
EMT, as well as being necessary for homeostasis, has been recognized to play a key role in chronic respiratory diseases. TGF‐β is an essential mediator of fibrotic and remodelling responses in a variety of organs. Besides its role in regulating both Th17 and Treg activity, TGF‐β modulates lung tissue morphogenesis and differentiation (Bommireddy & Doetschman, 2007; van de Veen, 2017). Therefore, we sought to investigate if TGF‐β could act as a cytokine rheostat that mediates S1P effects within the lung. For this purpose, we have used the A549 cell line and two different experimental asthma models by exposing mice to S1P or to OVA. To get an insight into the role of TGF‐β in S1P effects in the lung, we first used A549 cells. Following exposure to either S1P or TGF‐β, A549 cells acquire a fibroblast‐like morphology characterized by an increase of the mesenchymal marker CD90 and a decrease in the epithelial CD326 expression. The immunofluorescence analysis confirms the presence of an epithelial transition characterized by an increase in vimentin‐positive staining and a reduction in cadherin. Thus, either S1P or TGF‐β causes a similar EMT profile in A549 cells. The experiments performed pretreating A549 cells with LY2109761, a well‐known antagonist of TGF‐β receptor type I and II, demonstrated that S1P‐induced EMT is dependent on TGF‐β as downstream signalling.
Following this evidence, we evaluated if this mechanism is also relevant in vivo. To this purpose, we used our previously characterized experimental model, where asthma‐like features are triggered by a systemic administration of S1P to BALB/c mice. In this model, S1P by itself, that is, without any adjuvant, promotes AHR, collagen deposition, and mucus secretion as well as an increase in serum IgE (Roviezzo et al., 2015). In these experimental conditions, we found in the early phase, after 7 days, a pulmonary profibrotic milieu characterized by a significant increase in TGF‐β expression. This finding is in line with the current clinical literature indicating TGF‐β as the early promotor of EMT (Willis & Borok, 2007; Yang et al., 2014). This fibrotic environment is further characterized by the increased expression of two other remodelling biomarkers of asthma severity such as FGF‐2 and IL‐33. FGF‐2 is required for pulmonary fibrosis and collagen production (Bossé et al., 2010), implying a possible synergic action with TGF‐β. IL‐33 acts as an endogenous “danger signal” (alarmin), alerting the immune system to damaged cells/tissues and promoting repair mechanisms. More recently IL‐33 has been defined as an unrelenting signal that, once induced, retains the lung in a state of lasting inflammation primed for exacerbations (Mitchell & O'Byrne, 2017; van de Veen, 2017). The flow cytometry analysis of the bronchi harvested from S1P‐challenged mice further confirmed the presence of a shift toward an epithelial‐mesenchymal pattern. Indeed, in bronchi harvested from S1P‐treated mice, there is an up‐regulation of the mesenchymal marker CD90 and a concomitant down‐regulation of the epithelial marker CD326. Accordingly, the two transcriptional regulators of EMT, namely, Twist and Snail, are up‐regulated. E‐cadherin, an epithelial marker, is down‐regulated while up‐regulation of the mesenchymal markers such as vimentin, fibronectin 1 and α‐smooth muscle actin occurs. Thus, this altered pattern favours a fibroproliferative environment as also demonstrated by the significant increase in the expression of type I and type III collagens.
Therefore, S1P administration in vivo triggers epithelial plasticity creating a primed environment responsible for progressive airway dysfunction and submucosal fibrosis. These data fit well with the clinical evidence showing that in patients with inflammatory chronic respiratory diseases there is a significant increase of the S1P level that correlates changes in lung function and EMT (Huang et al., 2015; Milara et al., 2012).
In the S1P model, the molecular data were confirmed by the structural changes observed in bronchi. Indeed, the histological analysis shows an increase in myofibroblasts around bronchi as confirmed by α‐SMA evaluation through immunohistochemistry, suggesting a functional impact of EMT on lung function. Indeed, myofibroblasts harvested from S1P‐treated mice showed a significantly elevated proliferation and differentiation rate ex vivo. All these features translate in vivo in a significant increase in lung resistance. S1P‐treated mice develop AHR in a time‐dependent manner and this functional change correlates well with the EMT markers such as cadherin and collagen.
To confirm the obligatory role of TGF‐β in the S1P‐induced effect already observed in A549 cells, we treated mice with the TGF‐β antagonist before the S1P challenge. LY2109761 treatment reduced EMT, airway hyperresponsiveness and pulmonary metaplasia induced by S1P. Thus, the activation of the S1P/TGF‐β axis is also essential to promote S1P‐induced EMT in vivo.
S1P acts through different subtypes of receptors that are widely expressed in the lung. A limitation of this study was the difficulty to define the specific role of each of them. However, the contribution of S1P receptors in lung disease is confirmed by data obtained so far with FTY720, which binds to all S1P receptors except S1P2. Treatment with FTY720 suppressed both Th1‐ and Th2‐driven lung inflammation. FTY720 also inhibited the OVA‐induced AHR (Sawicka et al., 2003) and EMT in human lung cancer cells (Liu et al., 2014).
However, all the data so far discussed have been obtained either in vitro or in vivo by using S1P or TGF‐β as exogenous signals. To further confirm the role of the S1P/TGF‐β axis in asthma‐associated EMT and to define the therapeutic relevance of this axis, we used an allergen‐induced asthma model that shares several features of asthmatic patients. We and others have demonstrated that OVA‐sensitization triggers S1P signalling that participates in the molecular mechanisms underlying AHR and lung inflammation. Pretreatment with an inhibitor of sphingosine kinase, SK1‐II, of OVA‐sensitized mice caused a reduction of the bronchial hyperreactivity ex vivo of isolated bronchi as well as of the TGF‐β expression. In addition, bronchi, collected from OVA‐sensitized mice, display morphological alterations typical of EMT such as down‐regulation of the epithelial marker CD326 and up‐regulation of mesenchymal markers CD90. Treatment of mice with SK1‐II, also prevents changes in epithelial and mesenchymal markers and as well blunts fibroblast differentiation.
In conclusion, our study provides direct evidence for a crosstalk between the SPK/S1P and TGF‐β pathways in airways in vivo. Thus, targeting the S1P/TGF‐β axis may hold promise as a feasible therapeutic target to prevent lung dysfunction in pulmonary disease associated with EMT such as asthma.
AUTHOR CONTRIBUTIONS
Conception and design: MR, FR and GC. Data acquisition and analysis: IC, BR, AB, RC, GR, MT, GS, RS, SC, EG. Article drafting/revision: BD, FR and GC. Final approval: all authors.
CONFLICT OF INTEREST
The authors have no conflict of interest to disclose.
DECLARATION OF TRANSPARENCY AND SCIENTIFIC RIGOUR
This Declaration acknowledges that this paper adheres to the principles for transparent reporting and scientific rigour of preclinical research as stated in the BJP guidelines.
Supporting information
Figure S1. Cytometric analysis of EMT markers: a. the gate strategy on Bronchi tissues analyzed, to identify the CD45 negative and live cells. b. isotype control on Vehicle (I) and S1P (II) on treated mouse. c. CD326 and CD90 expression on Vehicle (III) and S1P (IV) on treated mouse
ACKNOWLEDGEMENT
This work was supported by grants from Program of research funding from the Fund provided for by the 2017 Budget Law (ANVUR). Open Access Funding provided by Universita degli Studi di Napoli Federico II within the CRUI‐CARE Agreement. [Correction added on 17 May 2022, after first online publication: CRUI funding statement has been added.]
Riemma, M. A. , Cerqua, I. , Romano, B. , Irollo, E. , Bertolino, A. , Camerlingo, R. , Granato, E. , Rea, G. , Scala, S. , Terlizzi, M. , Spaziano, G. , Sorrentino, R. , D'Agostino, B. , Roviezzo, F. , & Cirino, G. (2022). Sphingosine‐1‐phosphate/TGF‐β axis drives epithelial mesenchymal transition in asthma‐like disease. British Journal of Pharmacology, 179(8), 1753–1768. 10.1111/bph.15754
Maria A. Riemma and Ida Cerqua contributed equally to this work.
DATA AVAILABILITY STATEMENT
The data that support the findings of this study are available from the corresponding author upon reasonable request.
REFERENCES
- Aghapour, M. , Raee, P. , Moghaddam, S. J. , Hiemstra, P. S. , & Heijink, I. H. (2018). Airway epithelial barrier dysfunction in chronic obstructive pulmonary disease: Role of cigarette smoke exposure. American Journal of Respiratory Cell and Molecular Biology, 58(2), 157–169. 10.1165/rcmb.2017-0200TR [DOI] [PubMed] [Google Scholar]
- Alexander, S. P. , Fabbro, D. , Kelly, E. , Mathie, A. , Peters, J. A. , Veale, E. L. , Armstrong, J. F. , Faccenda, E. , Harding, S. D. , Pawson, A. J. , Southan, C. , Davies, J. A. , Beuve, A. , Brouckaert, P. , Bryant, C. , Burnett, J. C. , Farndale, R. W. , Friebe, A. , Garthwaite, J. , … Waldman, S. A. (2021a). The Concise Guide to PHARMACOLOGY 2021/22: Catalytic receptors. British Journal of Pharmacology, 178(S1), S264–S312. 10.1111/bph.15541 [DOI] [PubMed] [Google Scholar]
- Alexander, S. P. , Fabbro, D. , Kelly, E. , Mathie, A. , Peters, J. A. , Veale, E. L. , Armstrong, J. F. , Faccenda, E. , Harding, S. D. , Pawson, A. J. , Southan, C. , Davies, J. A. , Boison, D. , Burns, K. E. , Dessauer, C. , Gertsch, J. , Helsby, N. A. , Izzo, A. A. , Koesling, D. , … Wong, S. S. (2021b). The Concise Guide to PHARMACOLOGY 2021/22: Enzymes. British Journal of Pharmacology, 178(S1), S313–S411. 10.1111/bph.15542 [DOI] [PubMed] [Google Scholar]
- Alexander, S. P. H. , Christopoulos, A. , Davenport, A. P. , Kelly, E. , Mathie, A. , Peters, J. A. , Veale, E. L. , Armstrong, J. F. , Faccenda, E. , Harding, S. D. , Pawson, A. J. , Southan, C. , Davies, J. A. , Abbracchio, M. P. , Alexander, W. , Al‐Hosaini, K. , Bäck, M. , Barnes, N. M. , Bathgate, R. , … Ye, R. D. (2021). The Concise Guide to PHARMACOLOGY 2021/22: G protein‐coupled receptors. British Journal of Pharmacology, 178(Suppl 1), S27–S156. [DOI] [PubMed] [Google Scholar]
- Alexander, S. P. H. , Roberts, R. E. , Broughton, B. R. S. , Sobey, C. G. , George, C. H. , Stanford, S. C. , Cirino, G. , Docherty, J. R. , Giembycz, M. A. , Hoyer, D. , Insel, P. A. , Izzo, A. A. , Ji, Y. , MacEwan, D. J. , Mangum, J. , Wonnacott, S. , & Ahluwalia, A. (2018). Goals and practicalities of immunoblotting and immunohistochemistry: A guide for submission to the British Journal of Pharmacology. British Journal of Pharmacology, 175, 407–411. 10.1111/bph.14112 [DOI] [PMC free article] [PubMed] [Google Scholar]
- Al‐Muhsen, S. , Johnson, J. R. , & Hamid, Q. (2011). Remodeling in asthma. The Journal of Allergy and Clinical Immunology, 128(3), 451–462. 10.1016/j.jaci.2011.04.047 [DOI] [PubMed] [Google Scholar]
- Ammit, A. J. , Hastie, A. T. , Edsall, L. C. , Hoffman, R. K. , Amrani, Y. , Krymskaya, V. P. , Kane, S. A. , Peters, S. P. , Penn, R. B. , Spiegel, S. , & Panettieri, R. A. Jr. (2001). Sphingosine 1‐phosphate modulates human airway smooth muscle cell functions that promote inflammation and airway remodeling in asthma. The FASEB Journal, 15(7), 1212–1214. 10.1096/fj.00-0742fje [DOI] [PubMed] [Google Scholar]
- Bartis, D. , Mise, N. , Mahida, R. Y. , Eickelberg, O. , & Thickett, D. R. (2014). Epithelial‐mesenchymal transition in lung development and disease: Does it exist and is it important? Thorax, 69(8), 760–765. 10.1136/thoraxjnl-2013-204608 [DOI] [PubMed] [Google Scholar]
- Bommireddy, R. , & Doetschman, T. (2007). TGFβ1 and Treg cells: Alliance for tolerance. Trends in Molecular Medicine, 13(11), 492–501. 10.1016/j.molmed.2007.08.005 [DOI] [PMC free article] [PubMed] [Google Scholar]
- Bossé, Y. , Stankova, J. , & Rola‐Pleszczynski, M. (2010). Transforming growth factor‐beta1 in asthmatic airway smooth muscle enlargement: Is fibroblast growth factor‐2 required? Clinical and Experimental Allergy, 40(5), 710–724. 10.1111/j.1365-2222.2010.03497.x [DOI] [PubMed] [Google Scholar]
- Camerlingo, R. , Franco, R. , Tirino, V. , Cantile, M. , Rocchi, M. , La Rocca, A. , Martucci, N. , Botti, G. , Rocco, G. , & Pirozzi, G. (2011). Establishment and phenotypic characterization of the first human pulmonary blastoma cell line. Lung Cancer, 72(1), 23–31. 10.1016/j.lungcan.2010.07.009 [DOI] [PubMed] [Google Scholar]
- Cardinale, F. , Giordano, P. , Chinellato, I. , & Tesse, R. (2013). Respiratory epithelial imbalances in asthma pathophysiology. Allergy and Asthma Proceedings, 34(2), 143–149. 10.2500/aap.2013.34.3631 [DOI] [PubMed] [Google Scholar]
- Curtis, M. J. , Alexander, S. , Cirino, G. , Docherty, J. R. , George, C. H. , Giembycz, M. A. , Hoyer, D. , Insel, P. A. , Izzo, A. A. , Ji, Y. , MacEwan, D. J. , Sobey, C. G. , Stanford, S. C. , Teixeira, M. M. , Wonnacott, S. , & Ahluwalia, A. (2018). Experimental design and analysis and their reporting II: Updated and simplified guidance for authors and peer reviewers. British Journal of Pharmacology, 175, 987–993. 10.1111/bph.14153 [DOI] [PMC free article] [PubMed] [Google Scholar]
- De Cunto, G. , Brancaleone, V. , Riemma, M. A. , Cerqua, I. , Vellecco, V. , Spaziano, G. , Cavarra, E. , Bartalesi, B. , D'Agostino, B. , Lungarella, G. , Cirino, G. , Lucattelli, M. , & Roviezzo, F. (2020). Functional contribution of sphingosine‐1‐phosphate to airway pathology in cigarette smoke‐exposed mice. British Journal of Pharmacology, 177(2), 267–281. 10.1111/bph.14861 [DOI] [PMC free article] [PubMed] [Google Scholar]
- Ebenezer, D. L. , Fu, P. , & Natarajan, V. (2016). Targeting sphingosine‐1‐phosphate signaling in lung diseases. Pharmacology & Therapeutics, 168, 143–157. 10.1016/j.pharmthera.2016.09.008 [DOI] [PMC free article] [PubMed] [Google Scholar]
- Flechsig, P. , Dadrich, M. , Bickelhaupt, S. , Jenne, J. , Hauser, K. , Timke, C. , Peschke, P. , Hahn, E. W. , Gröne, H. J. , Yingling, J. , Lahn, M. , Wirkner, U. , & Huber, P. E. (2012). LY2109761 attenuates radiation‐induced pulmonary murine fibrosis via reversal of TGF‐β and BMP‐associated proinflammatory and proangiogenic signals. Clinical Cancer Research, 18(13), 3616–3627. 10.1158/1078-0432.CCR-11-2855 [DOI] [PubMed] [Google Scholar]
- Hiemstra, P. S. , Mccray, P. B. Jr. , & Bals, R. (2015). The innate immune function of airway epithelial cells in inflammatory lung disease. The European Respiratory Journal, 45(4), 1150–1162. 10.1183/09031936.00141514 [DOI] [PMC free article] [PubMed] [Google Scholar]
- Holgate, S. T. (2008). The airway epithelium is central to the pathogenesis of asthma. Allergology International, 57(1), 1–10. 10.2332/allergolint.R-07-154 [DOI] [PubMed] [Google Scholar]
- Holgate, S. T. , Davies, D. E. , Lackie, P. M. , Wilson, S. J. , Puddicombe, S. M. , & Lordan, J. L. (2000). Epithelial‐mesenchymal interactions in the pathogenesis of asthma. The Journal of Allergy and Clinical Immunology, 105(2 Pt 1), 193–204. 10.1016/S0091-6749(00)90066-6 [DOI] [PubMed] [Google Scholar]
- Huang, L. S. , Berdyshev, E. V. , Tran, J. T. , Xie, L. , Chen, J. , Ebenezer, D. L. , Mathew, B. , Gorshkova, I. , Zhang, W. , Reddy, S. P. , Harijith, A. , Wang, G. , Feghali‐Bostwick, C. , Noth, I. , Ma, S. F. , Zhou, T. , Ma, W. , Garcia, J. G. , & Natarajan, V. (2015). Sphingosine‐1‐phosphate lyase is an endogenous suppressor of pulmonary fibrosis: Role of S1P signalling and autophagy. Thorax, 70(12), 1138–1148. 10.1136/thoraxjnl-2014-206684 [DOI] [PubMed] [Google Scholar]
- Jeanne, A. , George, S. , Wei, K. L. , Dylan, B. , Jonas, S. E. , Caroline, S. , Li‐Hong, B. , Amit, A. , Navneet, K. , Jee, H. K. , Vishal, K. , Wen, F. , Tammy, H. , Neil, S. , George, D. Y. , Andrew, J. M. , Matthew, A. S. , & Jamie, M. O. (2019). IL‐33 blockade affects mediators of persistence and exacerbation in a model of chronic airway inflammation. The Journal of Allergy and Clinical Immunology, 144(6), 1624–1637. [DOI] [PubMed] [Google Scholar]
- Jendzjowsky, N. G. , & Kelly, M. M. (2019). The role of airway myofibroblasts in asthma. Chest, 156(6), 1254–1267. 10.1016/j.chest.2019.08.1917 [DOI] [PubMed] [Google Scholar]
- Lambrecht, B. N. , & Hammad, H. (2012). The airway epithelium in asthma. Nature Medicine, 18(5), 684–692. 10.1038/nm.2737 [DOI] [PubMed] [Google Scholar]
- Lambrecht, B. N. , & Hammad, H. (2014). Allergens and the airway epithelium response: Gateway to allergic sensitization. The Journal of Allergy and Clinical Immunology, 134(3), 499–507. 10.1016/j.jaci.2014.06.036 [DOI] [PubMed] [Google Scholar]
- Lilley E., Stanford S. C., Kendall D. E., Alexander S. P.H., Cirino G., Docherty J. R., George C. H., Insel P. A., Izzo A. A., Ji Y., Panettieri R. A., Sobey C. G., Stefanska B., Stephens G., Teixeira M., Ahluwalia A. (2020). ARRIVE 2.0 and the British Journal of Pharmacology: Updated guidance for 2020. British Journal of Pharmacology, 177(16), 3611–3616. 10.1111/bph.15178 [DOI] [PMC free article] [PubMed] [Google Scholar]
- Liu, H. , Gu, Y. , Yin, J. , Zheng, G. , Wang, C. , Zhang, Z. , Deng, M. , Liu, J. , Jia, X. , & He, Z. (2014). SET‐mediated NDRG1 inhibition is involved in acquisition of epithelial‐to‐mesenchymal transition phenotype and cisplatin resistance in human lung cancer cell. Cellular Signalling, 26(12), 2710–2720. 10.1016/j.cellsig.2014.08.010 [DOI] [PubMed] [Google Scholar]
- Melisi, D. , Ishiyama, S. , Sclabas, G. M. , Fleming, J. B. , Xia, Q. , Tortora, G. , Abbruzzese, J. L. , & Chiao, P. J. (2008). LY2109761, a novel transforming growth factor beta receptor type I and type II dual inhibitor, as a therapeutic approach to suppressing pancreatic cancer metastasis. Molecular Cancer Therapeutics, 7(4), 829–840. 10.1158/1535-7163.MCT-07-0337 [DOI] [PMC free article] [PubMed] [Google Scholar]
- Milara, J. , Navarro, R. , Juan, G. , Peiró, T. , Serrano, A. , Ramón, M. , Morcillo, E. , & Cortijo, J. (2012). Sphingosine‐1‐phosphate is increased in patients with idiopathic pulmonary fibrosis and mediates epithelial to mesenchymal transition. Thorax, 67(2), 147–156. 10.1136/thoraxjnl-2011-200026 [DOI] [PubMed] [Google Scholar]
- Mitchell, P. D. , & O'Byrne, P. M. (2017). Epithelial‐derived cytokines in asthma. Chest, 151(6), 1338–1344. 10.1016/j.chest.2016.10.042 [DOI] [PubMed] [Google Scholar]
- Oskeritzian, C. A. , Milstien, S. , & Spiegel, S. (2007). Sphingosine‐1‐phosphate in allergic responses, asthma and anaphylaxis. Pharmacology & Therapeutics, 115(3), 390–399. 10.1016/j.pharmthera.2007.05.011 [DOI] [PMC free article] [PubMed] [Google Scholar]
- Percie du Sert, N. , Hurst, V. , Ahluwalia, A. , Alam, S. , Avey, M. T. , Baker, M. , Browne, W. J. , Clark, A. , Cuthill, I. C. , Dirnagl, U. , Emerson, M. , Garner, P. , Holgate, S. T. , Howells, D. W. , Karp, N. A. , Lazic, S. E. , Lidster, K. , MacCallum, C. J. , Macleod, M. , … Würbel, H. (2020). The ARRIVE guidelines 2.0: updated guidelines for reporting animal research. PLoS Biol, 18, e3000410. 10.1371/journal.pbio.3000410 [DOI] [PMC free article] [PubMed] [Google Scholar]
- Price, M. M. , Oskeritzian, C. A. , Falanga, Y. T. , Harikumar, K. B. , Allegood, J. C. , Alvarez, S. E. , Conrad, D. , Ryan, J. J. , Milstien, S. , & Spiegel, S. (2013). A specific sphingosine kinase 1 inhibitor attenuates airway hyperresponsiveness and inflammation in a mast cell‐dependent murine model of allergic asthma. The Journal of Allergy and Clinical Immunology, 131(2), 501–511. 10.1016/j.jaci.2012.07.014 [DOI] [PMC free article] [PubMed] [Google Scholar]
- Rosenfeldt, H. M. , Amrani, Y. , Watterson, K. R. , Murthy, K. S. , Panettieri, R. A. Jr. , & Spiegel, S. (2003). Sphingosine‐1‐phosphate stimulates contraction of human airway smooth muscle cells. The FASEB Journal, 17(13), 1789–1799. 10.1096/fj.02-0836com [DOI] [PubMed] [Google Scholar]
- Roviezzo, F. , D'Agostino, B. , Brancaleone, V. , De Gruttola, L. , Bucci, M. , De Dominicis, G. , Orlotti, D. , D'Aiuto, E. , De Palma, R. , Rossi, F. , Sorrentino, R. , & Cirino, G. (2010). Systemic administration of sphingosine‐1‐phosphate increases bronchial hyperresponsiveness in the mouse. American Journal of Respiratory Cell and Molecular Biology, 42(5), 572–577. 10.1165/rcmb.2009-0108OC [DOI] [PubMed] [Google Scholar]
- Roviezzo, F. , Del Galdo, F. , Abbate, G. , Bucci, M. , D'Agostino, B. , Antunes, E. , De Dominicis, G. , Parente, L. , Rossi, F. , Cirino, G. , & De Palma, R. (2004). Human eosinophil chemotaxis and selective in vivo recruitment by sphingosine 1‐phosphate. Proceedings of the National Academy of Sciences of the United States of America, 101(30), 11170–11175. 10.1073/pnas.0401439101 [DOI] [PMC free article] [PubMed] [Google Scholar]
- Roviezzo, F. , Di Lorenzo, A. , Bucci, M. , Brancaleone, V. , Vellecco, V. , De Nardo, M. , Orlotti, D. , De Palma, R. , Rossi, F. , D'Agostino, B. , & Cirino, G. (2007). Sphingosine‐1‐phosphate/sphingosine kinase pathway is involved in mouse airway hyperresponsiveness. American Journal of Respiratory Cell and Molecular Biology, 36(6), 757–762. 10.1165/rcmb.2006-0383OC [DOI] [PubMed] [Google Scholar]
- Roviezzo, F. , Sorrentino, R. , Bertolino, A. , De Gruttola, L. , Terlizzi, M. , Pinto, A. , Napolitano, M. , Castello, G. , D'Agostino, B. , Ianaro, A. , Sorrentino, R. , & Cirino, G. (2015). S1P‐induced airway smooth muscle hyperresponsiveness and lung inflammation in vivo: Molecular and cellular mechanisms. British Journal of Pharmacology, 172(7), 1882–1893. 10.1111/bph.13033 [DOI] [PMC free article] [PubMed] [Google Scholar]
- Ryan, J. J. , & Spiegel, S. (2008). The role of sphingosine‐1‐phosphate and its receptors in asthma. Drug News & Perspectives, 21(2), 89–96. 10.1358/dnp.2008.21.2.1188195 [DOI] [PMC free article] [PubMed] [Google Scholar]
- Sawicka, E. , Zuany‐Amorim, C. , Manlius, C. , Trifilieff, A. , Brinkmann, V. , Kemeny, D. M. , & Walker, C. (2003). Inhibition of Th1‐ and Th2‐mediated airway inflammation by the sphingosine 1‐phosphate receptor agonist FTY720. Journal of Immunology, 171(11), 6206–6214. 10.4049/jimmunol.171.11.6206 [DOI] [PubMed] [Google Scholar]
- Schleimer, R. P. , Kato, A. , Kern, R. , Kuperman, D. , & Avila, P. C. (2007). Epithelium: At the interface of innate and adaptive immune responses. The Journal of Allergy and Clinical Immunology, 120(6), 1279–1284. 10.1016/j.jaci.2007.08.046 [DOI] [PMC free article] [PubMed] [Google Scholar]
- Sorrentino, R. , Bertolino, A. , Terlizzi, M. , Iacono, V. M. , Maiolino, P. , Cirino, G. , Roviezzo, F. , & Pinto, A. (2014). B cell depletion increases Sphingosine‐1‐phosphate‐dependent airway inflammation in mice. American Journal of Respiratory Cell and Molecular Biology, 52(5), 571–583. [DOI] [PubMed] [Google Scholar]
- Spiegel, S. , & Milstien, S. (2011). The outs and the ins of sphingosine‐1‐phosphate in immunity. Nature Reviews. Immunology, 11(6), 403–415. 10.1038/nri2974 [DOI] [PMC free article] [PubMed] [Google Scholar]
- Stephen, P. H. , Fabbro, A. D. , Kelly, E. , Marrion, N. V. , Peters, J. A. , Faccenda, E. , Harding, S. D. , Pawson, A. J. , Sharman, J. L. , & Southan, C. (2017). The Concise Guide to PHARMACOLOGY 2017/18: Catalytic receptors. British Journal of Pharmacology, 174, S225–S271. [DOI] [PMC free article] [PubMed] [Google Scholar]
- Thiery, J. P. , & Sleeman, J. P. (2006). Complex networks orchestrate epithelial‐mesenchymal transitions. Nature Reviews. Molecular Cell Biology, 7(2), 131–142. 10.1038/nrm1835 [DOI] [PubMed] [Google Scholar]
- Tibboel, J. , Reiss, I. , de Jongste, J. C. , & Post, M. (2014). Sphingolipids in lung growth and repair. Chest, 145(1), 120–128. 10.1378/chest.13-0967 [DOI] [PubMed] [Google Scholar]
- Tran, H. B. , Barnawi, J. , Ween, M. , Hamon, R. , Roscioli, E. , Hodge, G. , Reynolds, P. N. , Pitson, S. M. , Davies, L. T. , Haberberger, R. , & Hodge, S. (2016). Cigarette smoke inhibits efferocytosis via deregulation of phingosine kinase signaling: Reversal with exogenous S1P and the S1P analogue FTY720. Journal of Leukocyte Biology, 100(1), 195–202. 10.1189/jlb.3A1015-471R [DOI] [PubMed] [Google Scholar]
- van de Veen, W. (2017). The role of regulatory B cells in allergen immunotherapy. Current Opinion in Allergy and Clinical Immunology, 17(6), 447–452. 10.1097/ACI.0000000000000400 [DOI] [PubMed] [Google Scholar]
- Willis, B. C. , & Borok, Z. (2007). TGF‐beta‐induced EMT: Mechanisms and implications for fibrotic lung disease. American Journal of Physiology. Lung Cellular and Molecular Physiology, 293(3), L525–L534. 10.1152/ajplung.00163.2007 [DOI] [PubMed] [Google Scholar]
- Wynn, T. A. (2008). Cellular and molecular mechanisms of fibrosis. The Journal of Pathology, 214(2), 199–210. 10.1002/path.2277 [DOI] [PMC free article] [PubMed] [Google Scholar]
- Yang, Y. , Zhang, N. , Lan, F. , Van Crombruggen, K. , Fang, L. , Hu, G. , Hong, S. , & Bachert, C. (2014). Transforming growth factor‐beta 1 pathways in inflammatory airway diseases. Allergy, 69(6), 699–707. 10.1111/all.12403 [DOI] [PubMed] [Google Scholar]
Associated Data
This section collects any data citations, data availability statements, or supplementary materials included in this article.
Supplementary Materials
Figure S1. Cytometric analysis of EMT markers: a. the gate strategy on Bronchi tissues analyzed, to identify the CD45 negative and live cells. b. isotype control on Vehicle (I) and S1P (II) on treated mouse. c. CD326 and CD90 expression on Vehicle (III) and S1P (IV) on treated mouse
Data Availability Statement
The data that support the findings of this study are available from the corresponding author upon reasonable request.