

Abstract
Summer droughts strongly affect soil organic carbon (SOC) cycling, but net effects on SOC storage are unclear as drought affects both C inputs and outputs from soils. Here, we explored the overlooked role of soil fauna on SOC storage in forests, hypothesizing that soil faunal activity is particularly drought‐sensitive, thereby reducing litter incorporation into the mineral soil and, eventually, long‐term SOC storage.
In a drought‐prone pine forest (Switzerland), we performed a large‐scale irrigation experiment for 17 years and assessed its impact on vertical SOC distribution and composition. We also examined litter mass loss of dominant tree species using different mesh‐size litterbags and determined soil fauna abundance and community composition.
The 17‐year‐long irrigation resulted in a C loss in the organic layers (−1.0 kg C m−2) and a comparable C gain in the mineral soil (+0.8 kg C m−2) and thus did not affect total SOC stocks. Irrigation increased the mass loss of Quercus pubescens and Viburnum lantana leaf litter, with greater effect sizes when meso‐ and macrofauna were included (+215%) than when excluded (+44%). The enhanced faunal‐mediated litter mass loss was paralleled by a many‐fold increase in the abundance of meso‐ and macrofauna during irrigation. Moreover, Acari and Collembola community composition shifted, with a higher presence of drought‐sensitive species in irrigated soils. In comparison, microbial SOC mineralization was less sensitive to soil moisture. Our results suggest that the vertical redistribution of SOC with irrigation was mainly driven by faunal‐mediated litter incorporation, together with increased root C inputs.
Our study shows that soil fauna is highly sensitive to natural drought, which leads to a reduced C transfer from organic layers to the mineral soil. In the longer term, this potentially affects SOC storage and, therefore, soil fauna plays a key but so far largely overlooked role in shaping SOC responses to drought.
Keywords: carbon cycling, carbon storage, climate change, drought, forest, litter decomposition, mesofauna communities, soil biota
Although essential for C incorporation into the soil, the role of soil fauna in SOC cycling of dry forests has largely been overlooked. Here, we show that 17‐year‐long irrigation in a naturally dry pine forest led to C losses from organic layers and comparable C gains in uppermost mineral soils. The vertical SOC redistribution was mainly driven by accelerated faunal‐mediated litter incorporation. Our findings reveal that soil fauna is highly sensitive to natural drought, which affects the C transfer into the mineral soil. In the longer term, this will lead to potential cascading effects on SOC storage and stability.

1. INTRODUCTION
The unprecedented summer droughts in 2003, 2015, and 2018 severely affected the productivity and functioning of European forests (Büntgen et al., 2021; Ciais et al., 2005). Drought limits the metabolic activity of plants and soil biota (Reichstein et al., 2013). The predicted increase in drought intensity and frequency (Seneviratne et al., 2021; Stocker, 2014) would thus strongly impact carbon (C) cycling in the plant‐soil system by reducing net primary productivity, belowground C allocation, and decreasing litter decomposition (Ciais et al., 2005; Gao et al., 2021; Santonja et al., 2017). However, it is still challenging to predict the net effects of altered precipitation patterns on soil organic carbon (SOC) storage since drought suppresses both C inputs and outputs from soils (Cotrufo et al., 2011; Zhou et al., 2016) and the interrelated above‐ and belowground processes. In addition, plant and soil biota acclimate or adapt to altered precipitation, and species composition shifts in the longer term (Eilmann et al., 2009; Feichtinger et al., 2015; Hartmann et al., 2017). Rainfall manipulation studies in forests provide clear evidence that drought suppresses both ecosystem productivity and respiration rates (Huang et al., 2018; Schindlbacher et al., 2012), while total SOC stocks down to 15 or 30 cm depth were found to increase only slightly (Zhou et al., 2016) or remain unchanged (Deng et al., 2020). However, small effect sizes might vanish in the large C reservoir of soils (Schrumpf et al., 2011), and the short duration of these studies (less than a decade) hampers the identification of long‐term responses in the soil (Beier et al., 2012; Feichtinger et al., 2015).
While responses of total SOC stocks might be small or difficult to detect, drought may impact organic layers and mineral soils to a different extent, as revealed along natural precipitation gradients (Gosheva et al., 2017; Wiesmeier et al., 2013). The processing of organic matter will be affected differently in distinct soil layers due to a number of mechanisms: (1) Soil moisture varies strongly within soil profiles and between soil compartments (Moyano et al., 2012). Surface litter and organic layer experience more intense and frequent drying and rewetting cycles compared to the underlying mineral soil since litter is located on the soil surface and physically disconnected from the continuum of pores of the mineral soil (Keith et al., 2010). (2) C inputs to the mineral soil occur primarily via belowground C sources including rhizodeposition, which show a sensitive response to changes in soil moisture (Gao et al., 2021). (3) Moisture limitation strongly impacts soil fauna (Blankinship et al., 2011), which plays a key role in the decomposition of litter and its incorporation into the mineral soil (Chamberlain et al., 2006; Frouz, 2018). In fact, soil fauna enhances litter decomposition through multiple mechanisms including direct feeding (Thakur et al., 2018), litter fragmentation (Nielsen, 2019), or facilitating microbial decomposition (Filser et al., 2016; García‐Palacios et al., 2013), with cascading effects on litter transformation into soil organic matter (SOM) (Chamberlain et al., 2006; Soong et al., 2016).
Drought may affect all decomposer organisms directly through changes in water availability or indirectly through a decline in substrate quantity and quality (Schimel, 2018). Soil biota exhibits a broad range of drought sensitivity among faunal and microbial groups (Manzoni et al., 2012; Nielsen, 2019). The divergent responses of decomposers to water limitation can thus differentially affect the various pathways of SOM cycling. For instance, the activity of soil fauna—including organisms involved in litter fragmentation and belowground C transfer (Chamberlain et al., 2006; Frouz, 2018)—responds earlier and more intensely to water stress than the activity of bacteria and fungi (Manzoni et al., 2012; Siebert et al., 2019). Some key decomposer faunal groups are soft‐bodied and rely on a moist surface (e.g., enchytraeids, earthworms) (Carley, 1978; O'Connor, 1957) or have a thin and permeable cuticle (e.g., springtails, insect larvae) (Brown & Gange, 1990; Holmstrup et al., 2001), which make them highly susceptible to drought spells. Although soil invertebrates can adopt a large range of drought avoidance strategies, e.g., by migrating to deeper or moister soil areas (Rodà et al., 1999), the severity and duration of summer droughts nevertheless impose serious constraints on the duration of their activity (Gerard, 1967; Holmstrup et al., 2001) and may lead to lasting effects on populations (Lindberg & Bengtsson, 2006). In comparison, soil microorganisms—conducting most of the organic matter mineralization (Prescott, 2005)—can endure lower water potentials through numerous mechanisms, e.g., by living in smaller water‐filled pores (Foster, 1988), increasing their osmotic potential or entering dormancy called anhydrobiosis (Bosch et al., 2021), but can rapidly return to an active state following rewetting (Placella et al., 2012; Schimel, 2018).
Rainfall manipulation studies showed that reducing precipitation in forests may decrease the abundance, species richness or alter the community composition of key decomposer faunal groups (Aupic‐Samain et al., 2021; Blankinship et al., 2011; Lindberg et al., 2002). Moreover, drought has been observed to slow down litter decomposition driven by soil fauna (Peguero et al., 2019; Santonja et al., 2017). Although of pivotal importance for the net transfer of C into the mineral soil, faunal processes have largely been overlooked in studies addressing drought impacts on SOC storage.
Our study aimed to assess the effects of water limitation on SOC storage in forests and how these are mediated by soil fauna. We took advantage of a unique, large‐scale irrigation experiment in a drought‐prone pine forest running since 2003 (Dobbertin et al., 2010; Joseph et al., 2020). Here, we assessed the vertical SOC distribution and changes in SOM properties after 9 and 17 years and studied litter mass loss from three dominant tree/shrub species using litterbags of different mesh sizes, including or excluding meso‐ and macrofauna. We also examined soil meso‐ and macrofauna abundance and the community composition of the main mesofaunal decomposer groups (here Acari and Collembola) by extracting and morphologically classifying soil invertebrates. Our hypothesis was that soil faunal decomposers and litter transformers would respond particularly sensitive to irrigation, showing a greater stimulation of their activity by irrigation in comparison to microorganisms. As a consequence, we expected that irrigation would accelerate litter incorporation into the mineral soil, which increases mineral SOC stocks, and thus alters soil C storage and its vertical distribution in this naturally dry pine forest. In turn, this would imply that naturally occurring summer droughts at this site—predicted to intensify and become more frequent in a future climate—suppress the faunal‐mediated C translocation within the soil, thereby reducing long‐term SOC storage in the mineral soil.
2. METHODS
2.1. Site description
The experimental site is located in a xeric forest in the Rhone Valley (Pfynwald, Valais, Switzerland, 46°18'N, 7°37'E, 615 m a.s.l.). The forest is dominated by mature (approximately 100‐year‐old) Scots pine trees (Pinus sylvestris) interspersed with pubescent oak (Quercus pubescens Willd), with a stand density of about 730 trees ha−1 (Brunner et al., 2009). The study area has a moderately continental climate, with a mean annual temperature of 10.7°C and mean annual precipitation of 518 mm from 2003 to 2012 (Herzog et al., 2014). The terrain is flat, and the soil is a shallow Pararendzina with an approx. 20‐cm‐thick topsoil developed on an alluvial fan, with high contents of skeletal material (>50%) below 20‐cm depth (Herzog et al., 2019).
The experimental site is divided into eight plots (25 × 40 m) separated by 5‐m buffer areas (Dobbertin et al., 2010). The experimental plots have all the same soil type, clay content (Table S4), parent material, topographic and climatic characteristics (Brunner et al., 2009), thus minimizing the potential confounding factors that may affect SOC storage. The plots were aligned side by side along a hydrologically disconnected water channel (see the plot layout in Figure S1). In 2003, four plots were randomly selected and have been irrigated since then, whereas the other four plots were left untreated (hereafter termed ‘irrigated’ and ‘dry control’, respectively) (Dobbertin et al., 2010). Thus, the irrigation experiment is laid out as a completely randomized design. The irrigation system is activated each night during the vegetation period (from May to October), approximately doubling the annual precipitation amount (+600 mm yr−1), using water from a nearby channel of the Rhone River that is hydrologically disconnected from the surrounding soil. Nutrient input of N and P through irrigation is minor, but concentrations of Ca, Mg, and K are higher than in rainwater (Dobbertin et al., 2010). These inputs of base cations are presumably not important in these calcareous soils.
Volumetric soil water content was measured with 10HS‐Sensors (Decagon Devices) installed in three dry control and three irrigated plots at two different locations per plot at 10‐cm soil depth. Soil temperature was measured in the same profiles at 10‐cm depth using MPS‐2 Sensors (Decagon Devices).
2.2. Litter decomposition experiment
Litter decomposition was examined from May 2014 to December 2015 using the litterbag method. Litterbags were filled with foliage litter from the dominant trees Quercus pubescens and Pinus sylvestris and the shrub Viburnum lantana, which are the main contributors to litterfall at the site. Freshly‐senesced Quercus and Viburnum leaves were picked from the litter layer, whereas Pinus needles were collected in litter traps just before the start of the litterbag experiment. Litter materials were separated according to whether their origin was from dry control or irrigated plots. Leaf litter was cut into pieces of 2 × 2 cm and oven‐dried at 40°C to constant weight. Litterbags (10 × 10 cm) with two mesh sizes were used: 0.1 mm (made of nylon cloth material), allowing the access of soil microfauna and microorganisms, and 10 mm (made of polyester fiber material), allowing access to micro‐, meso‐, and macrofauna plus microorganisms. For each plot, 12 litterbags (2 mesh sizes × 3 litter species × 2 origins) per time point (n = 6), were filled with 1 ± 0.02 (SE) g of litter material (total n = 576 litterbags). After removing the vegetation and cleaning the soil surfaces from all visible litter residues, litterbags were placed on the soil surface in early May 2014. The first set of litterbags (n = 96) was collected after 10 days, before the start of irrigation, and then 40, 80, 110, 140, and 572 days after their placement in the field. The first set of litterbags was collected after 10 days in order to control possible mass losses or gains due to experimental shortcomings. The chemical properties of the litter were measured from this first set of control litterbags. Collected litterbags were transported immediately to the laboratory. Litter material was carefully cleaned with a fine brush from extraneous plant debris and soil. Residual litter was weighted after drying at 40°C to constant weight. The ash content of the collected litter was determined by burning at 550°C for 4 h and used for correction of the mass loss (Karberg et al., 2008).
2.3. Soil sampling and processing for SOC stocks
Soils were sampled in October 2011 and November 2019, after the end of the irrigation period. In each of the eight plots, four quantitative soil pits were excavated with a 20 × 20 cm frame. The organic layer was separated in the field into L (undecomposed litter) and FH layer (fermentation and humified material). Afterward, the mineral soil was excavated by depth increments (0–2, 2–5, 5–10, 10–20 cm). The soil samples were immediately transported to the laboratory and kept at 4°C until further processing. The field‐moist organic layer samples were homogenized and cleaned from herbs, mosses, and woody debris using a 4 mm sieve, and then weighed. The field‐moist mineral soil samples were sieved at 4 mm, sorting out stones and roots, and weighed. A subsample of soil <4 mm was freeze‐dried and then sieved at 2 mm and weighed for the determination of fine soil dry mass. The bulk density of the fine soil was estimated by dividing the dry mass of fine soil by the fine soil volume of each depth increment sampled in the quantitative pits. For chemical analyses, the four subsamples were pooled into one composite sample for each plot and depth increment. Roots were carefully rinsed over a 1‐mm sieve with tap water. Fine roots (diameter ≤2 mm) were hand‐picked, freeze‐dried, and weighed.
2.4. Chemical analyses of soil and litter materials
Composite samples of dried soil, root, and litter materials were ground to a fine powder using a ball mill (MM2000, Retsch). Mineral soil samples were treated with HCl to remove inorganic C prior to dry combustion (Walthert et al., 2010). Samples were analyzed for C and N contents, δ13C, and δ15N values by dry combustion with an automated elemental analyzer‐continuous flow isotope ratio mass spectrometer (Euro‐EA 3000, HEKAtech GmbH, Germany, interfaced with a Delta‐V Advanced IRMS, Thermo GmbH, Germany).
Klason lignin was extracted from the litter used in the litter decomposition experiment, according to Herzog et al. (2014). Total lignin content was equal to the sum of the non‐acid‐soluble and the acid‐soluble lignin, which was estimated from UV absorbance of the hydrolysate at 205 nm (Dence, 1992). The phenol content was quantified using the water solubles of the lignin extraction after Swain and Hillis (1959).
2.5. Sampling and analysis of soil fauna
Soil fauna was examined by assessing: (i) soil meso‐ and macrofauna abundances for the main taxonomic groups in 2015 and (ii) community composition of the most abundant mesofauna groups (here Acari and Collembola), by extracting and morphologically classifying soil invertebrates at the genus and species level in 2017.
2.5.1. Soil fauna abundance
Meso‐ and macrofauna abundances were assessed in early May 2015 before the start of summer irrigation (gravimetric water content of first 10 cm soil: 45 ± 1% in dry control plots, vs. 42 ± 2% in irrigated plots) and in July 2015 during the irrigation period (gravimetric soil water content: 15 ± 1% vs. 26 ± 1%, in dry control vs. irrigated plots). At the two sampling dates, four soil samples were randomly collected in each of the eight experimental plots. The organic layers (L+FH) were carefully excavated using a 20 × 20 cm frame, and afterward, a soil corer (Ø = 5 cm) was used to sample the mineral soil to a depth of 10 cm. Samples were transported immediately to the laboratory and stored at 4°C until further processing. Soil fauna was extracted from soil samples in the laboratory using Tullgren (“Berlese”) funnels (Crossley & Blair, 1991), where animals were collected in a plastic vial filled with 75% ethanol. Extracted invertebrates were classified into the following taxonomic units according to Müller/Bährmann determination keys (Köhler, 2015): Acari, Collembola, Protura, Symphyla, Pseudoscorpiones, Lumbricidae, Formicidae, Insecta (adults and larvae separately), Diplopoda, Isopoda, Gastropoda, Chilopoda, Araneae.
To include deeper‐dwelling worms, earthworms were sampled from the mineral soil within two, randomly selected areas (50 × 50 cm) per plot using the mustard extraction method (Lawrence & Bowers, 2002). After litter removal, 5 L of 0.33% mustard solution was poured onto the soil surface in two steps after a 10‐min interval (Gunn, 1992). Earthworms (Lumbricidae) were then counted from each area. In addition to earthworms, Enchytraeidae were also counted.
2.5.2. Soil mesofauna community composition
Litter and soil samples were collected within four randomly selected 2 × 2 m squares in each of the eight experimental plots during the irrigation period in the relatively wet June 2017 (gravimetric water content of first 10 cm soil: 21 ± 1% vs. 24 ± 1%, in dry control vs. irrigated plots). After sampling the litter layer within the 2 × 2 m square, one soil core was randomly sampled using a soil corer (Ø = 5 cm) to a depth of 10 cm (thus including FH and mineral soil). The collected samples (four litter layers and four soil cores) were pooled into one composite sample (one litter layer and one soil core) per plot. Samples were immediately transported in a cooling box to the laboratory, and soil microarthropods were extracted using a Macfadyen high gradient extractor (Macfadyen, 1961). Soil microarthropods were distinguished into Collembola (Subclass) and Acari (Subclass), which were further classified into Oribatida (Order Sarcoptiformes, Suborder Oribatida, nomenclature following Weigmann, 2006), Gamasina (Order Mesostigmata, Suborder Gamasina), Uropodina (Order Mesostigmata, Suborder Uropodina), Prostigmata (Order), and Astigmata (Order), up to genus and species level whenever possible.
2.6. Soil C fluxes
Litterfall was sampled twice per year throughout two full years (November 2013–November 2014 and April 2016–April 2017) from seven 0.5 × 0.5 m litter traps continuously placed on the soil surface in each of the eight replicated plots (n = 56 in total).
Moisture dependency of microbial soil respiration was determined by laboratory incubation of root‐free soil samples (0–10 cm depth) first dried at room temperature and then rewetted to different soil moisture levels in the laboratory (n = 6 per moisture content). More details can be found in Joseph et al. (2020).
Soil respiration in the field was measured monthly in 2014 and 2015 using an infrared gas analyzer (IRGA, Vaisala) on 4 collars per plot (n = 32 in total), according to Hartmann et al. (2017). Cumulative soil respiration over the years 2014–2015 was estimated by interpolating linearly between the monthly measurements using the temperature dependency of soil CO2 effluxes from the irrigated plots obtained from long‐term monitoring (2011–2019), according to Gao et al. (2021).
2.7. Data analysis
Carbon stocks in the organic layers (L and FH) were obtained by multiplying SOC concentrations with dry masses of the organic material. Mineral SOC stocks were determined by multiplying SOC concentrations with bulk densities and fine soil volume of the corresponding depth increment.
The effects of the irrigation on all parameters were tested with linear‐mixed effect models using the lme function in nlme package, version 3.1‐140 (Pinheiro et al., 2019) using R version 3.6.1 (R Core Team, 2019). For soil characteristics and soil fauna abundance, the model included irrigation, sampling depth, year, and their interaction as fixed effects when relevant. The multiple sampling within each plot was accounted for by considering the plot as a random effect and including a temporal residual correlation structure (corAR1, auto‐regressive model of order 1) within the lme function following Zuur et al. (2009) to model potential time‐dependency of measurements. We have also added a spatial correlation structure for relevant models showing a depth correlation in the residuals, using corSpher in lme function, with depth as spatial covariate (Pinheiro & Bates, 2000). Finally, we accounted for cases where the residual variance differed between levels of treatments, sampling depths, or years, using the VarIdent structure (Pinheiro & Bates, 2000).
Mass loss from litterbags and chemical litter properties were tested for the fixed effects of irrigation, origin, mesh size, species, sampling date, and their interaction, with litterbag location nested within the plots as a random effect. The VarIdent structure was included to account for different variances between levels of treatments, origins, mesh sizes, species, and sampling dates. To account for the repeated measurements in the plots, an autocorrelation structure (corAR1) was included in the statistical model (Pinheiro & Bates, 2000).
In order to predict the minimum detectable difference (MDD) for SOC stocks in different soil layers (Table S2), we performed a power analysis for linear‐mixed effect models (including all sampling years) by simulation using the R package simr, version 1.0.5 (Green & MacLeod, 2016) with α value of 0.05, the statistical power of 60% (β of 0.4), and 200 Monte Carlo simulations. In order to enable a comparison of MDD for soil layers with different magnitudes of SOC stocks, MDDs were also calculated as percentages of mean dry control stocks for that layer.
Standard errors of irrigation‐induced changes (%) were estimated according to the rules for propagation of independent random uncertainties for products and quotients according to Taylor (1997).
For the analysis of mesofauna α‐diversities (i.e., species diversity within the plot), the observed richness (number of species) and Shannon diversity index were estimated using the R package phyloseq, version 1.30 (McMurdie & Holmes, 2013). Mesofauna community structure was measured by the Bray–Curtis index. Bray‐Curtis dissimilarities were calculated based on standardized square‐root transformed group abundances, and then visualized by analysis of principal coordinates (PCO) using the ordinate function in phyloseq. Effects of irrigation, sampling layer, and their interaction on α‐diversity were assessed by linear mixed‐effects models as described above. Effects of irrigation, sampling layer, and their interaction on Bray‐Curtis dissimilarities were assessed by permutational multivariate analysis of variance (PERMANOVA, 105 permutations with Monte‐Carlo test procedure) using PRIMER v7 (Clarke & Gorley, 2015). Correlation‐based indicator species analysis was calculated based on square‐root transformed relative abundances using the multipatt function in R package indicspecies (version 1.7.9) with 105 permutations and with all possible combinations (De Cáceres et al., 2010).
The dependent variables were log‐ or sqrt‐transformed when necessary to meet assumptions of normality and homoscedasticity of the residuals. Research data are publicly archived in EnviDat (Guidi et al., 2022).
3. RESULTS
3.1. SOC stocks and concentrations
Irrigation significantly decreased C stocks in the organic layers (including both L and FH layers) after 9 and 17 years of summer irrigation by 60% (−1.0 kg C m−2 in 2011 and 2019, with p = 0.009 of the linear‐mixed effect model including both sampling years, Table S1a; Figure 1a,b). In contrast, SOC stocks in the mineral soil increased after irrigation at 2–5 cm (+61% in 2011, and +35% in 2019, p = 0.049, Table S1a; Figure 1a,b) and 5–10 cm depth (+66% in 2011 and +39% in 2019, p = 0.016, Table S1a; Figure 1a,b). This increase in mineral SOC stocks under irrigation was due to higher SOC concentrations at specific soil depths rather than soil masses (Table S5). In the entire mineral topsoil (0–20 cm depth) of this shallow Pararendzina, the increase in SOC stocks amounted to 1.0 kg C m−2 in 2011 and 0.8 kg C m−2 in 2019 (p = 0.11, Table S1a). Total SOC stocks (including L + FH and mineral soil) were not significantly different in dry control and irrigated plots (Figure 1a,b; Table S1a,b). For total SOC stocks, the minimum detectable difference (MDD) calculated by power analysis through simulation was 1.5 kg C m−2, while for SOC stocks at 2–10‐cm depth (where most of the SOC change in mineral soil took place) was 1.1 kg C m−2, which approximately corresponded to the observed irrigation effect for the same depth (Table S2). However, when expressed relatively to mean SOC stocks, the MDD of total SOC stocks was much smaller than the MDD of SOC stocks at 2–10‐cm depth (26% vs. 62%, Table S2), given the larger stocks in the total soil compared to the 2–10‐cm depth increment.
FIGURE 1.

SOC stocks in the organic layers (L litter, and FH fermentation and humified) and mineral soil at different soil depths in dry control and irrigated plots sampled in 2011 (a), and 2019 (b). The symbols represent the means of four replicates (±standard error). p‐values are calculated with linear‐mixed effect models: p < 0.10 (·), p < 0.05 (*), p < 0.001 (***)
3.2. Properties of the soil organic matter
The natural 13C abundance in SOM decreased under irrigation (i.e., more negative values of δ13C, Figure 2a). In 2019, the difference in δ13C signature between dry control and irrigated plots was less evident in the L (−0.3‰, p = 0.15, Table S3) than in the FH layer (−0.8‰, p = 0.031, Table S3) and in the mineral soil, such as at 0–2 cm depth (−1.0 ‰, p = 0.011, Table S3). Similar to natural 13C abundance in SOM, root δ13C signature decreased under irrigation, with an average difference of −0.8 ‰ (p = 0.002, Table S3; Figure 2a). The natural 15N abundance in SOM also differed between treatments, with higher δ15N values under irrigation in the FH layer (p = 0.012, Table S3; Figure 2b) but lower ones in irrigated than in dry control plots at 5–10 cm depth (p = 0.034, Table S3; Figure 2b). Irrigation did not affect C/N ratio of SOM (p = 0.61, Table S3; Figure 2c).
FIGURE 2.

The natural abundance of 13C (a), 15N isotope (b), and C/N ratio (c) in the organic layers (L litter, and FH fermentation and humified), mineral soil at different soil depths, and fine roots (total soil 0–20 cm) in dry control and irrigated plots sampled in 2019. The symbols represent the means of four replicates (±standard error). Fine‐roots properties are reported to a depth of 10 cm, representing the average depth of sampled soil (0–20 cm). P‐values are calculated with linear‐mixed effect models: p < 0.10 (·), p < 0.05 (*), p < 0.01 (**), p < 0.001 (***)
3.3. Litter decomposition
Foliar litter chemistry significantly differed among tree species used for filling the litterbags (Table 1). The C concentration, C/N and lignin/N ratios were higher in Pinus than in Quercus and Viburnum (Table 1; Table S6a). Phenol content was higher in Pinus and Quercus than in Viburnum (Table 1; Table S6a). Additionally, Viburnum and Pinus litter originating from irrigated plots had a higher C/N ratio and lower N concentration than dry control plots, whereas no difference in lignin, lignin/N, and phenol content was observed (Table 1; Table S6b). During the litter decomposition experiment in 2014, soil water contents monitored at 10 cm depth by soil sensors remained rather constant in the irrigated plots averaging 40.3 ± 0.3 vol% (May–October), never dropping below 30 vol% (Figure S2b). In the dry control, they fluctuated more strongly and decreased to 22 vol% in October–November at 10 cm depth (Figure S2b) and rapidly increased to values above 30 vol% following a pronounced precipitation event in November. In the litter layer, differences in soil water content were even more pronounced. Their gravimetric water content at the end of August 2014 was 17 ± 1% in dry control plots, vs. 42 ± 4% in irrigated plots. Irrigation did not affect soil temperature at 10‐cm depth with annual averages in dry control plots of 11.8 ± 0.2°C vs. 11.9 ± 0.2°C in irrigated plots (Figure S2c). Irrigation strongly affected litter mass loss (p < 0.001, Table S7a; Figure 3). Mass loss was greater in the 10 mm than in the 0.1 mm mesh bags, with a significant effect of mesh size for Quercus and Viburnum (p < 0.001, Table S7b). After 140 days in the field, following the experimental irrigation during summer and early fall, irrigation strongly accelerated the mass loss of Quercus and Viburnum litter in 10 mm mesh bags compared to the dry control (+228% for Quercus, with p = 0.009, +202% for Viburnum with p = 0.013, Table S7c), whereas the irrigation effect was not significant for Pinus needles (+40%, p = 0.17, Table S7c). In 0.1 mm mesh bags, the mass loss after 140 days increased significantly for all litter species under irrigation (+38–46%; Table S7c; Figure 3). The contribution of meso‐ and macrofauna to total mass loss (estimated by the differences in mass loss between the two mesh sizes) increased under irrigation by about 9–10 times for Quercus and Viburnum leaves, but only by 43% for Pinus needles. After 572 days, irrigation accelerated the mass loss of Quercus litter in 10 mm mesh bags (+31%; p = 0.041, Table S7c) with more than 90% loss of initial litter mass under irrigation, whereas differences in litter mass of Viburnum were not statistically significant (+15%; p = 0.92, Table S7c). Mass loss in 0.1 mm mesh bags was greater under irrigation for Quercus (+23%; p = 0.021) and Pinus (+22%; p = 0.050), but not different for Viburnum (p = 0.65, Table S7c).
TABLE 1.
Foliar litter chemistry grouped according to species and origin (dry control vs. irrigated plots). The chemical properties of the litter were measured from a set of control litterbags collected 10 days after placement (before the start of irrigation). The values represent means with standard error of the mean in brackets (means ±SE, with n = 16 except n = 3 for lignin, lignin/N, and phenol)
| Species | Origin | C (%) | N (%) | δ13C (‰) | δ15N (‰) | C/N | Ash (%) | Lignin (%) | Lignin/N | Phenol (%) |
|---|---|---|---|---|---|---|---|---|---|---|
| Quercus | Dry control | 44.8 (0.3) a | 0.97 (0.03) | −30.3 (0.1) a | −10.1 (0.1) b | 46.8 (1.1) | 6.67 (0.09) b | 26.3 (0.5) | 28.8 (1.2) | 2.16 (0.08) |
| Irrigated | 44.6 (0.1) b | 0.96 (0.01) | −30.9 (0.1) b | −9.6 (0.1) a | 46.8 (0.6) | 7.73 (0.10) a | 26.8 (1.5) | 28.2 (1.9) | 2.25 (0.14) | |
| B | A | C | B | B | B | B | A | |||
| Viburnum | Dry control | 45.0 (0.2) a | 0.93 (0.01) a | −29.3 (0.0) a | −8.39 (0.08) | 48.3 (0.6) b | 8.76 (0.18) | 27.6 (1.1) | 28.7 (0.4) | – |
| Irrigated | 44.1 (0.1) b | 0.87 (0.01) b | −29.9 (0.1) b | −8.19 (0.06) | 50.6 (0.6) a | 9.10 (0.11) | 26.8 (0.5) | 31.2 (1.1) | 1.67 (0.18) | |
| B | A | B | A | B | A | B | B | |||
| Pinus | Dry control | 51.6 (0.4) a | 0.72 (0.01) a | −27.4 (0.0) a | −11.2 (0.1) b | 72.0 (1.4) b | 3.00 (0.19) b | 28.6 (1.3) | 39.1 (2.4) | 2.41 (0.40) |
| Irrigated | 50.6 (0.1) b | 0.65 (0.01) b | −28.3 (0.0) b | −10.8 (0.1) a | 78.2 (1.0) a | 3.36 (0.13) a | 28.6 (2.6) | 43.1 (4.9) | 2.04 (0.11) | |
| A | B | A | C | A | C | A | A |
Different small letters indicate a significant difference between litter origins within the same species (p < 0.05).
Different capital letters indicate a significant difference among species (p < 0.05).
FIGURE 3.

Mass loss (% of initial mass) from litterbags of Quercus leaves (Q. pubescens), Viburnum leaves (V. lantana), and Pinus needles (P. sylvestris) in dry control and irrigated plots over field decomposition from May 2014 to December 2015. The 0.1 mm mesh bags allowed the access of soil microfauna and microorganisms, while 10 mm mesh bags allowed the access of micro‐, meso‐, and macrofauna plus microorganisms. The symbols represent the means of eight replicates (±standard error). The mass loss of Pinus needles in 10‐mm mesh bags in irrigated plots is not shown for the last collection date (only 1 litterbag was retrieved)
3.4. Soil fauna abundance and mesofauna diversity and community composition
The soil meso‐ and macrofauna was dominated by Acari (69%–90% of the total individuals across different sampling dates in 2015 and layers), followed by Collembola (6%–22% of the total individuals, Table S8). In May 2015, when soils of the irrigated and non‐irrigated plots were equally moist, the irrigation treatment showed a limited effect on the abundance of main decomposers and litter transformers (Figure 4a). Only the abundance of Collembola was significantly higher in the organic layers of irrigated than of dry control plots (+130%; p = 0.038, Table S8), while the abundance of other main decomposers was not significantly affected by irrigation (Table S8; Figure 4a). In July 2015, when soils showed pronounced differences in soil water content, irrigation strongly affected the abundance of the main decomposers and litter transformers in the organic layers, in the following order: Insect larvae (26‐fold), Isopoda (24‐fold), Symphyla (9‐fold), Acari (4‐fold), and Collembola (3‐fold, Figure 4b; Table S8). In the organic layers, Lumbricidae were present only in irrigated plots, but just in two out of four plots. Similar to the organic layers, irrigation significantly increased the abundance of Collembola (fourfold, p = 0.007, Table S8) in the mineral soil. Irrigation showed a fivefold increase of Lumbricidae (p = 0.042, Table S8) and a fourfold increase of Symphyla (p = 0.10, Table S8), but this increase was only marginally significant due to high variability among irrigated plots. In addition, irrigation significantly increased the abundance of Enchytraeidae (13‐fold, p = 0.005, Table S8). In contrast, there were no effects of irrigation on the abundances of Acari and Insect larvae in the mineral soil (Figure 4b; Table S8).
FIGURE 4.
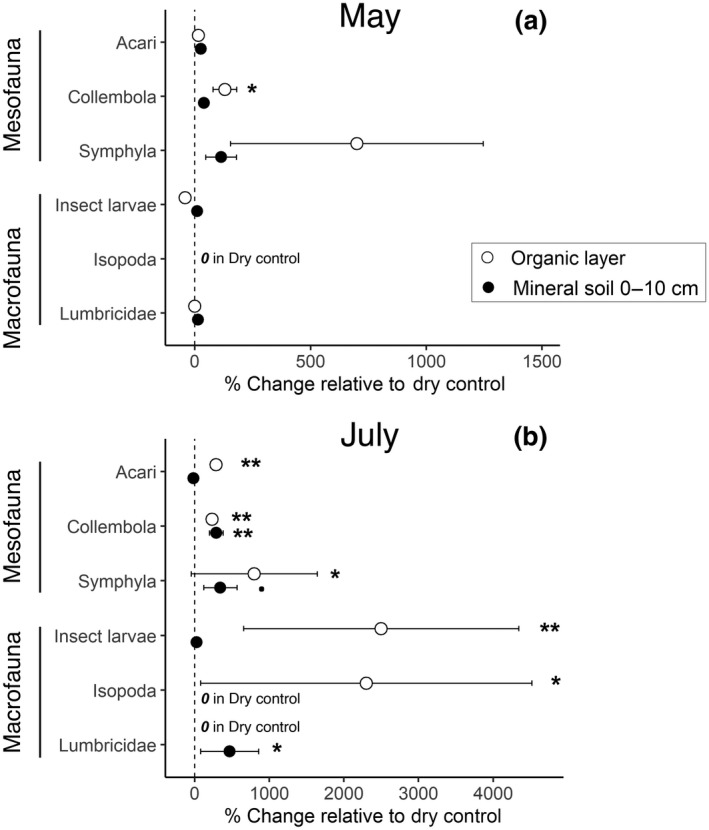
Irrigation‐induced changes in the relative abundance of the main decomposer organisms and litter transformers (based on Nielsen, 2019) in the organic layers (L + FH, litter, plus fermentation and humified) and mineral soil (0–10 cm) at two sampling dates: (a) May 2015, before the start of irrigation, and (b) July 2015, during the irrigation period. The % changes are calculated as (Irrigated—Dry control)*100/Dry control. The % change could not be calculated when no individuals were collected in dry control plots (“ 0 in Dry control”). Standard errors (n = 4 plots) were estimated by laws of error propagation. P‐values of the number of individuals m−2 were calculated with linear‐mixed effect models: p < 0.10 (·), p < 0.05 (*), p <0.01 (**)
Abundances and α‐diversity (species richness and Shannon index) of the main mesofaunal groups (Acari and Collembola), assessed at similar soil moisture levels in irrigated and dry control plots in June 2017, did not significantly differ (Table S9). In contrast, irrigation significantly affected Acari (of which 80% belong to the Suborder Oribatida) and Collembola community composition based on Bray‐Curtis dissimilarities tested by PERMANOVA (irrigation effect on Acari: p = 0.013, on Collembola: p = 0.031, Table S9). Analysis of principal coordinates (PCO) based on Bray–Curtis dissimilarities revealed a divergence of Acari and Collembola communities between dry control and irrigated plots, and that community composition was clearly separated between the litter layer and the soil (Figure 5a,b). Indicator species analysis of Acari showed that Licnodamaeus pulcherrimus (Oribatida) and Zercon (Gamasina) were significantly associated with dry control plots, while Oppiella subpectinata (Oribatida) and Astigmata were indicative of irrigated soils (Table S10). Among Collembola, Pseudosinella alba was found to associate with dry control soils (Table S11).
FIGURE 5.

Multivariate ordination representation by principal coordinates (PCO) based on Bray–Curtis dissimilarities of Acari (a) and Collembola (b), in litter and soil 0–10 cm (including FH fermentation and humified and mineral soil) of dry control and irrigated plots, collected in June 2017. Bray–Curtis dissimilarities were calculated from standardized square‐root transformed species abundances. The variance explained by each PCO axis is given in parentheses. The ellipses enclose all points for combinations of layers (litter, soil 0–10 cm) and treatments (dry control, irrigated)
3.5. Responses of soil C fluxes and their moisture dependency
Irrigation enhanced both soil C inputs (litterfall, fine‐root production) and C outputs (soil respiration, litter mass loss from litterbags) compared to non‐irrigated conditions (Figure 6). Litterfall, fine‐root production, and soil respiration were 57%, 96%, and 45% greater in irrigated than in dry control plots, respectively. Microbial respiration (and thus microbial activity) measured from root‐free soil in the laboratory showed a distinct response to moisture starting to decrease below gravimetric soil water contents of 20%. In comparison to the abundance of the key decomposers Collembola and Lumbricidae sampled in the mineral soil in 2015, both microbial activity and soil respiration in the field were less sensitive at given soil moisture under dry conditions (Figure 7).
FIGURE 6.

Irrigation‐induced changes in soil C inputs, outputs, and stocks. Litterfall was obtained over two years (2013–2014, 2016–2017). Fine‐root production of Pinus was measured for the year 2015 in the upper 10 cm soil (Brunner et al., 2019). Cumulative soil respiration was estimated for the years 2014–2015. Litter mass loss after 140 days (May–October 2014) is shown for 0.1 mm mesh bags (access of soil microfauna and microorganisms) and 10 mm mesh bags (access of micro‐, meso‐ and macrofauna plus microorganisms) for broadleaves (Quercus, Viburnum) and conifer (Pinus) species. Soil C stocks were measured in 2011 and 2019. The % changes are calculated as (Irrigated–Dry control)*100/Dry control. Standard errors (n = 4 plots) were estimated by laws of error propagation
FIGURE 7.

Moisture dependency of microbial respiration (root‐free soil from 0–10 cm depth, incubated at different soil moisture levels under controlled conditions), soil respiration, and abundance of key decomposer faunal groups (Acari, Collembola, Lumbricidae). These faunal groups were sampled in the mineral soil (0–10 cm) in May 2015 (wet spring, before the start of irrigation) and July 2015 (dry summer, during the irrigation period). Microbial respiration data are adapted from Joseph et al. (2020). The dashed line represents the fit of microbial respiration (normalized to maximal rates) to a Boltzmann equation
4. DISCUSSION
4.1. Irrigation alters the vertical distribution of SOC stocks
Our results showed that 17‐year‐long irrigation in a naturally dry pine forest altered the vertical SOC patterns in the soil with a C loss in the organic layer and a comparable C gain in the mineral soil at 2–10‐cm depth, and thus did not affect total SOC stocks. The negligible effect on total SOC is consistent with unchanged SOC stocks observed in the first 10‐cm soil after 5 years of rainfall addition (+33% of annual precipitation) in Mediterranean shrubland (Talmon et al., 2011) and Mediterranean woodland (Cotrufo et al., 2011). We believe that in our study the lacking irrigation effect on total SOC stocks was “real” and not only due to the difficulty in detecting small SOC stock changes in the large C reservoir of soils within a few years (Schrumpf et al., 2011). Our power analysis revealed that the minimum detectable difference (MDD) of total SOC stocks was only slightly greater than the MDD of SOC stocks at 2–10‐cm depth (1.5 kg C m−2 vs. 1.1 kg C m−2), despite total SOC stocks were about 3 times larger compared to stocks at 2–10‐cm depth. Therefore, the relative MDD of total SOC stocks was much smaller than that of stocks at 2–10‐cm depth (26% vs. 62% of the mean SOC stocks, Table S2).
The lacking irrigation effect on total SOC stocks very likely results from a canceling out of C inputs and outputs from soils. The decadal long irrigation in this dry forest increased litterfall (+57%, Figure 6) and approximately doubled Scots pine fine‐root production (+96%, Brunner et al., 2019) as well as belowground C allocation of assimilates (+110%, Joseph et al., 2020). However, soil CO2 effluxes were also stimulated by the water addition, with effect sizes ranging between +45% in the moderately dry years 2014–2015 (Figure 6) to +90% in the dry years 2017–2018 (Gao et al., 2021). Overall, these positive irrigation effects imply that the naturally dry conditions in this drought‐prone forest strongly suppress C cycling rates. While the net effects of these opposed fluxes seem to balance out, the vertical SOC distribution differed between dry and non‐water limited conditions.
4.2. Irrigation enhances faunal‐mediated mass loss and C transfer
Our results indicate that soil fauna played a key role in the observed net C loss from organic layers with irrigation and probably also contributed to the concomitant C accumulation in the mineral soil. The litterbag study with different mesh sizes showed that summer irrigation strongly accelerated the mass loss of Quercus and Viburnum litter mediated by meso‐ and macrofauna (+215%, Figure 6). This increase was paralleled by the many‐fold increase in the abundance of key decomposer organisms and litter transformers, especially during irrigation in the naturally dry summer months (Figures 4b and 7). In comparison, litter mass loss by microfauna and microorganisms was less sensitive to irrigation (+44%, Figure 6) and remained even unaffected for fine roots in litterbags excluding macrofauna (Herzog et al., 2019). Moreover, potential microbial C mineralization (and thus microbial activity), as well as soil respiration measured at the lower limit of soil moisture levels occurring under field conditions (15 grav‐%), were only reduced by 50% in naturally dry vs. irrigated plots (see Figure 7). Taken together, these results suggest that faunal‐mediated litter mass loss and abundance of meso‐ and macrofauna respond more sensitively to water limitation than microbial activity. The outcome could be biased by an overestimation of the mass loss by larger mesh size bags (10 mm) due to litter “fall‐through,” increased leaching, or improved microclimatic conditions inside the litterbags (Kampichler & Bruckner, 2009). In our study, we minimized this artifact by carefully cleaning the soil surface from litter fragments before placing the litterbags to identify eventual litter fragments falling out. Also, we observed only a marginal effect of mesh size on the moisture conditions inside the litterbags (data not shown), which is in agreement with Riutta et al. (2012), who found no interaction between mesh size and watering treatment on moisture conditions within litterbags of different mesh sizes. Moreover, the loss of small litter pieces from litterbags with large mesh sizes can be attributed to the fragmentation by meso‐ and macrofauna, thus accounting for their role in facilitating litter incorporation into the soil, rather than to an artifact of the litterbag method (Riutta et al., 2012).
Meta‐analysis of decomposers activity in response to drought showed large variability among functional groups and individual species, with soft‐bodied fauna undergoing water stress sooner than microbial activity (Manzoni et al., 2012). In agreement with our study, microbial decomposers were only weakly affected by drier conditions (Aupic‐Samain et al., 2021; Pereira et al., 2019), while soil fauna groups playing a key role in litter fragmentation and incorporation processes, such as Collembola, Oribatida, and Lumbricidae, were found to be highly responsive to drought (Aupic‐Samain et al., 2021; Lindberg et al., 2002; Stevnbak et al., 2012). Among these, Collembola are particularly sensitive to desiccation due to their permeable cuticle (Kærsgaard et al., 2004; Peguero et al., 2019). In our study, irrigation increased the abundance of Collembola both in spring under equally moist soils and in summer at contrasting moisture levels between dry and irrigated conditions. The abundance of other important litter transformers such as Acari, Lumbricidae, Symphyla, and Isopoda—that can avoid drought, e.g., by migrating into moister soil (Gerard, 1967; Rodà et al., 1999)—was higher in irrigated as compared to non‐irrigated soils, but only during summer irrigation and not in early spring before the annual irrigation started and when soils were similarly moist (Figure 4a,b). This pattern indicates that faunal populations may recover within a few months or adapt after repeated drought exposure. Their apparent resilience is in line with previous rainfall manipulation studies (Eisenhauer et al., 2012; Holmstrup et al., 2017). Nevertheless, we found that the community composition of the two dominant mesofauna groups that play a fundamental role in litter decomposition (Acari, dominated by Oribatida, and Collembola) differed significantly between dry and irrigated conditions, despite unchanged species richness (Figure 5a,b; Table S9). The drought‐tolerant Licnodamaeus pulcherrimus (Acari, Suborder Oribatida) and the soil‐dwelling springtail Pseudosinella alba (Collembola) were significantly associated with dry control plots. Conversely, the drought‐sensitive mite Oppiella subpectinata (Acari, Suborder Oribatida) (Taylor & Wolters, 2005) and the detritivorous Astigmata (Acari, Suborder Astigmata) were indicative of irrigated soils (Table S10 and Table S11). Our results confirm that precipitation reductions (as in our naturally dry forest) may result in strong and long‐lasting changes in mesofauna community structures of Oribatida and Collembola (Holmstrup et al., 2013; Lindberg & Bengtsson, 2006; Lindberg et al., 2002). Changes in the community composition or presence/absence of particular species can be of greater importance to C cycling than species richness alone (Cragg & Bardgett, 2001; Nielsen et al., 2011). This suggests that in addition to changes in abundance of main decomposer faunal groups, changes in species composition may affect faunal‐mediated C decomposition and translocation under increasingly dry conditions.
Unlike Quercus and Viburnum, the mass loss of Pinus needles increased by irrigation to a similar extent both in soil fauna accessible and not accessible litterbags. Consequently, and in agreement with other studies (García‐Palacios et al., 2013; González & Seastedt, 2001), meso‐ and macrofauna seem to modify drought effects on decomposition more strongly for higher quality (e.g., Quercus and Viburnum) than for lower quality litter (Pinus).
4.3. Long‐term effects of removing water limitation on SOC
While our results give clear evidence for an enhanced loss of C from organic layers through faunal activity, other processes might have contributed to the concomitant SOC accumulation in the mineral soil with irrigation. For instance, enhanced DOC leaching due to irrigation might have increased the C transfer from the organic layer to the mineral soil. However, annual DOC fluxes from similarly shallow organic layers in Swiss forests range only between 13 and 26 g DOC m−2 yr−1 at MAPs of 1000 to 1800 mm yr−1 (Pannatier et al., 2012). These fluxes are thus substantially smaller than the observed redistribution of approximately 110 g C m−2 yr−1 in the first 9 treatment years. Carbon inputs from roots might have additionally contributed to increase SOC stocks in the upper mineral soil. Brunner et al. (2019) measured that Scots pine fine‐root production down to 10‐cm depth increased by 32 g m−2 yr−1, and thus by 15 g C m−2 yr−1 (with root C content of 45%) in the dry year 2015, which again seems far smaller as compared to the observed SOC gain in the mineral soil. Additional C inputs may originate from mycorrhiza or root exudation, but as these are both labile C sources, they may rather contribute more to the enhanced respiratory C fluxes in irrigated soils than to SOC storage. We, therefore, suggest that in this dry forest the moisture‐sensitive soil fauna exerted a key influence on the C transfer from the organic layer into the mineral soil. Our conclusion is supported by observations in eastern North America where invading earthworms led to rapid and dramatic changes in organic layers (Alban & Berry, 1994; Bohlen et al., 2004; Eisenhauer et al., 2007). For instance, in a mixed forest in northern Minnesota, invading earthworms decreased forest floor C stocks from 2.5 kg C m−2 to 0.3 kg C m−2 over a period of 14 years (Alban & Berry, 1994). In fact, this C loss was accompanied by an increase in mineral SOC stocks, which, however, did not fully compensate for the forest floor C loss.
In our study, the decrease in natural 13C and 15N abundance in the mineral soil under irrigated conditions gives clear evidence of a substantial “fresh” C input to soil. The decreased soil δ13C values under irrigation correspond to decreased δ13C values in the plant detritus (i.e., litter layer and fine roots), reflecting an increased photosynthetic discrimination of plant tissues under non‐water limited conditions (Farquhar et al., 1982). Therefore, significantly lower δ13C values in SOM under irrigation reflect a considerable C input of fresh organic matter into SOM of the mineral soil since the start of this experiment (Figure 2a; Figure S3). In contrast to δ13C, δ15N values are independent of the water‐use efficiency of plants and thus reflect OM degradation. Despite higher δ15N values in the organic layer of the irrigated plots, indicating a greater degree of OM degradation, the δ15N values were lower in the irrigated than in the dry control in the mineral soil (5–10 and 10–20 cm depth) and thus corresponded to less transformed OM. This implies that, at these depths, a greater portion of organic matter was derived from fresh litter (Dijkstra et al., 2006), either from above‐ or belowground litter input (Figure 2b; Figure S3).
The increased supply of “fresh” C resulting from stimulated faunal translocation as well as rhizodeposition may have cascading effects on the belowground C available for soil microbial communities and eventually lead to greater persistence of SOM. In this naturally dry forest, increased water supply shifted the soil microbiome from largely oligotrophic to more copiotrophic lifestyles (Hartmann et al., 2017), potentially reflecting the enhanced C transfer into the mineral soil observed here. In combination with the enhanced turnover of microbial biomass (Gao et al., 2021), this may lead to increased formation of microbial products that can become stabilized by associations with reactive mineral surfaces (Bossuyt et al., 2005; Cotrufo et al., 2015). In addition, the litter transferred into the mineral soil via soil fauna might become stabilized by occlusion into aggregates (Bossuyt et al., 2005). Consequently, the enhanced litter incorporation into the mineral soil under improved water availability in this dry pine forest does not only increase SOC stocks in the mineral soil, but may eventually also increase the overall SOC stability. In turn, this indicates that under naturally dry conditions in this pine forest—with drought predicted to intensify in the next decades—the faunal‐mediated C translocation within the soil is suppressed, which thus potentially reduces SOC stabilization and enhances the vulnerability of SOC against disturbances by climatic changes or forest management.
Although the C transferred from the organic layers to the mineral soil might have become increasingly stabilized into the mineral soil, e.g., through organo‐mineral associations, our repeated soil survey after 9 and 17 years of experimental irrigation suggests rather limited effects on total SOC stocks as there is no evidence of increasing effect sizes in the mineral soil after the first decade of summer irrigation. One reason for the lacking effect in later phases could be that the organic layer (a so‐called “Xero‐moder”) had been rapidly lost (leading to the formation of a “mull”) or transferred into the mineral soil within the first experimental years, e.g., by the abrupt removal of drought, which limited faunal activity during summer and early fall under naturally dry climatic conditions. Nevertheless, on an even longer (e.g., centennial) time scale, the altered C inputs to the mineral soils—increasing with greater precipitation and decreasing under drier conditions—may further impact C storage in the mineral soil. In support, studies along natural gradients in the Alps document that forest soils receiving lower annual precipitation are associated with smaller SOC stocks in mineral soils than soils receiving higher amounts of precipitation (Gosheva et al., 2017; Prietzel et al., 2016; Wiesmeier et al., 2013).
5. CONCLUSIONS
Our results show that long‐term summer irrigation in a drought‐prone Scots pine forest led to a redistribution of SOC with C losses from organic layers and a corresponding C gain in the uppermost mineral soils. This SOC redistribution took place in the first decade of irrigation. We also found that faunal‐mediated litter mass loss and translocation are more drought sensitive than microbial‐mediated decomposition. Consequently, we suggest that changes in meso‐ and macrofauna abundance and faunal‐mediated C translocation—here accelerated by irrigation and suppressed by naturally occurring summer droughts—strongly contributed to the altered vertical SOC distribution. Although of fundamental importance for the net transfer of C from the organic layer to the mineral soil, faunal processes have largely been overlooked in studies on climate change impacts on SOM. Together with decreased DOC leaching and root‐derived C, faunal‐processes suppression, e.g., by drought, leads to a lower C input into the mineral soil. This also decreases the C supply for belowground communities under dry conditions, which in turn potentially reduces the microbial processing and consequently the formation of stabilized SOM. However, the longer‐term effects (>20 years) of drier conditions on total SOC stocks remain equivocal as reduced C inputs to the mineral soil can be balanced by reduced microbial SOM mineralization in dry mineral soils.
CONFLICT OF INTEREST
None is declared.
Supporting information
Supplementary Material
Table S10
Table S11
Table S12
Table S13
ACKNOWLEDGMENTS
This study is based on the long‐term irrigation experiment Pfynwald, which is part of the Swiss Long‐term Forest Ecosystem Research Program LWF (www.lwf.ch). This project has received funding from the European Union’s Horizon 2020 research and innovation program under the Marie Sklodowska‐Curie grant agreement No 846134 (to C.G. and F.H). The authors are grateful to R. Köchli for soil sampling and soil texture and pH analysis, B. Rahimi, A. Zürcher, C. Heim and J. Imboden for soil and root processing, U. Graf for analyzing C, N, and stable isotopes, P. Bleuler and J. Gisler for running the site and maintaining the irrigation system, F. Sutter for drawing the Figure S1 “Experimental setup of the irrigation experiment.” The authors acknowledge the Research Institute of Organic Agriculture (FiBL) in Frick for use of the Macfadyen extraction device. The authors are also grateful to two anonymous reviewers for providing constructive comments. Special thanks go to the forest owner, the Burgergemeinde Leuk for long‐term permission of the irrigation experiment and to the local forest service for continuous technical support. Open access funding provided by ETH‐Bereich Forschungsanstalten.
Guidi, C. , Frey, B. , Brunner, I. , Meusburger, K. , Vogel, M. E. , Chen, X. , Stucky, T. , Gwiazdowicz, D. J. , Skubała, P. , Bose, A. K. , Schaub, M. , Rigling, A. , & Hagedorn, F. (2022). Soil fauna drives vertical redistribution of soil organic carbon in a long‐term irrigated dry pine forest. Global Change Biology, 28, 3145–3160. 10.1111/gcb.16122
Contributor Information
Claudia Guidi, Email: claudia.guidi@wsl.ch.
Frank Hagedorn, Email: frank.hagedorn@wsl.ch.
DATA AVAILABILITY STATEMENT
The data that support the findings of this study are openly available in EnviDat at: https://doi.org/10.16904/envidat.281.
REFERENCES
- Alban, D. H. , & Berry, E. C. (1994). Effects of earthworm invasion on morphology, carbon, and nitrogen of a forest soil. Applied Soil Ecology, 1(3), 243–249. 10.1016/0929-1393(94)90015-9 [DOI] [Google Scholar]
- Aupic‐Samain, A. , Santonja, M. , Chomel, M. , Pereira, S. , Quer, E. , Lecareux, C. , Limousin, J.‐M. , Ourcival, J.‐M. , Simioni, G. , Gauquelin, T. , Fernandez, C. , & Baldy, V. (2021). Soil biota response to experimental rainfall reduction depends on the dominant tree species in mature Northern Mediterranean forests. Soil Biology and Biochemistry, 154, 108122. 10.1016/j.soilbio.2020.108122 [DOI] [Google Scholar]
- Beier, C. , Beierkuhnlein, C. , Wohlgemuth, T. , Penuelas, J. , Emmett, B. , Körner, C. , de Boeck, H. , Christensen, J. H. , Leuzinger, S. , Janssens, I. A. , & Hansen, K. (2012). Precipitation manipulation experiments–challenges and recommendations for the future. Ecology Letters, 15(8), 899–911. 10.1111/j.1461-0248.2012.01793.x [DOI] [PubMed] [Google Scholar]
- Blankinship, J. C. , Niklaus, P. A. , & Hungate, B. A. (2011). A meta‐analysis of responses of soil biota to global change. Oecologia, 165(3), 553–565. 10.1007/s00442-011-1909-0 [DOI] [PubMed] [Google Scholar]
- Bohlen, P. J. , Pelletier, D. M. , Groffman, P. M. , Fahey, T. J. , & Fisk, M. C. (2004). Influence of earthworm invasion on redistribution and retention of soil carbon and nitrogen in northern temperate forests. Ecosystems, 7(1), 13–27. 10.1007/s10021-003-0127-y [DOI] [Google Scholar]
- Bosch, J. , Varliero, G. , Hallsworth, J. E. , Dallas, T. D. , Hopkins, D. , Frey, B. , Kong, W. , Lebre, P. , Makhalanyane, T. P. , & Cowan, D. A. (2021). Microbial anhydrobiosis. Environmental Microbiology, 23(11), 6377–6390. 10.1111/1462-2920.15699 [DOI] [PubMed] [Google Scholar]
- Bossuyt, H. , Six, J. , & Hendrix, P. F. (2005). Protection of soil carbon by microaggregates within earthworm casts. Soil Biology and Biochemistry, 37(2), 251–258. 10.1016/j.soilbio.2004.07.035 [DOI] [Google Scholar]
- Brown, V. K. , & Gange, A. C. (1990). Insect herbivory below ground. In Advances in ecological research (Vol. 20, pp. 1–58). Elsevier. [Google Scholar]
- Brunner, I. , Herzog, C. , Galiano, L. , & Gessler, A. (2019). Plasticity of fine‐root traits under long‐term irrigation of a water‐limited Scots pine forest. Frontiers in Plant Science, 10, 701. 10.3389/fpls.2019.00701 [DOI] [PMC free article] [PubMed] [Google Scholar]
- Brunner, I. , Pannatier, E. G. , Frey, B. , Rigling, A. , Landolt, W. , Zimmermann, S. , & Dobbertin, M. (2009). Morphological and physiological responses of Scots pine fine roots to water supply in a dry climatic region in Switzerland. Tree Physiology, 29(4), 541–550. 10.1093/treephys/tpn046 [DOI] [PubMed] [Google Scholar]
- Büntgen, U. , Urban, O. , Krusic, P. J. , Rybníček, M. , Kolář, T. , Kyncl, T. , Ač, A. , Koňasová, E. , Čáslavský, J. , Esper, J. , Wagner, S. , Saurer, M. , Tegel, W. , Dobrovolný, P. , Cherubini, P. , Reinig, F. , & Trnka, M. (2021). Recent European drought extremes beyond Common Era background variability. Nature Geoscience, 14(4), 190–196. 10.1038/s41561-021-00698-0 [DOI] [Google Scholar]
- Carley, W. W. (1978). Water economy of the earthworm Lumbricus terrestris L.: Coping with the terrestrial environment. Journal of Experimental Zoology, 205(1), 71–78. 10.1002/jez.1402050110 [DOI] [Google Scholar]
- Chamberlain, P. M. , McNamara, N. P. , Chaplow, J. , Stott, A. W. , & Black, H. I. (2006). Translocation of surface litter carbon into soil by Collembola. Soil Biology and Biochemistry, 38(9), 2655–2664. 10.1016/j.soilbio.2006.03.021 [DOI] [Google Scholar]
- Ciais, P. , Reichstein, M. , Viovy, N. , Granier, A. , Ogée, J. , Allard, V. , Aubinet, M. , Buchmann, N. , Bernhofer, C. , & Carrara, A. (2005). Europe‐wide reduction in primary productivity caused by the heat and drought in 2003. Nature, 437(7058), 529–533. [DOI] [PubMed] [Google Scholar]
- Clarke, K. , & Gorley, R. (2015). Getting started with PRIMER v7. PRIMER‐E: Plymouth, Plymouth Marine Laboratory, 20. [Google Scholar]
- Cotrufo, M. , Alberti, G. , Inglima, I. , Marjanović, H. , LeCain, D. , Zaldei, A. , Peressotti, A. , & Miglietta, F. (2011). Decreased summer drought affects plant productivity and soil carbon dynamics in a Mediterranean woodland. Biogeosciences, 8(9), 2729–2739. 10.5194/bg-8-2729-2011 [DOI] [Google Scholar]
- Cotrufo, M. F. , Soong, J. L. , Horton, A. J. , Campbell, E. E. , Haddix, M. L. , Wall, D. H. , & Parton, W. J. (2015). Formation of soil organic matter via biochemical and physical pathways of litter mass loss. Nature Geoscience, 8(10), 776–779. 10.1038/ngeo2520 [DOI] [Google Scholar]
- Cragg, R. G. , & Bardgett, R. D. (2001). How changes in soil faunal diversity and composition within a trophic group influence decomposition processes. Soil Biology and Biochemistry, 33(15), 2073–2081. 10.1016/S0038-0717(01)00138-9 [DOI] [Google Scholar]
- Crossley, D. , & Blair, J. M. (1991). A high‐efficiency, “low‐technology” Tullgren‐type extractor for soil microarthropods. Agriculture, Ecosystems & Environment, 34(1–4), 187–192. 10.1016/0167-8809(91)90104-6 [DOI] [Google Scholar]
- De Cáceres, M. , Legendre, P. , & Moretti, M. (2010). Improving indicator species analysis by combining groups of sites. Oikos, 119(10), 1674–1684. 10.1111/j.1600-0706.2010.18334.x [DOI] [Google Scholar]
- Dence, C. W. (1992). The determination of lignin. In Lin S. Y., & Dence C. W. (Eds.), Methods in Lignin Chemistry. Springer Series in Wood Science (pp. 33–61). Springer. [Google Scholar]
- Deng, L. , Peng, C. , Kim, D.‐G. , Li, J. , Liu, Y. , Hai, X. , Liu, Q. , Huang, C. , Shangguan, Z. , & Kuzyakov, Y. (2020). Drought effects on soil carbon and nitrogen dynamics in global natural ecosystems: A meta‐analysis. Earth‐Science Reviews, 214, 103501. [Google Scholar]
- Dijkstra, P. , Ishizu, A. , Doucett, R. , Hart, S. C. , Schwartz, E. , Menyailo, O. V. , & Hungate, B. A. (2006). 13C and 15N natural abundance of the soil microbial biomass. Soil Biology and Biochemistry, 38(11), 3257–3266. 10.1016/j.soilbio.2006.04.005 [DOI] [Google Scholar]
- Dobbertin, M. , Eilmann, B. , Bleuler, P. , Giuggiola, A. , Graf Pannatier, E. , Landolt, W. , Schleppi, P. , & Rigling, A. (2010). Effect of irrigation on needle morphology, shoot and stem growth in a drought‐exposed Pinus sylvestris forest. Tree Physiology, 30(3), 346–360. 10.1093/treephys/tpp123 [DOI] [PubMed] [Google Scholar]
- Eilmann, B. , Zweifel, R. , Buchmann, N. , Fonti, P. , & Rigling, A. (2009). Drought‐induced adaptation of the xylem in Scots pine and pubescent oak. Tree Physiology, 29(8), 1011–1020. 10.1093/treephys/tpp035 [DOI] [PubMed] [Google Scholar]
- Eisenhauer, N. , Cesarz, S. , Koller, R. , Worm, K. , & Reich, P. B. (2012). Global change belowground: Impacts of elevated CO2, nitrogen, and summer drought on soil food webs and biodiversity. Global Change Biology, 18(2), 435–447. 10.1111/j.1365-2486.2011.02555.x [DOI] [Google Scholar]
- Eisenhauer, N. , Partsch, S. , Parkinson, D. , & Scheu, S. (2007). Invasion of a deciduous forest by earthworms: Changes in soil chemistry, microflora, microarthropods and vegetation. Soil Biology and Biochemistry, 39(5), 1099–1110. 10.1016/j.soilbio.2006.12.019 [DOI] [Google Scholar]
- Farquhar, G. D. , O'Leary, M. H. , & Berry, J. A. (1982). On the relationship between carbon isotope discrimination and the intercellular carbon dioxide concentration in leaves. Functional Plant Biology, 9(2), 121–137. 10.1071/PP9820121 [DOI] [Google Scholar]
- Feichtinger, L. M. , Eilmann, B. , Buchmann, N. , & Rigling, A. (2015). Trait‐specific responses of Scots pine to irrigation on a short vs long time scale. Tree Physiology, 35(2), 160–171. 10.1093/treephys/tpu114 [DOI] [PubMed] [Google Scholar]
- Filser, J. , Faber, J. H. , Tiunov, A. V. , Brussaard, L. , Frouz, J. , De Deyn, G. , Uvarov, A. V. , Berg, M. P. , Lavelle, P. , Loreau, M. , Wall, D. H. , Querner, P. , Eijsackers, H. , & Jiménez, J. J. (2016). Soil fauna: Key to new carbon models. Soil, 2(4), 565–582. 10.5194/soil-2-565-2016 [DOI] [Google Scholar]
- Foster, R. (1988). Microenvironments of soil microorganisms. Biology and Fertility of Soils, 6(3), 189–203. 10.1007/BF00260816 [DOI] [Google Scholar]
- Frouz, J. (2018). Effects of soil macro‐ and mesofauna on litter decomposition and soil organic matter stabilization. Geoderma, 332, 161–172. 10.1016/j.geoderma.2017.08.039 [DOI] [Google Scholar]
- Gao, D. , Joseph, J. , Werner, R. A. , Brunner, I. , Zürcher, A. , Hug, C. , Wang, A. , Zhao, C. , Bai, E. , Meusburger, K. , Gessler, A. , & Hagedorn, F. (2021). Drought alters the carbon footprint of trees in soils—tracking the spatio‐temporal fate of 13C‐labelled assimilates in the soil of an old‐growth pine forest. Global Change Biology, 27(11), 2491–2506. 10.1111/gcb.15557 [DOI] [PMC free article] [PubMed] [Google Scholar]
- García‐Palacios, P. , Maestre, F. T. , Kattge, J. , & Wall, D. H. (2013). Climate and litter quality differently modulate the effects of soil fauna on litter decomposition across biomes. Ecology Letters, 16(8), 1045–1053. 10.1111/ele.12137 [DOI] [PMC free article] [PubMed] [Google Scholar]
- Gerard, B. (1967). Factors affecting earthworms in pastures. The Journal of Animal Ecology, 36, 235–252. 10.2307/3024 [DOI] [Google Scholar]
- González, G. , & Seastedt, T. R. (2001). Soil fauna and plant litter decomposition in tropical and subalpine forests. Ecology, 82(4), 955–964. 10.1890/0012-9658(2001)082%5B0955:SFAPLD%5D2.0.CO;2 [DOI] [Google Scholar]
- Gosheva, S. , Walthert, L. , Niklaus, P. A. , Zimmermann, S. , Gimmi, U. , & Hagedorn, F. (2017). Reconstruction of historic forest cover changes indicates minor effects on carbon stocks in Swiss forest soils. Ecosystems, 20(8), 1512–1528. 10.1007/s10021-017-0129-9 [DOI] [Google Scholar]
- Green, P. , & MacLeod, C. J. (2016). SIMR: An R package for power analysis of generalized linear mixed models by simulation. Methods in Ecology and Evolution, 7(4), 493–498. [Google Scholar]
- Guidi, C. , Meusburger, K. , Frey, B. , & Hagedorn, F. (2022). Soil fauna drives SOC storage in a long‐term irrigated dry pine forest. EnviDat. 10.16904/envidat.281 [DOI] [PMC free article] [PubMed] [Google Scholar]
- Gunn, A. (1992). The use of mustard to estimate earthworm populations. Pedobiologia, 36(2), 65–67. [Google Scholar]
- Hartmann, M. , Brunner, I. , Hagedorn, F. , Bardgett, R. D. , Stierli, B. , Herzog, C. , Chen, X. , Zingg, A. , Graf‐Pannatier, E. , Rigling, A. , & Frey, B. (2017). A decade of irrigation transforms the soil microbiome of a semi‐arid pine forest. Molecular Ecology, 26(4), 1190–1206. 10.1111/mec.13995 [DOI] [PubMed] [Google Scholar]
- Herzog, C. , Hartmann, M. , Frey, B. , Stierli, B. , Rumpel, C. , Buchmann, N. , & Brunner, I. (2019). Microbial succession on decomposing root litter in a drought‐prone Scots pine forest. The ISME Journal, 13(9), 2346–2362. 10.1038/s41396-019-0436-6 [DOI] [PMC free article] [PubMed] [Google Scholar]
- Herzog, C. , Steffen, J. , Pannatier, E. G. , Hajdas, I. , & Brunner, I. (2014). Nine years of irrigation cause vegetation and fine root shifts in a water‐limited pine forest. PLoS One, 9(5), e96321. 10.1371/journal.pone.0096321 [DOI] [PMC free article] [PubMed] [Google Scholar]
- Holmstrup, M. , Damgaard, C. , Schmidt, I. K. , Arndal, M. F. , Beier, C. , Mikkelsen, T. N. , Ambus, P. , Larsen, K. S. , Pilegaard, K. , Michelsen, A. , Andresen, L. C. , Haugwitz, M. , Bergmark, L. , Priemé, A. , Zaitsev, A. S. , Georgieva, S. , Dam, M. , Vestergård, M. , & Christensen, S. (2017). Long‐term and realistic global change manipulations had low impact on diversity of soil biota in temperate heathland. Scientific Reports, 7(1), 1–11. 10.1038/srep41388 [DOI] [PMC free article] [PubMed] [Google Scholar]
- Holmstrup, M. , Sjursen, H. , Ravn, H. , & Bayley, M. (2001). Dehydration tolerance and water vapour absorption in two species of soil‐dwelling Collembola by accumulation of sugars and polyols. Functional Ecology, 15(5), 647–653. 10.1046/j.0269-8463.2001.00565.x [DOI] [Google Scholar]
- Holmstrup, M. , Sørensen, J. G. , Schmidt, I. K. , Nielsen, P. L. , Mason, S. , Tietema, A. , Smith, A. R. , Bataillon, T. , Beier, C. , & Ehlers, B. K. (2013). Soil microarthropods are only weakly impacted after 13 years of repeated drought treatment in wet and dry heathland soils. Soil Biology and Biochemistry, 66, 110–118. 10.1016/j.soilbio.2013.06.023 [DOI] [Google Scholar]
- Huang, S. , Ye, G. , Lin, J. , Chen, K. , Xu, X. , Ruan, H. , Tan, F. , & Chen, H. Y. (2018). Autotrophic and heterotrophic soil respiration responds asymmetrically to drought in a subtropical forest in the Southeast China. Soil Biology and Biochemistry, 123, 242–249. 10.1016/j.soilbio.2018.04.029 [DOI] [Google Scholar]
- Joseph, J. , Gao, D. , Backes, B. , Bloch, C. , Brunner, I. , Gleixner, G. , Haeni, M. , Hartmann, H. , Hoch, G. , Hug, C. , Kahmen, A. , Lehmann, M. M. , Li, M.‐H. , Luster, J. , Peter, M. , Poll, C. , Rigling, A. , Rissanen, K. A. , Ruehr, N. K. , … Gessler, A. (2020). Rhizosphere activity in an old‐growth forest reacts rapidly to changes in soil moisture and shapes whole‐tree carbon allocation. Proceedings of the National Academy of Sciences, 117(40), 24885–24892. 10.1073/pnas.2014084117 [DOI] [PMC free article] [PubMed] [Google Scholar]
- Kærsgaard, C. W. , Holmstrup, M. , Malte, H. , & Bayley, M. (2004). The importance of cuticular permeability, osmolyte production and body size for the desiccation resistance of nine species of Collembola. Journal of Insect Physiology, 50(1), 5–15. 10.1016/j.jinsphys.2003.09.003 [DOI] [PubMed] [Google Scholar]
- Kampichler, C. , & Bruckner, A. (2009). The role of microarthropods in terrestrial decomposition: A meta‐analysis of 40 years of litterbag studies. Biological Reviews, 84(3), 375–389. 10.1111/j.1469-185X.2009.00078.x [DOI] [PubMed] [Google Scholar]
- Karberg, N. J. , Scott, N. A. , & Giardina, C. P. (2008). Methods for estimating litter decomposition. In Hoover C. M. (Ed.), Field measurements for forest carbon monitoring (pp. 103–111). Springer. 10.1007/978-1-4020-8506-2_8 [DOI] [Google Scholar]
- Keith, D. M. , Johnson, E. A. , & Valeo, C. (2010). Moisture cycles of the forest floor organic layer (F and H layers) during drying. Water Resources Research, 46, W07529(7), 1–14. 10.1029/2009WR007984 [DOI] [Google Scholar]
- Köhler, G. (2015). Müller/Bährmann Bestimmung wirbelloser Tiere. Bildtafeln für zoologische Bestimmungsübungen und Exkursionen. Springer Spektrum. 10.1007/978-3-642-55395-0 [DOI] [Google Scholar]
- Lawrence, A. P. , & Bowers, M. A. (2002). A test of the ‘hot’ mustard extraction method of sampling earthworms. Soil Biology and Biochemistry, 34(4), 549–552. 10.1016/S0038-0717(01)00211-5 [DOI] [Google Scholar]
- Lindberg, N. , & Bengtsson, J. (2006). Recovery of forest soil fauna diversity and composition after repeated summer droughts. Oikos, 114(3), 494–506. 10.1111/j.2006.0030-1299.14396.x [DOI] [Google Scholar]
- Lindberg, N. , Engtsson, J. B. , & Persson, T. (2002). Effects of experimental irrigation and drought on the composition and diversity of soil fauna in a coniferous stand. Journal of Applied Ecology, 39(6), 924–936. 10.1046/j.1365-2664.2002.00769.x [DOI] [Google Scholar]
- Macfadyen, A. (1961). Improved funnel‐type extractors for soil arthropods. The Journal of Animal Ecology, 30, 171–184. 10.2307/2120 [DOI] [Google Scholar]
- Manzoni, S. , Schimel, J. P. , & Porporato, A. (2012). Responses of soil microbial communities to water stress: Results from a meta‐analysis. Ecology, 93(4), 930–938. 10.1890/11-0026.1 [DOI] [PubMed] [Google Scholar]
- McMurdie, P. J. , & Holmes, S. (2013). phyloseq: An R package for reproducible interactive analysis and graphics of microbiome census data. PLoS One, 8(4), e61217. 10.1371/journal.pone.0061217 [DOI] [PMC free article] [PubMed] [Google Scholar]
- Moyano, F. E. , Vasilyeva, N. , Bouckaert, L. , Cook, F. , Craine, J. , Curiel Yuste, J. , Don, A. , Epron, D. , Formanek, P. , Franzluebbers, A. , Ilstedt, U. , Kätterer, T. , Orchard, V. , Reichstein, M. , Rey, A. , Ruamps, L. , Subke, J.‐A. , Thomsen, I. K. , & Chenu, C. (2012). The moisture response of soil heterotrophic respiration: interaction with soil properties. Biogeosciences, 9(3), 1173–1182. 10.5194/bg-9-1173-2012 [DOI] [Google Scholar]
- Nielsen, U. N. (2019). Soil fauna assemblages: Global to Local Scales. Cambridge University Press. 10.1017/9781108123518 [DOI] [Google Scholar]
- Nielsen, U. N. , Ayres, E. , Wall, D. H. , & Bardgett, R. D. (2011). Soil biodiversity and carbon cycling: A review and synthesis of studies examining diversity–function relationships. European Journal of Soil Science, 62(1), 105–116. 10.1111/j.1365-2389.2010.01314.x [DOI] [Google Scholar]
- O'Connor, F. (1957). An ecological study of the enchytraeid worm population of a coniferous forest soil. Oikos, 8(2), 161–199. 10.2307/3564998 [DOI] [Google Scholar]
- Pannatier, E. G. , Dobbertin, M. , Heim, A. , Schmitt, M. , Thimonier, A. , Waldner, P. , & Frey, B. (2012). Response of carbon fluxes to the 2003 heat wave and drought in three mature forests in Switzerland. Biogeochemistry, 107(1), 295–317. 10.1007/s10533-010-9554-y [DOI] [Google Scholar]
- Peguero, G. , Sol, D. , Arnedo, M. , Petersen, H. , Salmon, S. , Ponge, J.‐F. , Maspons, J. , Emmett, B. , Beier, C. , Schmidt, I. K. , Tietema, A. , De Angelis, P. , Kovács‐Láng, E. , Kröel‐Dulay, G. , Estiarte, M. , Bartrons, M. , Holmstrup, M. , Janssens, I. A. , & Peñuelas, J. (2019). Fast attrition of springtail communities by experimental drought and richness–decomposition relationships across Europe. Global Change Biology, 25(8), 2727–2738. 10.1111/gcb.14685 [DOI] [PubMed] [Google Scholar]
- Pereira, S. , Burešová, A. , Kopecky, J. , Mádrová, P. , Aupic‐Samain, A. , Fernandez, C. , Baldy, V. , & Sagova‐Mareckova, M. (2019). Litter traits and rainfall reduction alter microbial litter decomposers: The evidence from three Mediterranean forests. FEMS Microbiology Ecology, 95(12). 10.1093/femsec/fiz168 [DOI] [PubMed] [Google Scholar]
- Pinheiro, J. C. , & Bates, D. M. (2000). Linear mixed‐effects models: Basic concepts and examples. In Chambers J., Eddy W., Härdle W., Sheather S. & Tierney L. (Eds.), Mixed‐effects models in S and S‐Plus (pp. 3–56). Springer‐Verlag. [Google Scholar]
- Pinheiro, J. , Bates, D. , DebRoy, S. , & Sarkar, D. (2019). nlme: Linear and nonlinear mixed effects models. R package version 3.1‐140. https://CRAN.R‐project.org/package=nlme [Google Scholar]
- Placella, S. A. , Brodie, E. L. , & Firestone, M. K. (2012). Rainfall‐induced carbon dioxide pulses result from sequential resuscitation of phylogenetically clustered microbial groups. Proceedings of the National Academy of Sciences, 109(27), 10931–10936. 10.1073/pnas.1204306109 [DOI] [PMC free article] [PubMed] [Google Scholar]
- Prescott, C. (2005). Decomposition and mineralization of nutrients from litter and humus. In BassiriRad H. (Ed.), Nutrient acquisition by plants: An ecological perspective (pp. 15–41). Springer. [Google Scholar]
- Prietzel, J. , Zimmermann, L. , Schubert, A. , & Christophel, D. (2016). Organic matter losses in German Alps forest soils since the 1970s most likely caused by warming. Nature Geoscience, 9(7), 543–548. 10.1038/ngeo2732 [DOI] [Google Scholar]
- R Core Team . (2019). R: A language and environment for statistical computing. R Foundation for Statistical Computing. [Google Scholar]
- Reichstein, M. , Bahn, M. , Ciais, P. , Frank, D. , Mahecha, M. D. , Seneviratne, S. I. , Zscheischler, J. , Beer, C. , Buchmann, N. , & Frank, D. C. (2013). Climate extremes and the carbon cycle. Nature, 500(7462), 287–295. [DOI] [PubMed] [Google Scholar]
- Riutta, T. , Slade, E. M. , Bebber, D. P. , Taylor, M. E. , Malhi, Y. , Riordan, P. , Macdonald, D. W. , & Morecroft, M. D. (2012). Experimental evidence for the interacting effects of forest edge, moisture and soil macrofauna on leaf litter decomposition. Soil Biology and Biochemistry, 49, 124–131. 10.1016/j.soilbio.2012.02.028 [DOI] [Google Scholar]
- Rodà, F. , Gracia, C. A. , Lange, C. , Caldwell, M. , Heldmaier, G. , Bellot, J. , Lange, O. , Mooney, H. , & Sommer, U. (1999). Ecology of Mediterranean evergreen oak forests (Vol. 37). Springer Science & Business Media. [Google Scholar]
- Santonja, M. , Fernandez, C. , Proffit, M. , Gers, C. , Gauquelin, T. , Reiter, I. M. , Cramer, W. , & Baldy, V. (2017). Plant litter mixture partly mitigates the negative effects of extended drought on soil biota and litter decomposition in a Mediterranean oak forest. Journal of Ecology, 105(3), 801–815. 10.1111/1365-2745.12711 [DOI] [Google Scholar]
- Schimel, J. P. (2018). Life in dry soils: effects of drought on soil microbial communities and processes. Annual Review of Ecology, Evolution, and Systematics, 49, 409–432. 10.1146/annurev-ecolsys-110617-062614 [DOI] [Google Scholar]
- Schindlbacher, A. , Wunderlich, S. , Borken, W. , Kitzler, B. , Zechmeister‐Boltenstern, S. , & Jandl, R. (2012). Soil respiration under climate change: prolonged summer drought offsets soil warming effects. Global Change Biology, 18(7), 2270–2279. 10.1111/j.1365-2486.2012.02696.x [DOI] [Google Scholar]
- Schrumpf, M. , Schulze, E. , Kaiser, K. , & Schumacher, J. (2011). How accurately can soil organic carbon stocks and stock changes be quantified by soil inventories? Biogeosciences, 8(5), 1193–1212. 10.5194/bg-8-1193-2011 [DOI] [Google Scholar]
- Seneviratne, S. , Zhang, X. , Adnan, M. , Badi, W. , Dereczynski, C. , Di Luca, A. , Ghosh, G. , Iskandar, I. , Kossin, J. , Lewis, S. , Otto, F. , Pinto, I. , Satoh, M. , Vicente‐Serrano, S. M. , Wehner, M. , & Zhou, B. (2021). Weather and climate extreme events in a changing climate. In Masson‐Delmotte V., Zhai P., Pirani A., Connors S. L., Péan C., Berger S., Caud N., Chen Y., Goldfarb L., Gomis M. I., Huang M., Leitzell K., Lonnoy E., Matthews J. B. R., Maycock T. K., Waterfield T., Yelekçi O., Yu R., & Zhou B. (Eds.) Climate Change 2021: The Physical Science Basis. Contribution of Working Group I to the Sixth Assessment Report of the Intergovernmental Panel on Climate Change. Cambridge University Press. In Press. [Google Scholar]
- Siebert, J. , Sünnemann, M. , Auge, H. , Berger, S. , Cesarz, S. , Ciobanu, M. , Guerrero‐Ramírez, N. R. , & Eisenhauer, N. (2019). The effects of drought and nutrient addition on soil organisms vary across taxonomic groups, but are constant across seasons. Scientific Reports, 9(1), 1–12. 10.1038/s41598-018-36777-3 [DOI] [PMC free article] [PubMed] [Google Scholar]
- Soong, J. L. , Vandegehuchte, M. L. , Horton, A. J. , Nielsen, U. N. , Denef, K. , Shaw, E. A. , de Tomasel, C. M. , Parton, W. , Wall, D. H. , & Cotrufo, M. F. (2016). Soil microarthropods support ecosystem productivity and soil C accrual: evidence from a litter decomposition study in the tallgrass prairie. Soil Biology and Biochemistry, 92, 230–238. 10.1016/j.soilbio.2015.10.014 [DOI] [Google Scholar]
- Stevnbak, K. , Maraldo, K. , Georgieva, S. , Bjørnlund, L. , Beier, C. , Schmidt, I. K. , & Christensen, S. (2012). Suppression of soil decomposers and promotion of long‐lived, root herbivorous nematodes by climate change. European Journal of Soil Biology, 52, 1–7. 10.1016/j.ejsobi.2012.04.001 [DOI] [Google Scholar]
- Stocker, T. (2014). Climate change 2013: the physical science basis: Working Group I contribution to the Fifth assessment report of the Intergovernmental Panel on Climate Change. Cambridge University Press. [Google Scholar]
- Swain, T. , & Hillis, W. (1959). The phenolic constituents of Prunus domestica. I.—The quantitative analysis of phenolic constituents. Journal of the Science of Food and Agriculture, 10(1), 63–68. [Google Scholar]
- Talmon, Y. , Sternberg, M. , & Gruenzweig, J. M. (2011). Impact of rainfall manipulations and biotic controls on soil respiration in Mediterranean and desert ecosystems along an aridity gradient. Global Change Biology, 17(2), 1108–1118. 10.1111/j.1365-2486.2010.02285.x [DOI] [Google Scholar]
- Taylor, A. R. , & Wolters, V. (2005). Responses of oribatid mite communities to summer drought: The influence of litter type and quality. Soil Biology and Biochemistry, 37(11), 2117–2130. 10.1016/j.soilbio.2005.03.015 [DOI] [Google Scholar]
- Taylor, J. (1997). Introduction to error analysis, the study of uncertainties in physical measurements (2nd ed.). University Science Books. [Google Scholar]
- Thakur, M. P. , Reich, P. B. , Hobbie, S. E. , Stefanski, A. , Rich, R. , Rice, K. E. , Eddy, W. C. , & Eisenhauer, N. (2018). Reduced feeding activity of soil detritivores under warmer and drier conditions. Nature Climate Change, 8(1), 75–78. 10.1038/s41558-017-0032-6 [DOI] [PMC free article] [PubMed] [Google Scholar]
- Walthert, L. , Graf, U. , Kammer, A. , Luster, J. , Pezzotta, D. , Zimmermann, S. , & Hagedorn, F. (2010). Determination of organic and inorganic carbon, δ13C, and nitrogen in soils containing carbonates after acid fumigation with HCl. Journal of Plant Nutrition and Soil Science, 173(2), 207–216. [Google Scholar]
- Weigmann, G. (2006). Hornmilben (Oribatida). In: Dahl F. (Ed.). Die Tierwelt Deutschlands und der angrenzenden Meeresteile, 76. Teil. Goecke and Evers, Keltern. Fischer. [Google Scholar]
- Wiesmeier, M. , Prietzel, J. , Barthold, F. , Spörlein, P. , Geuß, U. , Hangen, E. , Reischl, A. , Schilling, B. , von Lützow, M. , & Kögel‐Knabner, I. (2013). Storage and drivers of organic carbon in forest soils of southeast Germany (Bavaria)—Implications for carbon sequestration. Forest Ecology and Management, 295, 162–172. 10.1016/j.foreco.2013.01.025 [DOI] [Google Scholar]
- Zhou, X. , Zhou, L. , Nie, Y. , Fu, Y. , Du, Z. , Shao, J. , Zheng, Z. , & Wang, X. (2016). Similar responses of soil carbon storage to drought and irrigation in terrestrial ecosystems but with contrasting mechanisms: A meta‐analysis. Agriculture, Ecosystems & Environment, 228, 70–81. 10.1016/j.agee.2016.04.030 [DOI] [Google Scholar]
- Zuur, A. F. , Ieno, E. N. , Walker, N. J. , Saveliev, A. A. , & Smith, G. M. (2009). Mixed effects models and extensions in ecology with R. Springer. [Google Scholar]
Associated Data
This section collects any data citations, data availability statements, or supplementary materials included in this article.
Supplementary Materials
Supplementary Material
Table S10
Table S11
Table S12
Table S13
Data Availability Statement
The data that support the findings of this study are openly available in EnviDat at: https://doi.org/10.16904/envidat.281.