Abstract
Objective:
Autosomal recessive human thymidine kinase 2 (TK2) mutations cause TK2 deficiency, which typically manifests as a progressive and fatal mitochondrial myopathy in infants and children. Treatment with pyrimidine deoxynucleosides deoxycytidine and thymidine ameliorates mitochondrial defects and extends the lifespan of Tk2 knock-in mouse (Tk2KI) and compassionate use deoxynucleoside therapy in TK2 deficient patients have shown promising indications of efficacy. To augment therapy for Tk2 deficiency, we assessed gene therapy alone and in combination with deoxynucleoside therapy in Tk2KI mice.
Methods:
We generated pAAVsc CB6 PI vectors containing human TK2 cDNA (TK2). Adeno-associated virus (AAV)-TK2 was administered to Tk2KI, which were serially assessed for weight, motor functions, and survival as well as biochemical functions in tissues. AAV-TK2 treated mice were further treated with deoxynucleosides.
Results:
AAV9 delivery of human TK2 cDNA to Tk2KI mice efficiently rescued Tk2 activity in all the tissues tested except the kidneys, delayed disease onset, and increased lifespan. Sequential treatment of Tk2KI mice with AAV9 first followed by AAV2 at different ages allowed us to reduce the viral dose while further prolonging the lifespan. Furthermore, addition of deoxycytidine and deoxythymidine supplementation to AAV9 + AAV2 treated Tk2KI mice dramatically improved mtDNA copy numbers in the liver and kidneys, animal growth, and lifespan.
Interpretation:
Our data indicate that AAV-TK2 gene therapy as well as combination deoxynucleoside and gene therapies is more effective in Tk2KI mice than pharmacological alone. Thus, combination of gene therapy with substrate enhancement is a promising therapeutic approach for TK2 deficiency and potentially other metabolic disorders.
Thymidine kinase 2 (TK2), a ubiquitously expressed enzyme critical for the salvage pathways for pyrimidine within mitochondria, phosphorylates both deoxycytidine (dC) and deoxythymidine (dT) to generate deoxycytidine monophosphate (dCMP) and deoxythymidine monophosphate (dTMP). Those deoxynucleoside monophosphates are subsequently phosphorylated to dCTP and dTTP, which are vital building blocks for replication and maintenance of mitochondrial DNA (mtDNA) particularly in post-mitotic cells. Autosomal recessive mutations in the nuclear gene TK2 cause TK2 deficiency, a rare and devastating form of mtDNA depletion syndrome (MDS). TK2 deficiency manifests most frequently as a progressive and fatal mitochondrial myopathy in infants and children, although around 20% of patients develop the disease during adolescence or adulthood.1 Studies of Tk2 homozygous p.His126Arg knock-in (Tk2KI) mice indicate that onset and tissue-specificity of the disease are modulated by expression of thymidine kinase 1 (TK1), which catalyze the first step of the cytosolic thymidine salvage pathway2–4.
Treatment of Tk2KI mice with the TK2 substrates, dC and dT, delays disease onset and prolongs the lifespan of the animals by up to 3-fold.5 Based upon this preclinical study, TK2 deficient patients have been treated with dC + dT in a compassionate use program and have shown improvements in limb weakness, respiratory, and swallowing functions, as well as prolonged survival.6
Nevertheless, response to dC + dT therapy in the Tk2KI mice is limited as it only delays onset and slow progression of the disease rather than halting or reversing the course. Several factors constrain the therapeutic response including: (1) rapid degradation of exogenously administered pyrimidine nucleosides by cytidine deaminase and thymidine phosphorylase (TP); (2) restricted delivery of dC and dT via nucleoside transporters into target tissues; and (3) cell-cycle and tissue-specific activities of deoxycytidine kinase (Dck) and thymidine kinase 1 (Tk1).4,7 The nucleoside kinases are particularly critical in Tk2KI mice that develop early central nervous system manifestations, because expression of Tk1 in the murine brain is low.2 Because all of these factors limit therapeutic response to dC + dT treatment, treatments aimed at restoring mitochondrial TK2 activity are needed.
Adeno-associated virus (AAV) is being widely used for in vivo gene therapy due to its safety profile, transduction efficiency, episomal persistence, and variety of serotypes with different tissue tropism.8 In fact, clinical trials using AAV vectors have reported a good safety profile, with minimal side effects, although high doses of AAV has caused liver toxicity.9–13
In this study, we demonstrate that transfer of the human TK2 cDNA using AAV9 efficiently rescues TK2 activity in all the tissues assessed except the kidneys, delayed disease onset, and increased lifespan of Tk2KI mice. Furthermore, sequential treatment with AAV9 first followed by AAV2 at a later age allowed us to reduce the overall viral dose while further prolonging the lifespan of the animals. Additional supplementation of Tk2KI-AAV9 + AAV2 mice with oral dC + dT further enhanced lifespan, growth, and mtDNA copy numbers in the liver and kidneys. These finding indicate that the combination of pharmacological and gene therapies is more potent than either therapy alone.
Materials and Methods
Vector Construction and Production
Thymidine kinase 2 human untagged clone (NM_004614) containing the cDNA for transcript variant 1 was purchased from OriGene Technologies, Inc. (Rockville MD; Fig 1A). The 1016 bp TK2 cDNA containing the full-length coding sequence was extracted by Eagl digestion. A pAAVsc CB6 PI vector described by Rashnonejad and colleagues14 was used to generate AAV9 and AAV2 virus containing TK2 cDNA under the regulation of the chicken beta-actin promoter and the cytomegalovirus (CMV) enhancer. AAV virons were produced and titrated as described.14 After generating blunt ends by treating vector and insert DNA with T4 DNA polymerase (New England Biolabs, Ipswich, MA), blunt-end ligation was used to insert TK2 cDNA into ClaI digested pAAVsc CB6 PI vector (Fig 1B).
FIGURE 1:
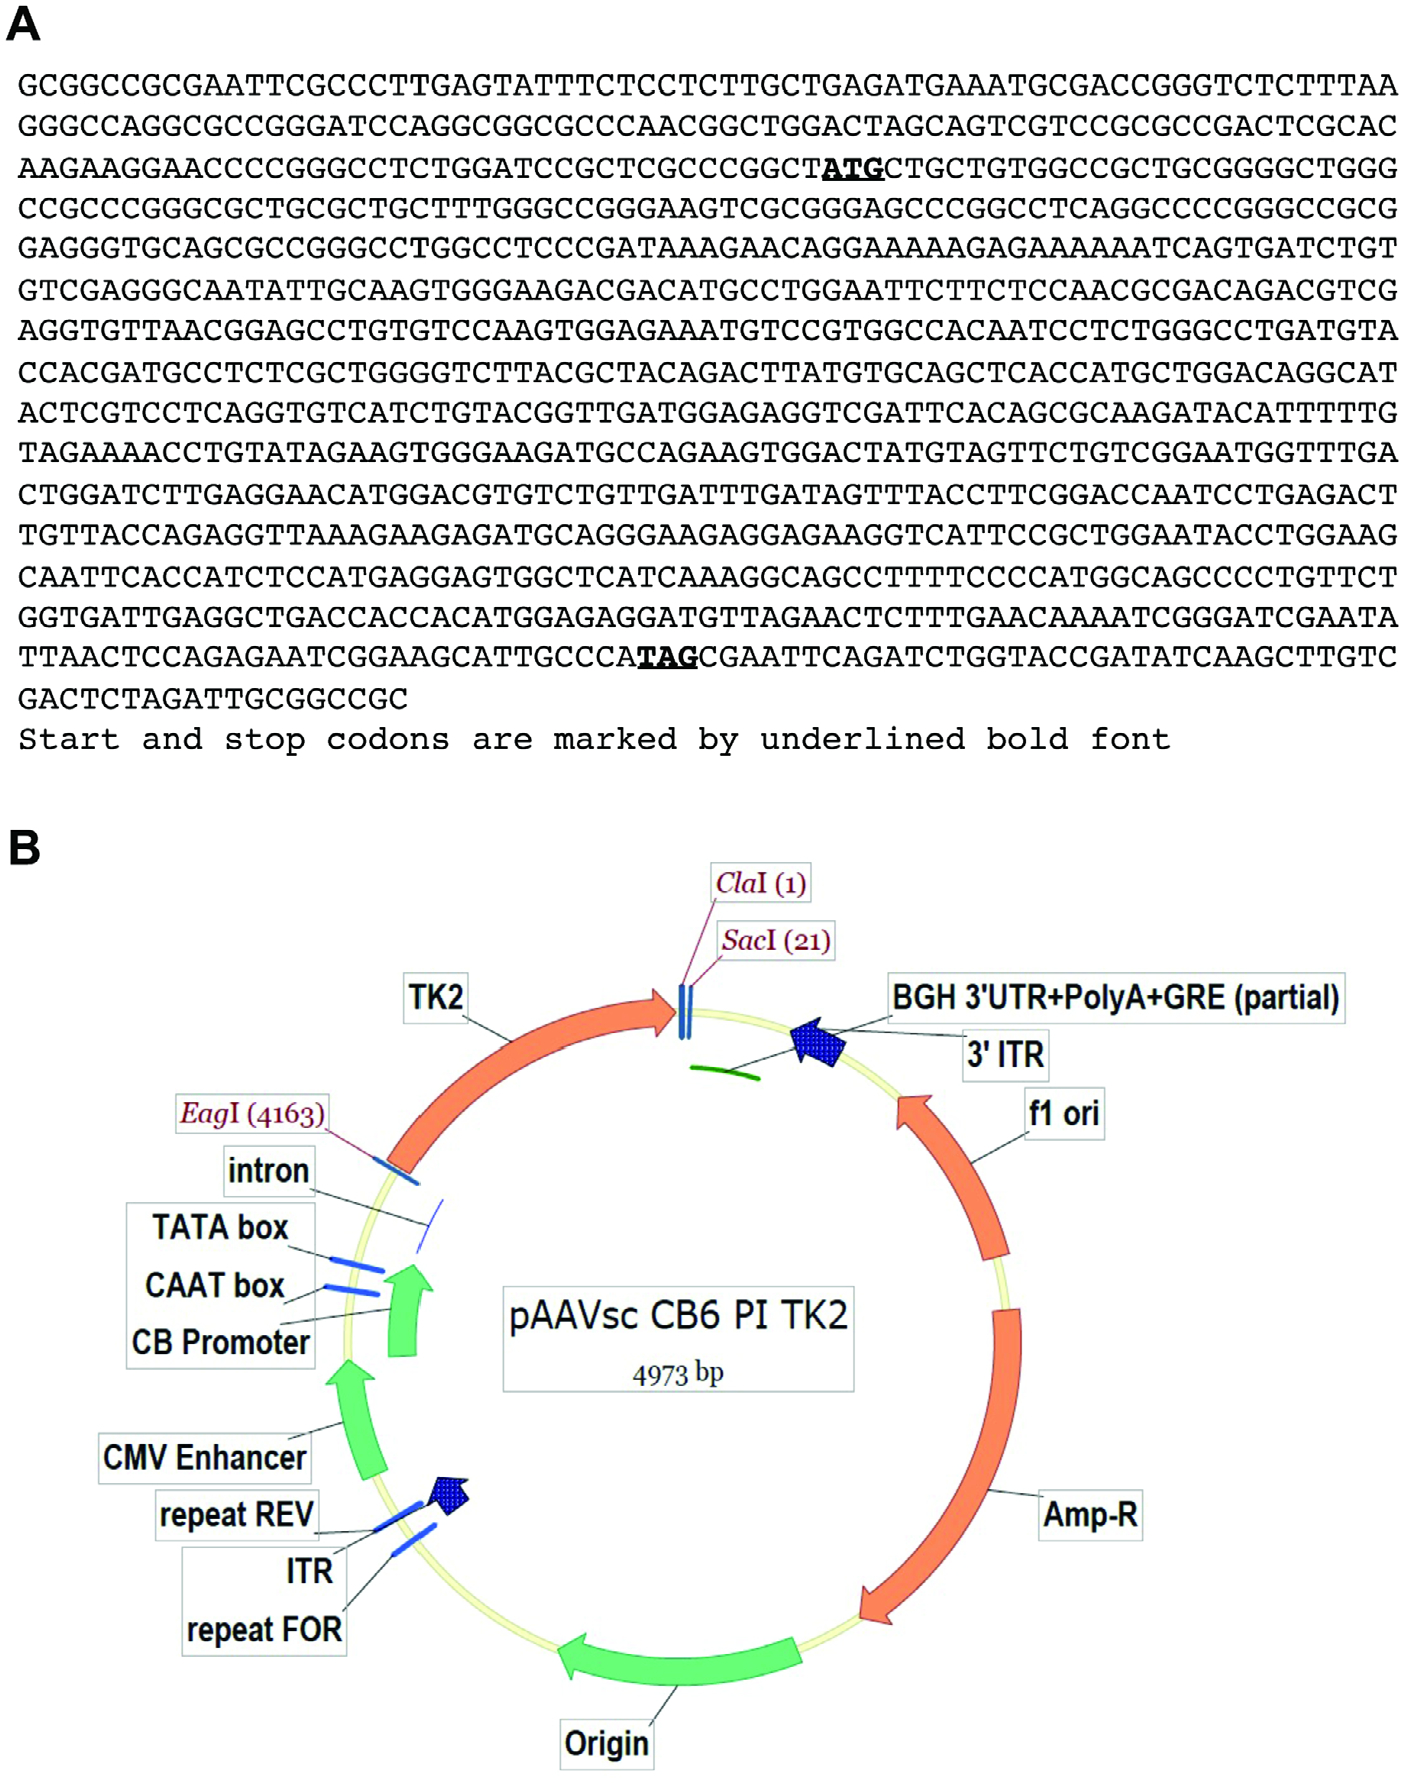
Design of AAV vectors. Panel (A) shows the sequence of the TK2 cDNA flanked by EagI restriction sites. Panel (B) shows the cDNA construct in pAAVsc CB6 PI vector. AAV = adeno-associated virus.
Mice
Generation and characterization of Tk2 H126N knock-in mice (B6.129S6-Tk2tm1Mihi/J) was previously reported.3 All experiments were performed according to a protocol approved by the Institutional Animal Care and Use Committee of the Columbia University Irving Medical Center, and are consistent with the National Institutes of Health Guide for the Care and Use of Laboratory Animals. Mice were housed and bred according to international standard conditions, with a 12-hour light and 12-hour dark cycle. Mice were euthanized if they lost more than 20% of their body weight (anorexia and/or weight loss), could not feed or hydrate, decreased urine/feces over 1–2 days, lost righting reflex or demonstrated reluctance to move, vocalized when approached or handled, manifested hunched posture/tucked abdomen scruffy/unkempt hair coat, anal or penile prolapse, or appeared moribund. After euthanasia, the brain, liver, kidneys, intestine, heart, and quadriceps muscle were collected for analyses.
Phenotype Assessment
Body weight was assessed daily.3 We recorded age-at-onset, types and severity of manifestations, side effects, treatment termination due to adverse events, and survival duration in treated and untreated Tk2KI mice. Behavior, survival time, and body weights of the mice were assessed daily from postnatal day 2.
Motor function was assessed with an accelerating rotarod performance test (Economex Rota-Rod; Columbus Instruments, Columbus, OH). The rotarod was started at 10 rpm and accelerated by 2.5 rpm every 10 seconds. After a training phase of 3 trials, 3 motor performances for each mouse were averaged and analyzed. Grip strength was measured using a Grip Strength Meter (Columbus Instruments). Three force measurements were recorded in each trial. Strength, measured by mass units (grams [g]), was normalized to whole body weight of each animal.
Treatment Administration and Experimental Plan
Two cohorts of animals composed by both Tk2WT and Tk2KI mice were treated with either 4.2 × 10¹⁰ or 4.2 × 10¹¹ vector genomes (vg) of AAV9-TK2 in a total volume of 35 μL at postnatal day 1 intravenously (retro-orbital injection). A third cohort of animals was treated with 2.1 × 10¹¹ vg of AAV9-TK2 in a total volume of 35 μL at postnatal day 1 intravenously (retro-orbital injection), and then treated with 1.05 × 10¹¹ vg of AAV2-TK2 in a total volume of 100 μL intravenously (tail vein injection) at postnatal day 29. A subgroup of this cohort was supplemented with dC and dT (520 mg/kg/day each) (Hongene Biotechnology USA, Morrisville, NC) in the drinking water from day 21, assuming a daily water consumption of 4 ml per mouse. In addition, we treated Tk2WT and Tk2KI mice with oral dC and dT (oral gavage, 520 mg/kg/day each) from postnatal day 4 to assess survival and molecular and biochemical assessments in mice treated with only deoxynucleosides at ages 13 and 29 days.
Human TK2 Gene Expression and Assessment of Vector Genomes per Nucleus
RNA was isolated using Trizol reagent (Thermo Fisher Scientific, Waltham, MA). The cDNA was synthesized from 500 ng of RNA using SuperScript VILO cDNA Synthesis Kit (Invitrogen, Waltham, MA). Real-time polymerase chain reaction (PCR) was performed in a StepOnePlus Real-Time PCR System (Applied Biosystems, Waltham, MA) using Taqman probes specific for the human TK2 transcript (Hs00936914; Thermo Fisher Scientific) and for the murine Tk2 transcript (Mm01250904; Thermo Fisher Scientific). Expression of murine Gapdh (Mm99999915; Thermo Fisher Scientific) was used as endogenous control. Data were analyzed using ddCt method. Taqman probes for human TK2 transcript and murine Gapdh were also used to assess vector genomes/nucleus. Standard curves using quantified copies of both vector and mouse genomes were used to calculate TK2 and Gapdh transcript copies. DNA samples were assayed by real-time PCR to calculate TK2 copies per 2 copies of Gapdh.
TK2 Activity
TK2 activity was measured in mitochondrial fractions prepared as follows: ~40 mg of tissue were suspended in 500 μL of MTSE buffer (210 mM d-mannitol, 70 mM sucrose, 10 mM Tris HCl pH 7.5, and 0.2 mM EGTA). Tissue samples were scissor minced and homogenized in glass-to-glass homogenizers. Homogenates were centrifuged at 1000× g for 5 minutes at 4°C. Supernatants containing mitochondrial fraction were used for measuring TK2 activity. TK2 activity was measured using tritium-labeled bromovinyl deoxyuridine as described,15 with the following modifications: DEAE filtermat filters (PerkinElmer, Waltham, MA) were used and washed twice for 5 minutes in 1 mM ammonium formate and once for 5 minutes in H2O. TK2 enzyme activity is expressed in pmol/hour/mg-protein.
Mitochondrial DNA Quantification
Real-time PCR was performed with the primers and probes for murine CoxI (mtDNA) and glyceraldehyde-3-phosphate dehydrogenase (Gapdh, nuclear DNA [nDNA]; Applied Biosystems) as described using ddCt method in a Step One Plus Real Time PCR System (Applied Biosystems).2 The mtDNA values were normalized to nDNA values and expressed as a percentage relative to wild-type (100%).
Mitochondrial DNA Deletions Assessment
Long-extension PCR was used to determine the presence of deletions in mtDNA, as described.16 Briefly, mouse mtDNA was amplified from 2 ng of total DNA using forward and reverse primers spanning mtDNA positions 488–510 and 4021–4040, respectively. LA Taq polymerase (TAKARA, Japan) was used under the following PCR conditions: 98°C for 10 seconds, 58°C for 30 seconds, and 60° C for 10 minutes, for 35 cycles. PCR products were separated in agarose gels (2%) to assess the presence of bands different from full-length mtDNA (16 Kb).
Kidney Function
Kidney function was assessed measuring blood urea nitrogen (BUN) and creatinine levels in plasma in a Heska Element DC analyzer, following the manufacturer’s procedures. In addition, glomerular function was assessed by measuring protein levels in urine using a urine strip test (Chemstrip 10; Roche Diagnostics GmgH, Mannheim, Germany).
Statistical Analysis
Data wee expressed as the mean ± SD of at least 3 experiments per group. For data grouped in columns, the Mann–Whitney test was used to compare each group. For survival curves, data is expressed as median ± SD and Mantel-Cox test was used to compare groups. A p value of < 0.05 was considered to be statistically significant.
Results
Neonatal AAV9 Delivery of Human TK2 cDNA Prolongs Lifespan and Growth of Tk2KI Mice in a Dose-Dependent Manner
Different treatment regimens used across the study are summarized in Figure 2A. Treatment with 4.2 × 10¹⁰ vector genomes (low-dose, 2.1–4.2 × 10¹³ vg/kg) of AAV9-TK2 at postnatal day 1 enabled Tk2KI mice to grow normally until day 20 (Fig 2B); however, the animals subsequently developed weakness requiring euthanasia. This treatment significantly prolonged the median lifespan of the Tk2KI mice to 39 days (maximum 52 days) compared to untreated mice with a median survival of 16 days (p = 0.0005). This lifespan extension was similar to that observed with high-dose oral nucleoside treatment (dC + dT each at 520 mg/kg/day; Tk2KI-dCdT5; Fig 2C). Unlike Tk2KI-dCdT mice, AAV9-TK2 treated animals did not develop head tremors.
FIGURE 2:
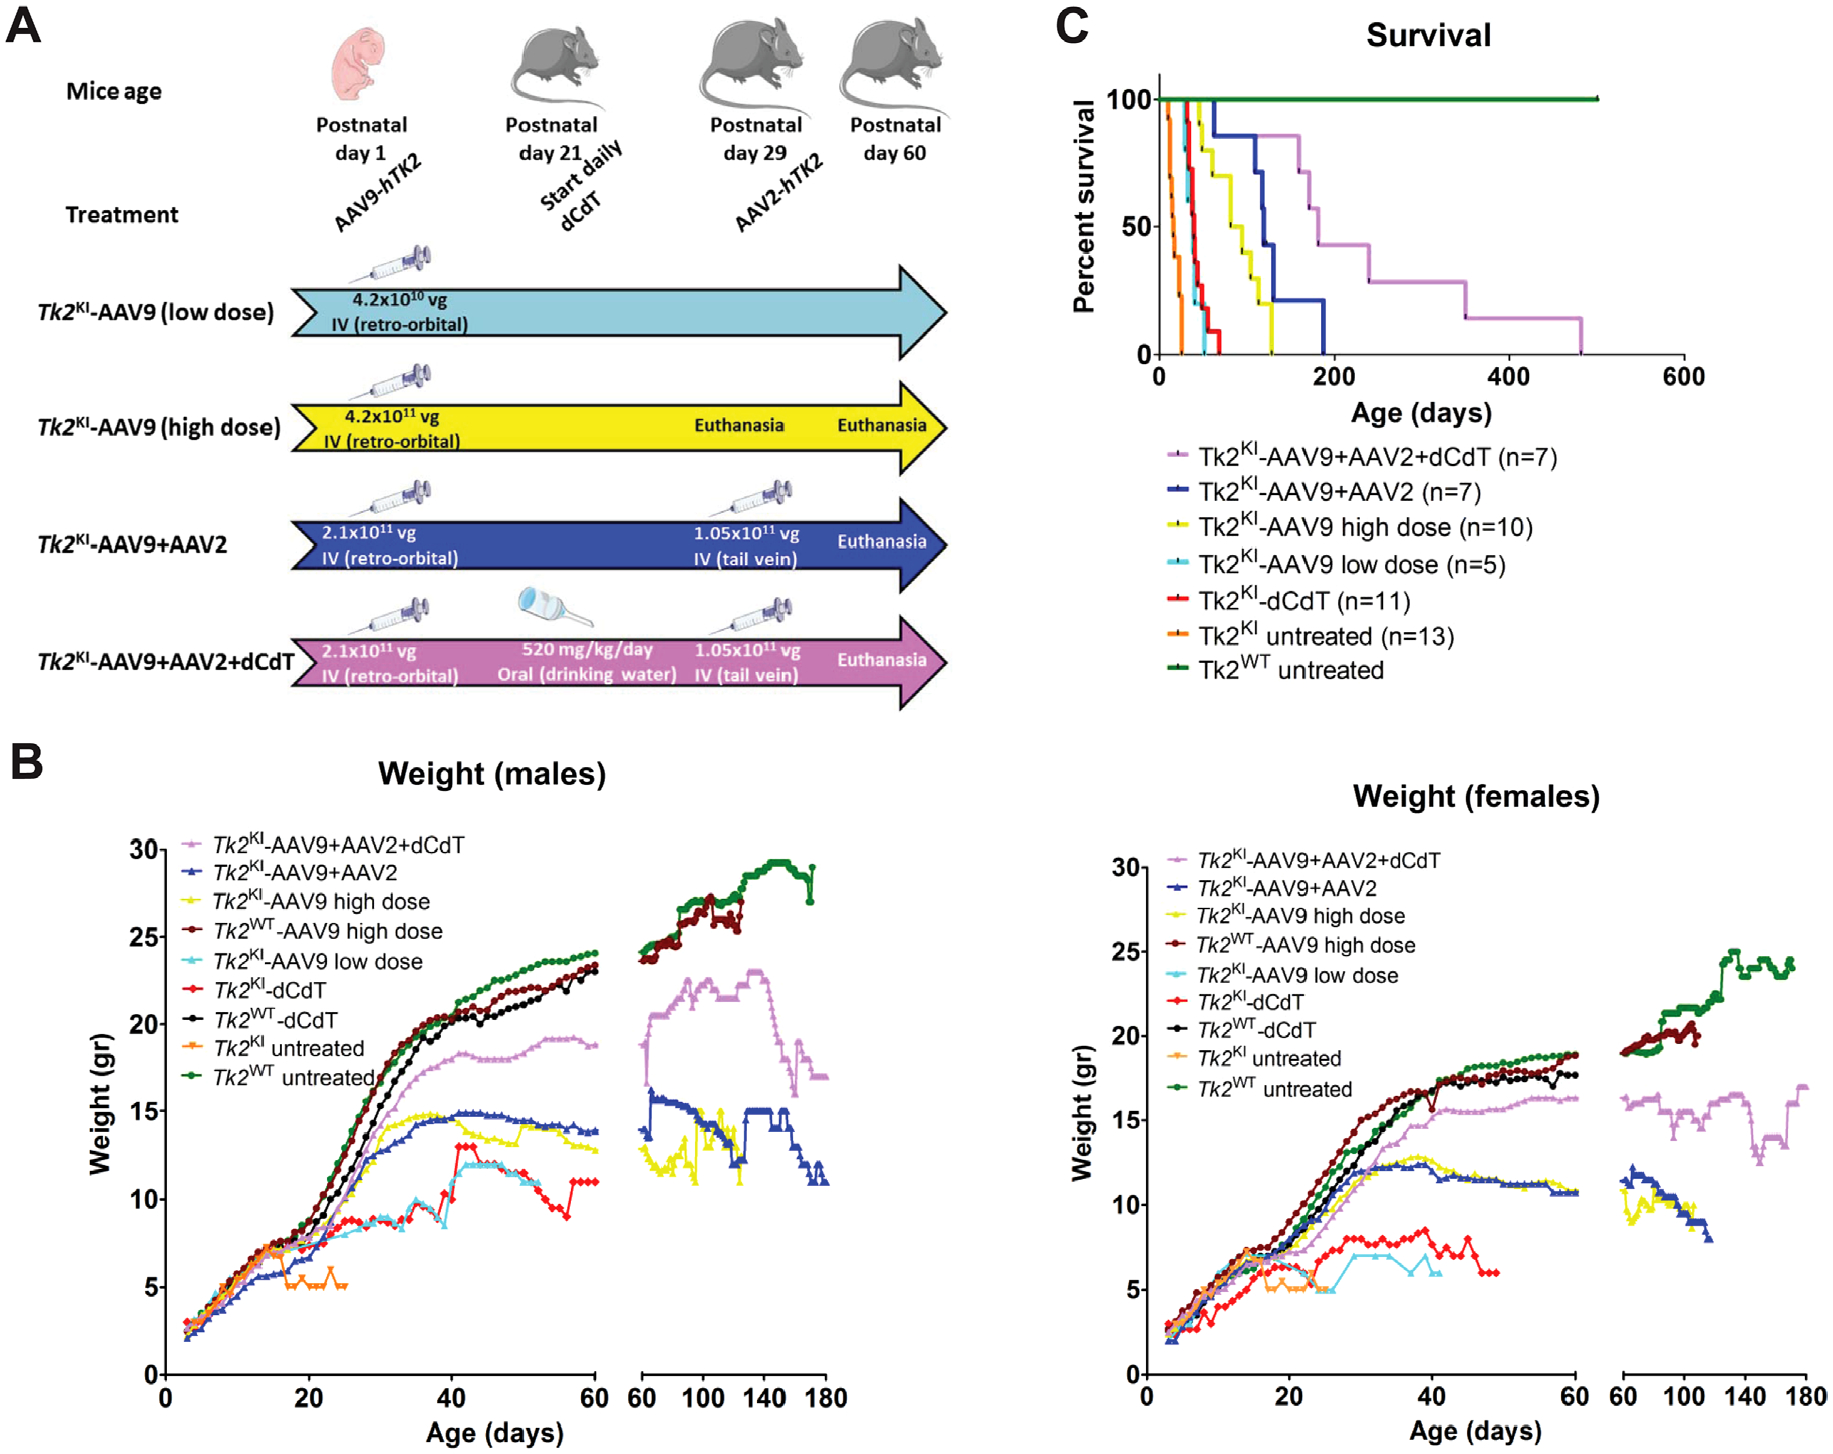
Treatment regimens, weight, and survival of Tk2KI. Panel (A) shows a flow chart summarizing the main treatment regimens. Mice were either left for assessment of survival or euthanized at indicated time. Values within arrows indicate the dose and route of treatment. Vg: Vector genomes. Panel (B) presents average daily weights of male and female mice for each treatment group. Panel (C) reveals survival as percentages within each treatment group. Data on weight and survival of mice treated with 520 mg/kg/day of dC and dT were previously reported.5 dC = deoxycytidine; dT = deoxythymidine.
Increasing the AAV9-TK2 dose to 4.2 × 10¹¹ vg (high-dose, 2.1–4.2 × 10¹⁴ vg/kg) at postnatal day 1 allowed the mice to grow normally until postnatal day 30 and further extended the median lifespan to 88.5 days (maximum 129 days) relative to untreated Tk2KI mice (p < 0.0001) as well as Tk2KI mice treated with low dose AAV9-TK2 (p = 0.0003). We found no differences between wild-type Tk2 mice (Tk2WT) and high-dose treated Tk2KI mice (Tk2KI-AAV9) at age 2 months in motor function, measured by rotarod test (Fig 3A, B) and strength, measured by bar and grid grip tests (Fig 4A–D). We did not observe head tremors in the treated mice. All further experiments using neonatal treatment with AAV9-TK2 were performed with the high dose (4.2 × 10¹¹ vg) and mice are denoted as Tk2WT -AAV9 and Tk2KI –AAV9.
FIGURE 3:
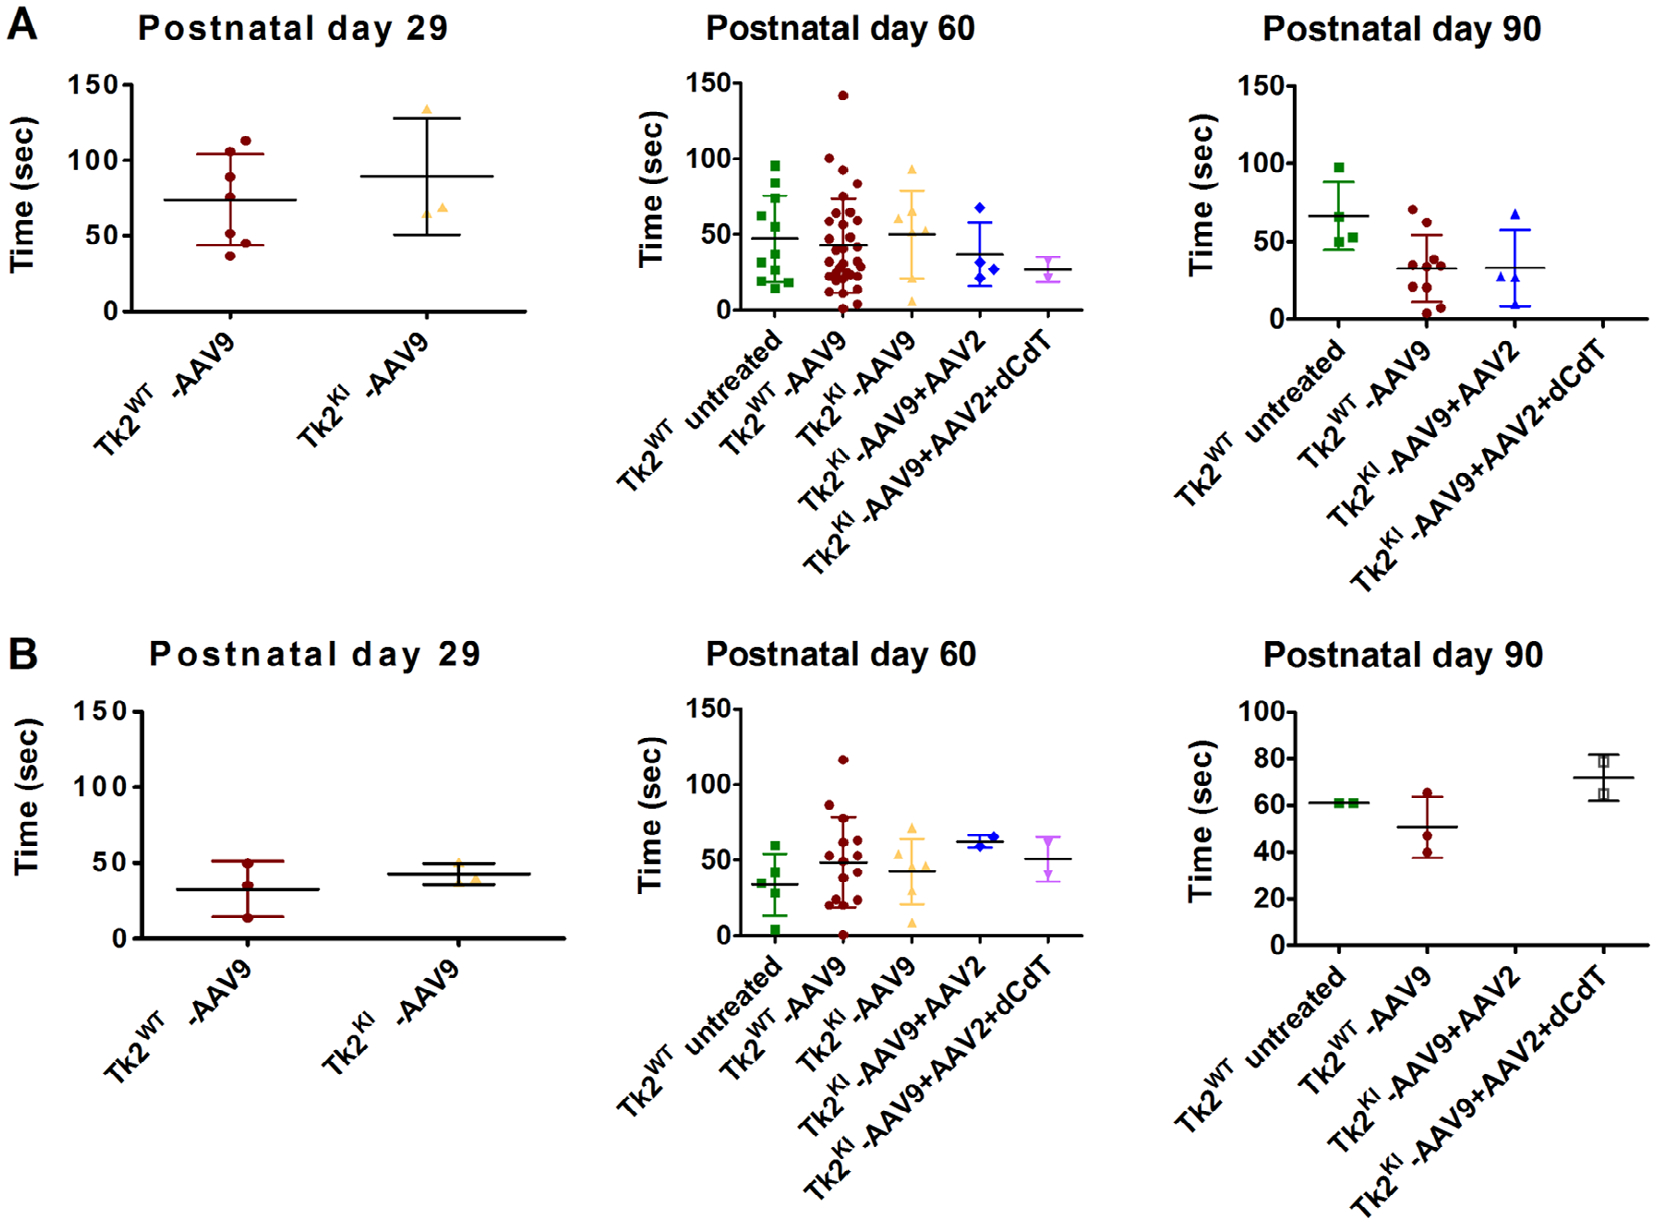
Rotarod test. Panels (A) and (B) show results from Rotarod test in male and female mice. Data are expressed as time to fall from the rotating rod. Each dot represents the average of three test of a single mouse. For each treatment group, average and standard deviation is represented. Tk2WT-AAV9 and TK2KI-AAV9 refer to the high-dose group (4.2 × 10¹¹ vg).
FIGURE 4:
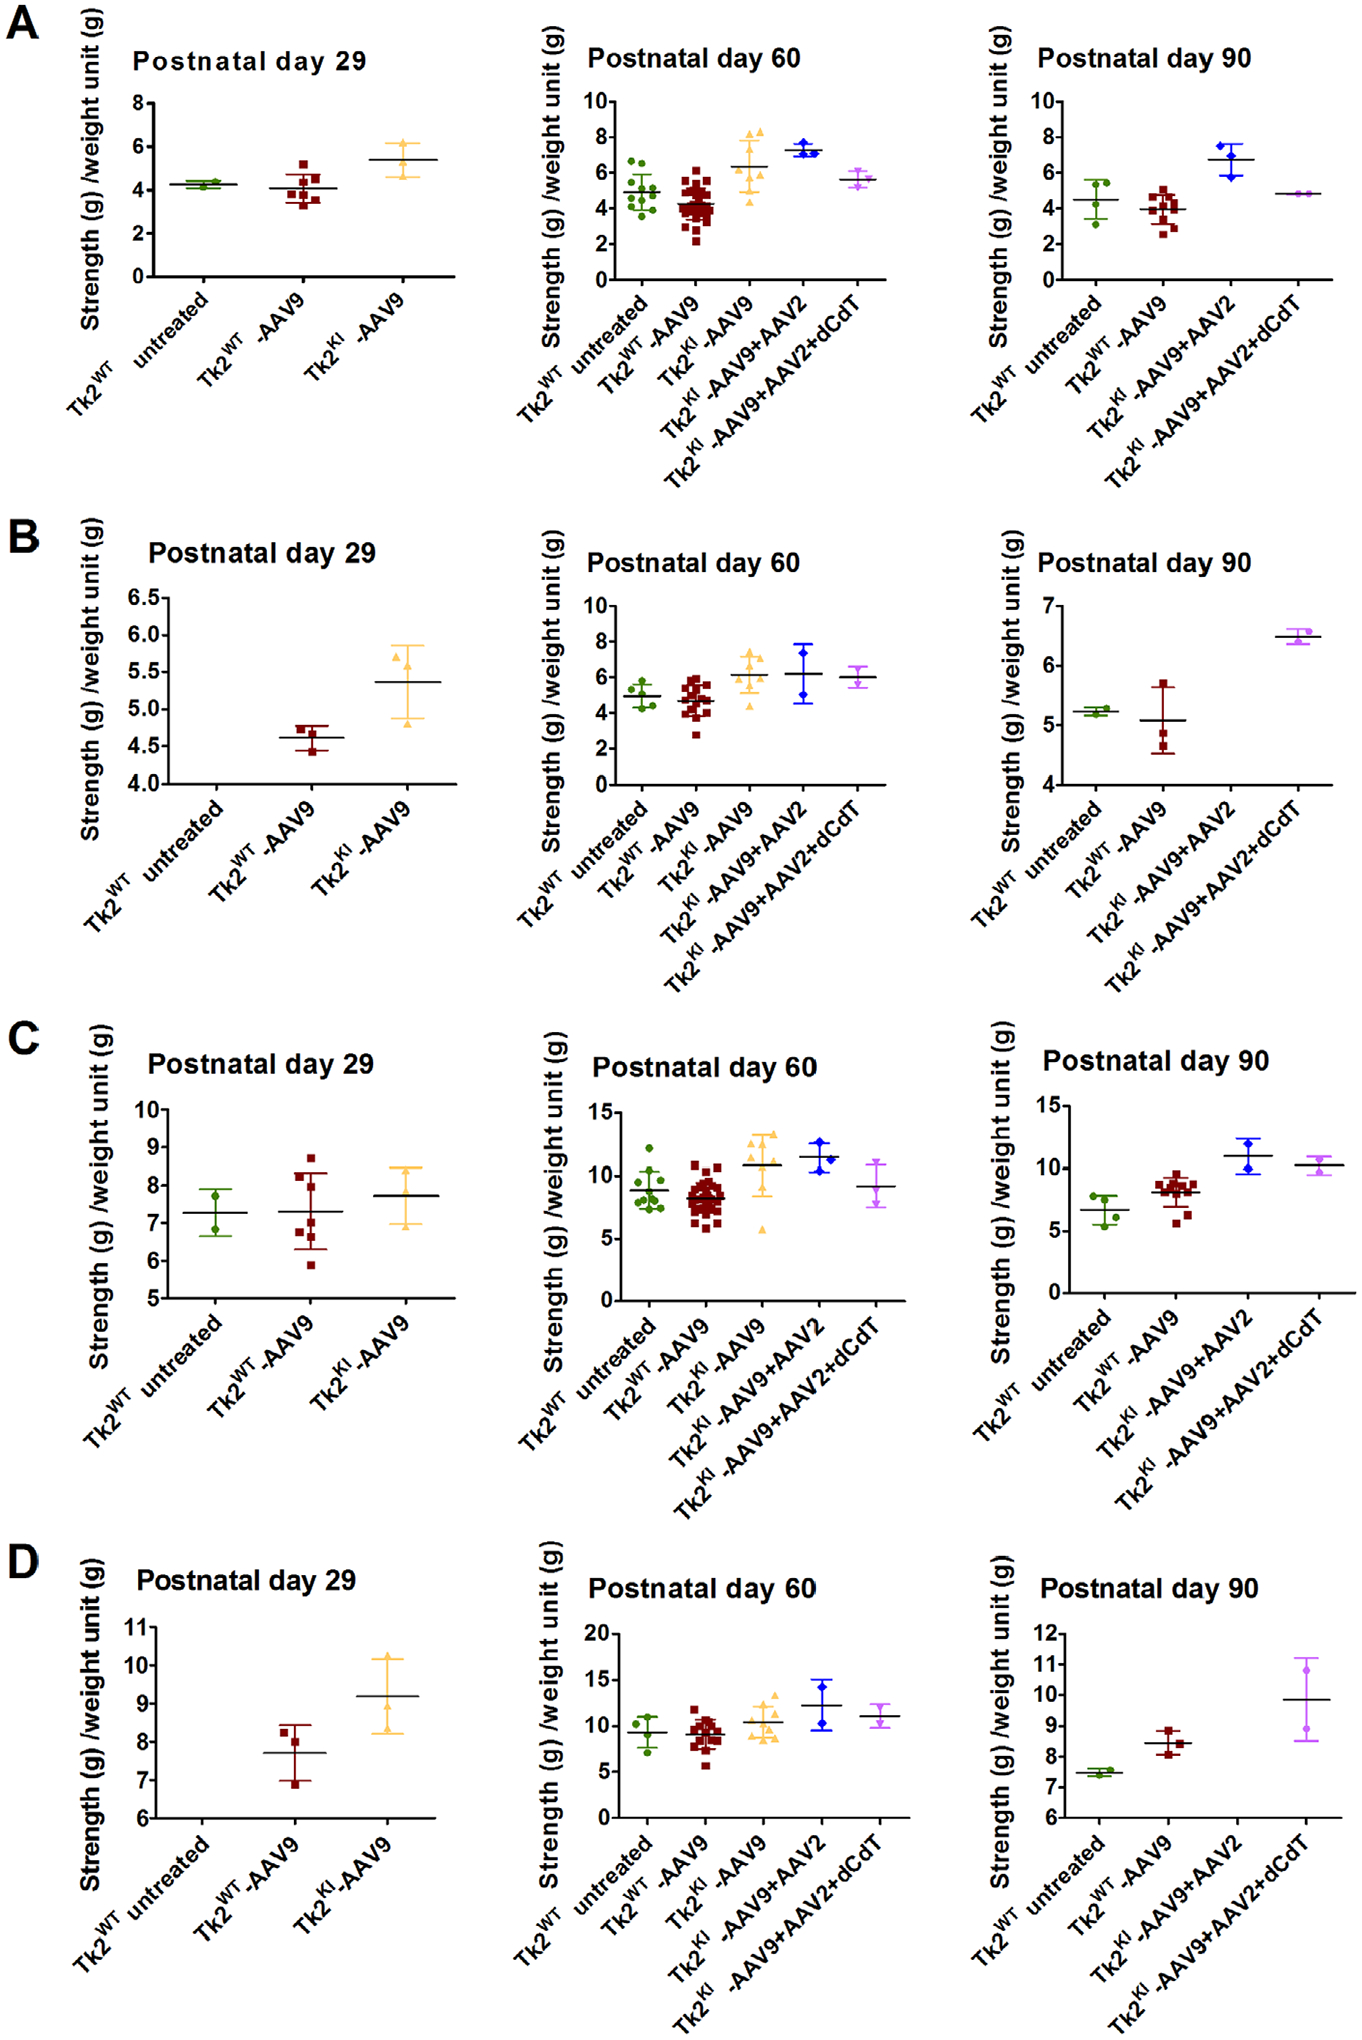
Grip test. Panels (A) and (B) shows bar test (upper limbs) in male and female mice, and panels (C) and (D) displays grid test (4 limbs) in male and female mice. Data are expressed as strength (measured in g) per weight unit (g). Each symbol represents the average of 3 tests of a single mouse. For each treatment group, average and standard deviation are represented. Tk2WT-AAV9 and TK2KI-AAV9 refer to the high-dose group (4.2 × 10¹¹ vg).
Transduction of AAV9-TK2 Rescues Tk2 Activity and mtDNA Depletion in Muscle, Brain, and Liver, but Not Kidneys
Transduction of AAV9-TK2 was assessed in key tissues at postnatal day 60 (Fig 5A). Vector transduction was most efficient in the brain, although showing high variability (0.3396 ± 0.299 vg/nucleus), followed by the liver (0.0919 ± 0.022 vg/nucleus) and muscles (0.030 ± 0.014). As expected, transduction in the kidneys was inefficient (0.001 ± 2.69 × 10⁻⁴ vg/nucleus). Assessment of vector genomes per nucleus in TK2WT mice at ages 2, 6, and 18 months showed no sign of vector dilution in the liver or muscles, but high variability in the brain made dilution effect difficult to assess (Table S1).
FIGURE 5:
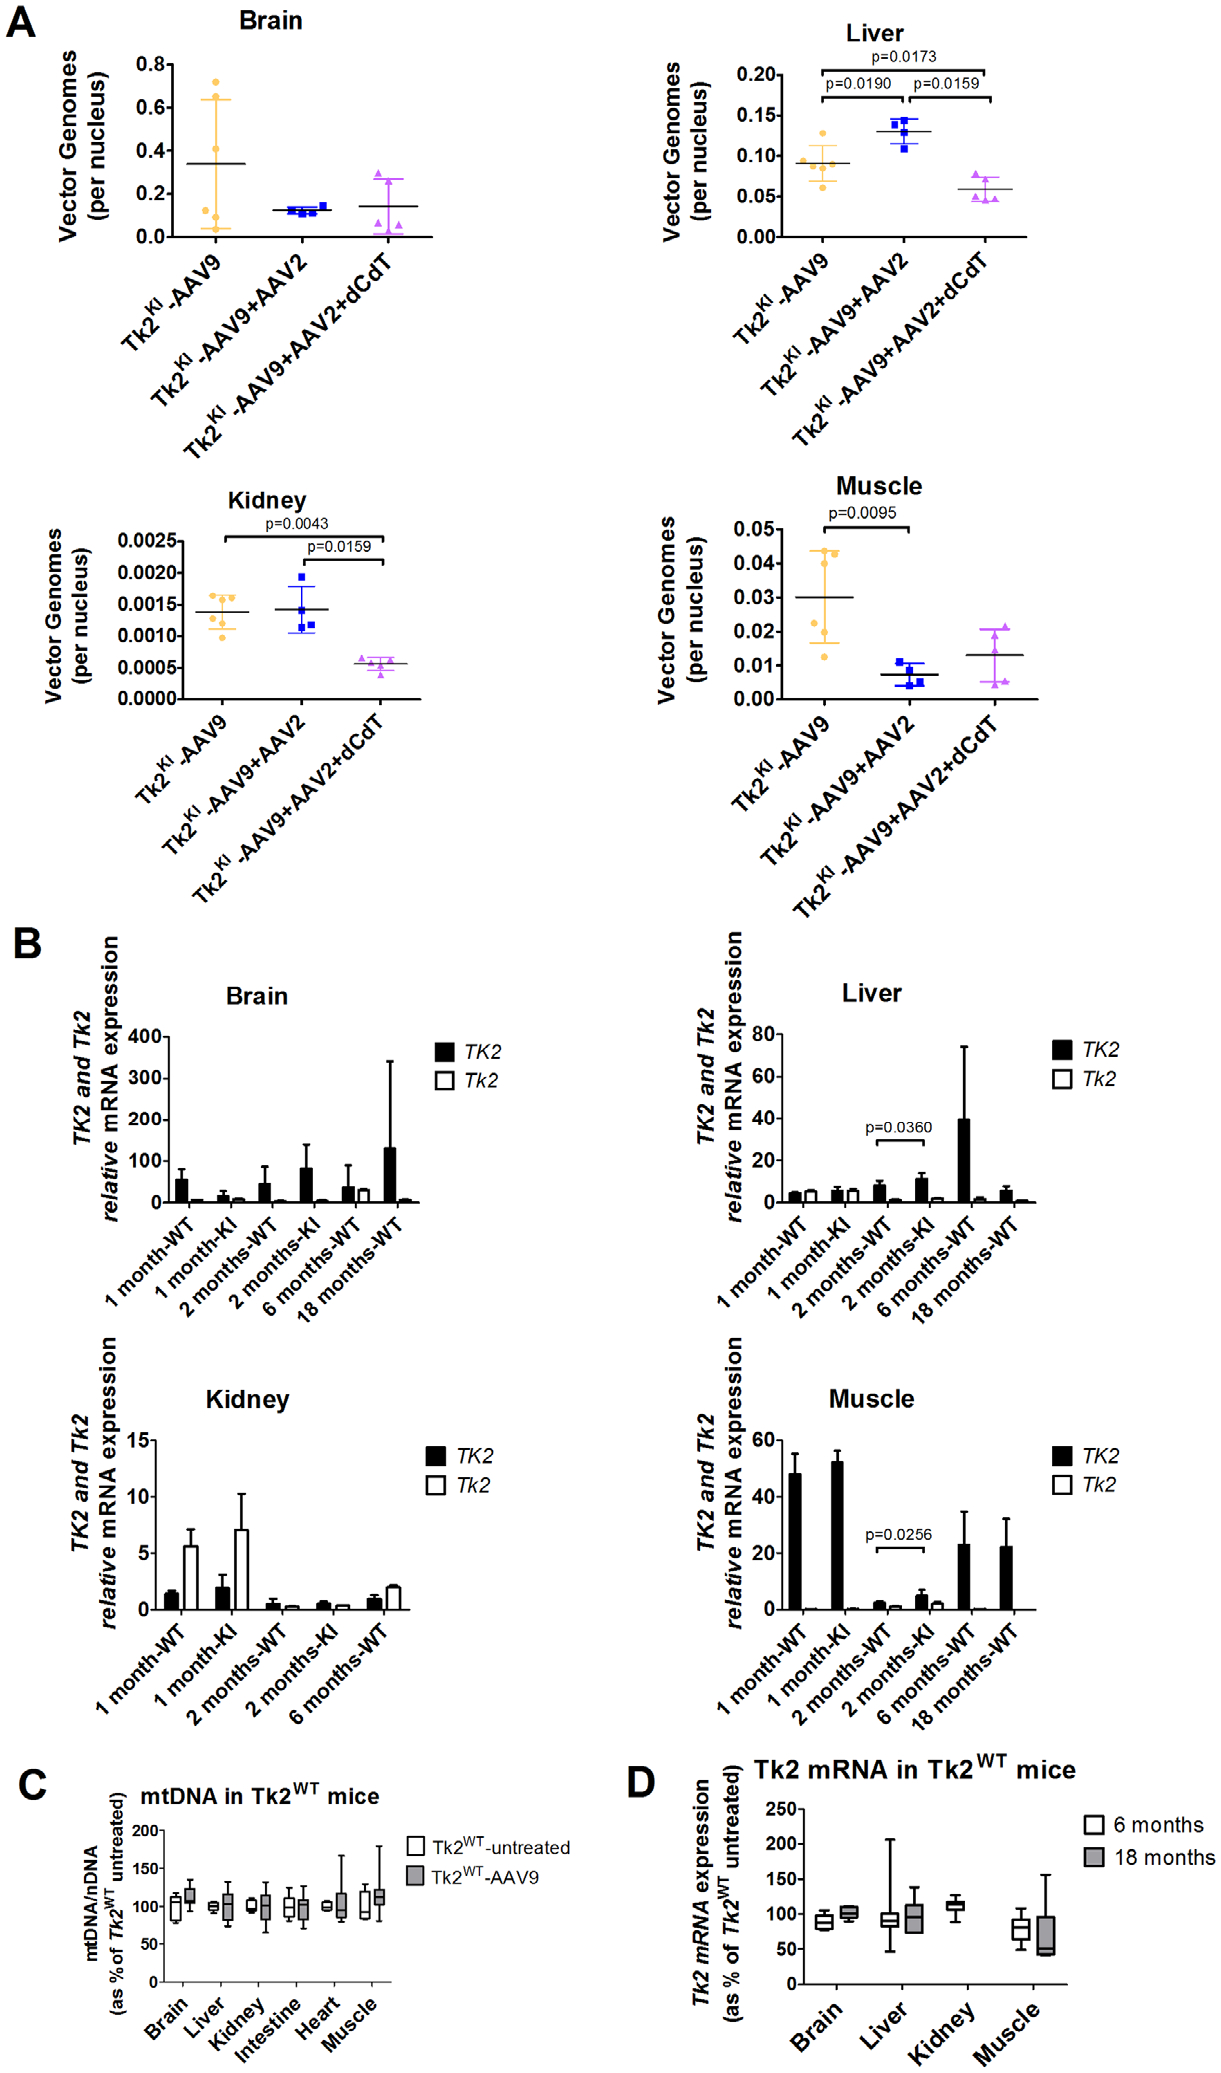
Vector transduction and expression efficiency. Panel (A) shows vector genomes in Tk2KI mice under different treatments. Values are expressed as vector genomes per nucleus. Panel (B) shows gene expression of TK2 and Tk2 from Tk2KI-AAV9-TK2 and Tk2WT-AAV9-TK2 in different tissues and time points. Values are expressed as ddCt values using mouse Gapdh as reference gene. Panel (C) shows mtDNA levels in Tk2WT-AAV9 at age 2 months (postnatal day 60). Values are expressed as percentages of mtDNA in Tk2WT untreated mice. Panel (D) shows Tk2 expression in muscle from Tk2WT-AAV9 at age 2 months (postnatal day 60). Values are expressed as percentages of Tk2 mRNA in Tk2WT untreated mice. In all panels, Tk2WT-AAV9 and TK2KI-AAV9 refer to the high-dose group (4.2 × 10¹¹ vg).
Mice treated with high-dose AAV9-TK2 at postnatal day 1 (Tk2WT-AAV9 and Tk2KI-AAV9 combined) showed widespread TK2 mRNA expression, which was sustained up through age 18 months (Table S2). Expression of TK2 normalized to Gapdh expression (x1000) was significantly higher in Tk2KI mice at age 2 months relative to Tk2WT in the liver and muscles (Fig 5B). Overall, the highest TK2 transcript levels were observed in the skeletal muscle (51.0 ± 4.9) followed by the brain (27.5 ± 23.9) and liver (5.3 ± 1.7). In contrast, expression of human TK2 in the kidneys was less robust, showing levels of 1.8 ± 1.0 at age 1 month, declining to 0.5 ± 0.4 at 2 months and 1.0 ± 0.3 at 6 months. Tk2WT-AAV9 mice were followed until age 18 months without effects attributable to overexpression of TK2. Levels of mtDNA in Tk2WT-AAV9 and Tk2WT mice at age 60 days (Fig 5C) mice were comparable, indicating that overexpression of TK2 does not significantly alter mtDNA replication. Similarly, expression of TK2 in mice did not significantly alter expression of endogenous Tk2 in key tissues (Fig 5D).
Concordant with the increases in TK2 transcript, mean TK2 activity from Tk2KI -AAV9 mice was rescued at postnatal day 29 in muscle (40-fold elevated TK2 activity relative to Tk2 level in Tk2WT mice), brain (130%), and liver (93%), but not in the kidneys (37%; Fig 6A and Table S3). At postnatal day 60, TK2 activity in muscle of Tk2KI-AAV9 mice remained high (33-fold elevated) but decreased to 53% in the brain and was stable in the liver (84%) and kidneys (41%; Fig 6B, and see Table S3). These results demonstrate efficiency of the AAV9-TK2 vector to transduce and express a human gene in the 2 main tissues affected in our mouse model, the brain and muscle, and confirm poor transduction efficiency in the kidneys.
FIGURE 6:
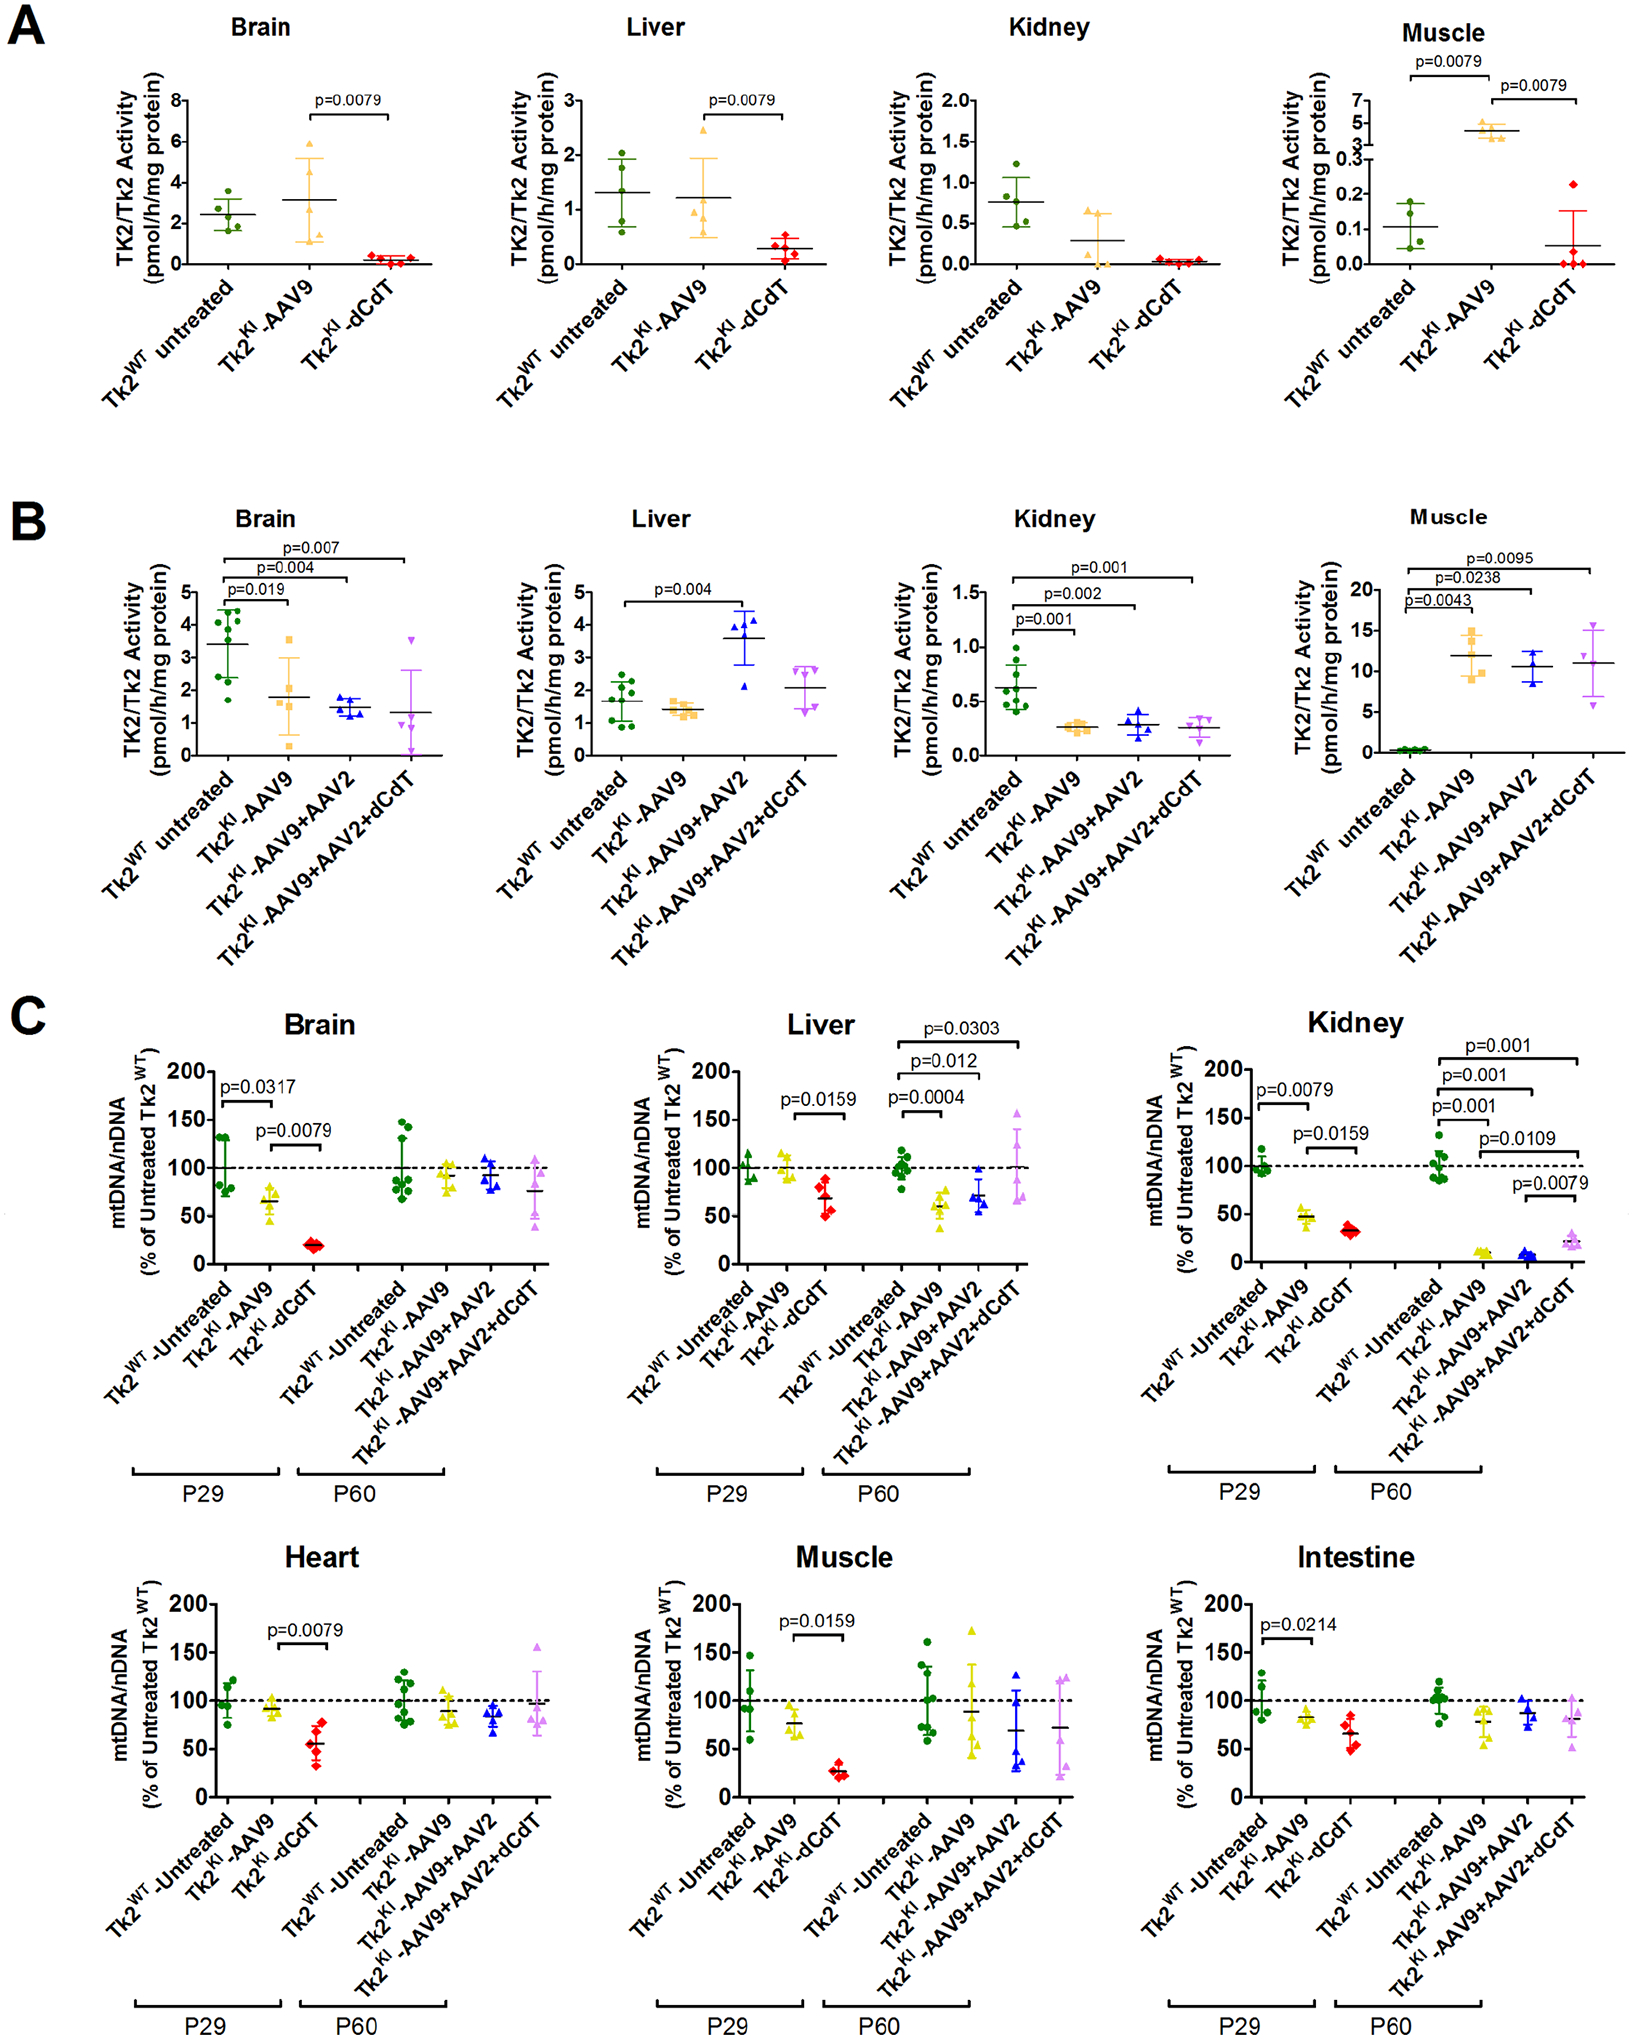
TK2 activity and mtDNA levels. Panels (A) and (B) show TK2/Tk2 activity from mice at age 29 and 60 days, respectively. Data are expressed as pmol of product generated per hour and normalized to mg of protein for each sample. Each symbol represents the value obtained for each tissue in individual mice. For each treatment group, average and standard deviation are represented. The p values are for results of Mann–Whitney tests. Panel (C) shows mtDNA levels at age 29 and 60 days. Data are expressed as percentages of mtDNA in untreated Tk2WT mice. Each symbol represents the average of 3 measurements in a single tissue of individual mice. For each treatment group, average and standard deviation are represented. The p values are for results of Mann–Whitney tests. TK2KI-AAV9 refers to the high-dose group (4.2 × 10¹¹ vg).
Expression of TK2 in P29 Tk2KI-AAV9 mice significantly increased levels of mtDNA relative to Tk2KI-dCdT in the brain, heart, liver, and muscle (Fig 6C, and Table S4). In the kidneys, mtDNA levels were mildly increased in Tk2KI-AAV9 (47.4 ± 7.7%) compared to animals treated with dC + dT (32.8 ± 3.8%) [p = 0.016]) but significantly lower than in wild-type mice (100.0 ± 10.3% [p = 0.008]). At postnatal day 60, mtDNA levels in Tk2KI-AAV9 were moderately reduced in the brain (80.8%), heart (77.3%), muscle (70.2%), and liver (67.3%) but severely depleted in the kidneys (12.7%; see Fig 6C and Table S4).
mtDNA Depletion in the Kidneys is Associated with Renal Dysfunction
At postnatal day 60, Tk2KI-AAV9 mice showed higher levels of BUN compared to Tk2WT-AAV9 mice (68.7 ± 18.2 mg/dL vs 30.8 ± 8.9 mg/dL [p = 0.009]; Fig 7 and Table S5). Furthermore, in 2 out of 6 Tk2KI-AAV9 mice, high levels of BUN were accompanied by elevated plasma creatinine (>0.3 mg/dL; normal <0.2 mg/dL) indicating impaired renal function. Moreover, one Tk2KI-AAV9 mouse at end-stage (postnatal day 129) showed plasma levels of BUN (>140 mg/dL) and creatinine (>0.5 mg/dL) above detection limits indicating that kidney dysfunction was progressive and contributing to the early mortality of the Tk2KI-AAV9 mice.
FIGURE 7:
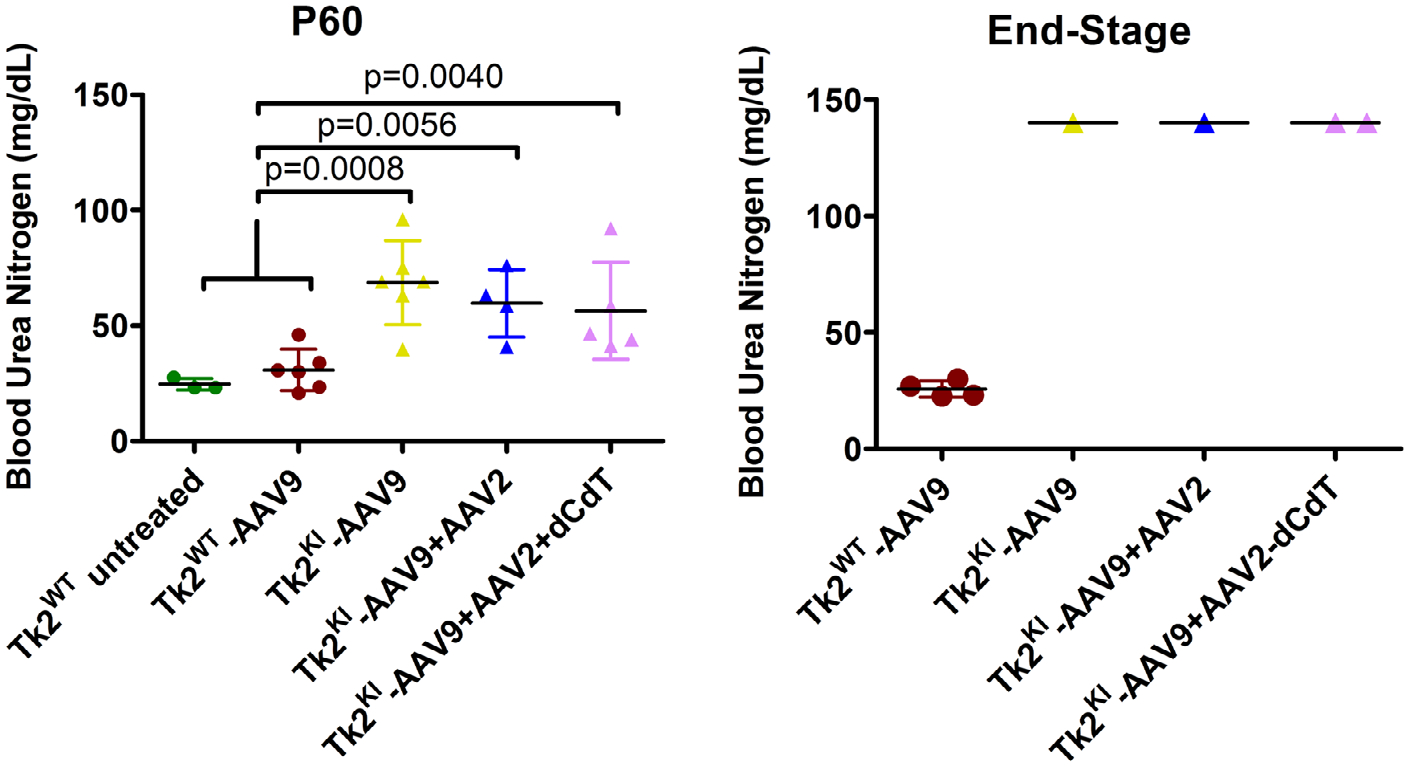
Blood urea nitrogen levels. Data is expressed as mg/dL of plasma. Each symbol represents the value for a single mouse. The left panel represents BUN at age 60 days. For each treatment group, average and standard deviation are represented. The p values are for results of Mann-Whitney tests. The right panel represents BUN at the end point. Values from all the Tk2KI mice at the end point were in fact above the detection limit of the technique (>140 mg/dL). Tk2WT-AAV9 and TK2KI-AAV9 refer to the high-dose group (4.2 × 10¹¹ vg). BUN = blood urea nitrogen.
Treatment with AAV9-TK2 Followed by Redosing with AAV2-TK2 Prolongs Survival of Tk2KI-AAV9 Mice
The AAV transduction efficiency in the kidneys and liver has been reported to be dependent on age.17 Therefore, to enhance expression of the human TK2 gene in the kidneys and further improve AAV9-TK2 therapy, we treated mice with a second dose of AAV at an older age. To avoid immune response to AAV9, we used AAV2-TK2. A single dose of 2.1 × 10¹¹ vg (1.05–2.1 × 10¹⁴ vg/kg) of AAV9-TK2 was administered at postnatal day 1, followed by a second treatment with 1.05 × 10¹¹ vg (0.7–1.8 × 10¹³ vg/kg) of AAV2-TK2 administered at postnatal day 29. This treatment resulted in a lower total viral dose (3.15 × 10¹¹ vg; 1.12–2.3 × 10¹⁴ vg/kg) relative to single high neonatal dose regime of AAV9-TK2 (4.2 × 10¹¹ vg; 2.1–4.2 × 10¹⁴ vg/kg).
This treatment did not improve vector transduction in the kidneys (see Fig 5A). In fact, vector genomes per nucleus were decreased in the brain and muscle from Tk2KI-AAV9 + AAV2 mice, compared to Tk2KI-AAV9 mice. Nevertheless, Tk2KI-AAV9 + AAV2 mice survived significantly longer (median survival of 120 days, maximum 187 days) compared to high-dose Tk2KI-AAV9 mice (88.5 days, p = 0.045; see Fig 2C). Growth curves, motor function, and strength were similar in both Tk2KI-AAV9 + AAV2 and Tk2KI-AAV9 mice (see Figs 2B, 3, and 4).
BUN levels (see Fig 7) in Tk2KI-AAV9 + AAV2 mice were mildly reduced compared to Tk2KI-AAV9 mice (59.7 ± 14.6 vs 68.7 ± 18.2 mg/dL, p > 0.05), but significantly higher than in Tk2WT mice (30.8 ± 8.9 mg/dL, p = 0.006). At age 60 days, serum creatinine was also elevated (>0.3 mg/dL) in 2 of 6 Tk2KI-AAV9 mice, but not in the 4 Tk2KI-AAV9 + AAV2 or 3 Tk2WT mice. Between ages 21 and 29 days, 2 out of 4 Tk2KI-AAV9 mice showed protein levels >500 mg/dL, indicating glomerulopathy (Table S6). A third mouse had 30 mg/dL protein in urine, whereas a fourth mouse showed only trace levels of protein, similar to Tk2WT mice. The 3 mice with increased proteinuria were treated with AAV2-TK2 at age 29 days (Tk2KI-AAV9 + AAV2 mice), whereas the fourth mouse was not treated further. At age 60 days, the 3 Tk2KI-AAV9 + AAV2 mice had only trace urine protein, whereas the fourth Tk2KI-AAV9 mouse showed levels >500 mg/dL.
TK2 activities in most tissues of Tk2KI-AAV9 + AAV2 mice at age 60 days were similar to TK2 activities in Tk2KI-AAV9 mice (see Fig 6B) reflecting transduction efficiencies observed in each treatment regime. Furthermore, the mtDNA copy numbers were similar in both Tk2KI-AAV9 and Tk2KI-AAV9 + AAV2 mice in all tissues at age 60 days, except the kidneys, which showed severe mtDNA depletion in Tk2KI-AAV9 + AAV2 mice (kidneys mtDNA level 8.2 ± 2.6% vs 100.0 ± 15.8% in Tk2KI-AAV9 + AAV2 vs Tk2WT mice [p = 0.001] and 10.7 ± 2.2% in Tk2KI-AAV9 mice [not significant]; see Fig 6C). In aggregate, correction of proteinuria after AAV2-TK2 treatment may be indicative of modestly improved early TK2 transduction in kidney glomeruli (due to either different tropism of AAV2 vs AAV9 or age of treatment), but low mtDNA levels in whole kidneys suggests that TK2 transduction remains low in most kidney cells and therefore insufficient to fully rescue renal functions.
Supplementation with Oral dC + dT Further Improves Effects of Gene Therapy and Prolongs Lifespan
A set of Tk2KI -AAV9 + AAV2 mice was further treated with 520 mg/kg/day of oral dC + dT from age postnatal day 21. Survival of Tk2KI-AAV9 + AAV2 + dCdT mice was significantly prolonged (median survival of 181 days and maximum 481 days) compared to survival with other treatments (Tk2KI-AAV9 [p = 0.0013] and Tk2KI-AAV9 + AAV2 [p = 0.062]; see Fig 2C).
Growth also improved in Tk2KI-AAV9 + AAV2 + dCdT mice. Although all 3 treatments (Tk2KI-AAV9, Tk2KI-AAV9 + AAV2, and Tk2KI-AAV9 + AAV2 + dCdT mice) increased weight to ~80% of Tk2WT mice at age 29 days (Fig 8), both Tk2KI-AAV9 and Tk2KI-AAV9 + AAV2 mice subsequently stopped gaining weight (see Fig 2B). In contrast, Tk2KI-AAV9 + AAV2 + dCdT mice at age 60 days weighed significantly more (82.3 ± 11.4%) than Tk2KI with any other treatments (55.7 ± 11.3% in Tk2KI-AAV9 mice [p = 0.0001] and 57.4 ± 10.5% in Tk2KI-AAV9 + AAV2 mice [p = 0.0002]).
FIGURE 8:
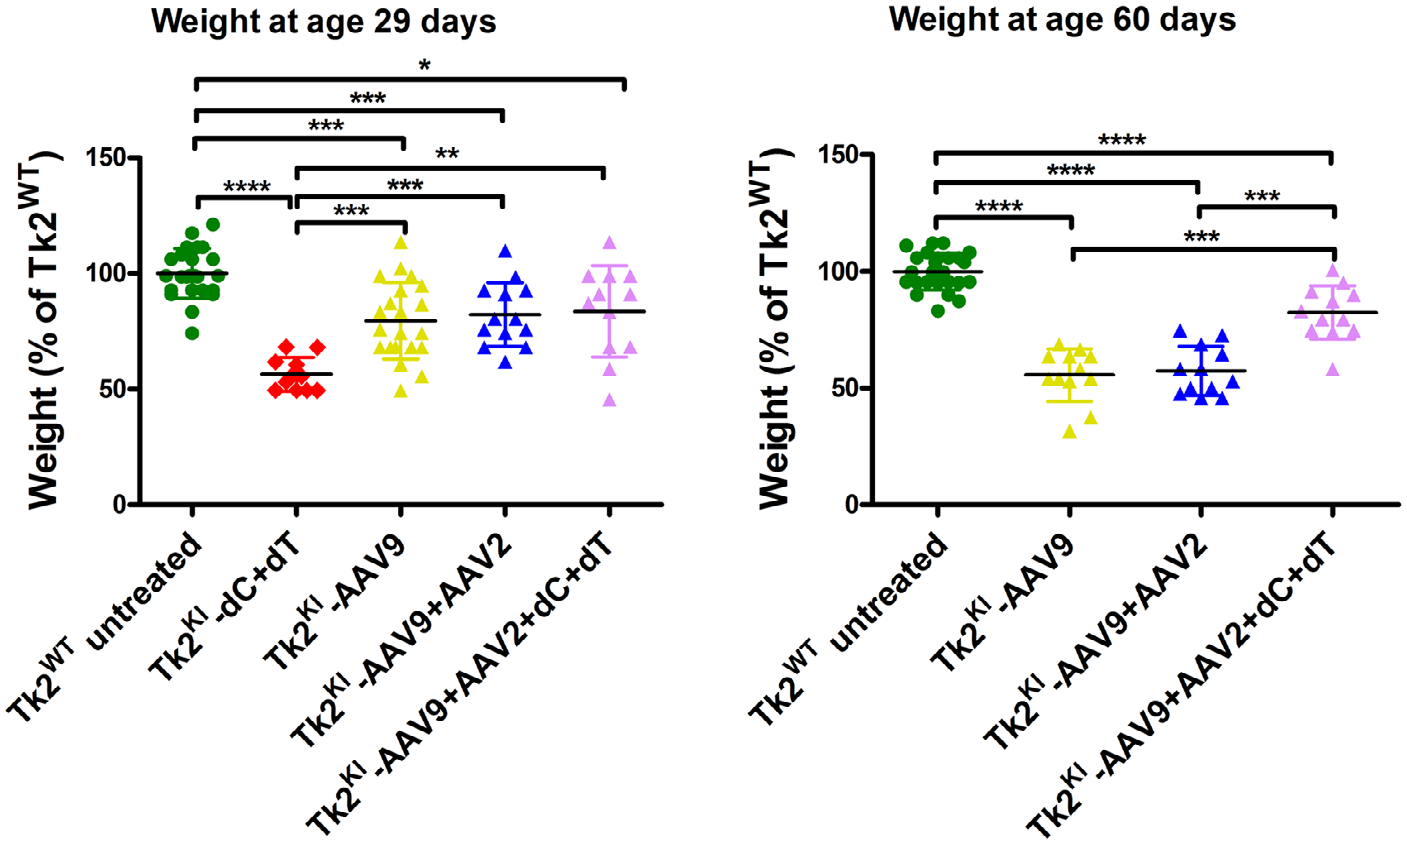
Weight of Tk2KI mice under different treatments as percentages of weight in Tk2WT mice. Values are expressed as percentages of weight relative to Tk2WT mice within each sex, and weights of male and female mice are combined. Statistically significant differences are expressed as follows: * = p < 0.05; ** = p < 0.01; *** = p < 0.001; **** = p < 0.0001. TK2KI-AAV9 refers to the high-dose group (4.2 × 10¹¹ vg).
As expected, TK2 activity at age 60 days was similar in both Tk2KI-AAV9 + AAV2 + dCdT and Tk2KI-AAV9 + AAV2 mice in all the tissues (see Fig 6B) with the exception of liver, which was lower in mice supplemented with deoxynucleosides (2.08 ± 0.64 pmol/h/mg-protein in Tk2KI-AAV9 + AAV2 + dCdT mice vs 3.59 ± 0.82 in Tk2KI-AAV9 + AAV2 mice, p = 0.056). Levels of mtDNA were similar in tissues from Tk2KI-AAV9 + AAV2 + dCdT and Tk2KI-AAV9 + AAV2 mice, except in the liver and kidneys (see Fig 6C). Deoxynucleoside supplementation produced higher levels of mtDNA in liver (101.7 ± 38.3% in Tk2KI-AAV9 + AAV2 + dCdT mice vs 71.6 ± 16.9% in Tk2KI-AAV9 + AAV2 mice [p > 0.05] and 61.0 ± 13.7% in Tk2KI-AAV9 mice [p = 0.030] and in the kidneys (22.1 ± 5.4% in Tk2KI-AAV9 + AAV2 + dCdT mice vs 8.2 ± 2.6% in Tk2KI-AAV9 + AAV2 mice [p = 0.0079] and 10 ± 2.2% in Tk2KI-AAV9 mice [p = 0.0303]). The slightly higher levels of mtDNA in kidney was insufficient to rescue renal function in Tk2KI-AAV9 + AAV2 + dCdT, which showed increased BUN similar to Tk2KI-AAV9 and Tk2KI-AAV9 + AAV2 mice at age 60 days and at end-stage as well as elevated creatinine (>0.3 mg/dL) in 2 of 5 mice at age 60 days and 1 of 2 mice at end-stage.
We screened for mtDNA deletions in the brain, liver, kidneys, and muscle from TK2KI mice with the various AAV treatments, but did not detect any mtDNA deletion in mice euthanized at age 2 months or in end-stage mice (data not shown).
Discussion
MDS encompasses a heterogeneous group of autosomal recessive mitochondrial disorders characterized by severe reduction of mtDNA copy number. The causative gene largely dictates organ involvement with myopathy (TK2), encephalomyopathy (SUCLA2, SUCLG1, or RRM2B), encephaloneurogastrointestinal (TYMP), or hepatoencephalopathy (DGUOK, MPV17, POLG1, or C10orf2) phenotypes.18 To date, there are no cures for MDS and disease-modifying treatments are only available for only the forms caused by pathogenic variants in TYMP causing mitochondrial neurogastrointestinal encephalopathy (MNGIE)19–23 and TK2 leading to TK2 deficiency.6
Treatment of TK2 deficiency with deoxynucleoside has showed promising results in both knock-in and knock-out Tk2 mouse models,4,5 as well as in patients receiving compassionate use treatment.6 Dominguez-Gonzalez et al6 observed amelioration of symptoms and prolonged survival of patients with open-label dC + dT therapy compared to historical controls. Based upon these observations, a phase II prospective, open-label clinical trial has been initiated to further assess this therapy (NCT03845712). Nevertheless, results in Tk2 deficient mice showed limited efficacy, likely due to several factors tempering response to dC + dT.4,7 Potency of dC + dT therapy may be limited in encephalomyopathic forms of human TK2 deficiency, because low expression of TK1 in the brain may constrain response of encephalopathy. Therefore, more effective treatments are needed for TK2 deficiency as well as other forms of MDS.
Rescue of the endogenous Tk2 activity using a germ line transgene was first described by Anna Karlsson’s group.24 In this previous study, the authors inserted the D. melanogaster deoxynucleoside kinase (Dm-dNK) into the Tk2 knock-out murine model, which allowed normal development and health of the mutant mice until age 20 months25 indicating that endogenous Tk2 activity deficiency can be compensated by the expression of an alternative deoxynucleoside kinase. Our study builds upon this observation to develop a gene therapy, which may be translatable to TK2 deficiency patients. We have assessed effects of AAV9 delivery of the human TK2 cDNA to our Tk2KI mice due to the wide tropism of the vector. We incorporated chicken beta actin promoter to enhance expression in muscle, which is the most affected tissue in patients. Our results demonstrate high transduction efficiency, especially in skeletal muscle where it was stable for at least 18 months. Expression of human TK2 mRNA was also stable up to 18 months after the treatment.
Because TK2 is an enzyme rather than a structural protein and because heterozygous TK2 mutation carriers are asymptomatic, we hypothesized that partial activity should be sufficient to achieve normal levels of mtDNA. In fact, mtDNA levels in both muscles and the brain from Tk2KI-AAV9 mice at age 60 days were similar to those observed in Tk2WT mice, although the brain showed about half of the normal Tk2 activity, which confirms that complete rescue of the TK2 activity is not necessary to achieve a therapeutic response. In contrast, kidneys from Tk2KI-AAV9 mice, which also showed about half of the normal Tk2 activity, showed a devastating mtDNA depletion that led to renal dysfunction. Differential transduction of TK2 in different kidney cell types, with few cells acquiring many copies of the transgene while most remaining untransfected, may explain the discrepancy between the moderate TK2 activity in whole tissue and low levels of mtDNA observed. Further research is needed to investigate the mechanisms for ineffectiveness of this therapy in the kidneys; however, relevance to human TK2 deficiency is unclear because nephropathy is rare in patients.1,26
Although treatment with AAV9-TK2 did not work as effectively in the kidneys relative to other tissues, disease onset was delayed, disease course improved, and lifespan was prolonged from a median of 16 days to 88.5 days. In fact, Tk2KI-AAV9 mice did not manifest head tremor at the end point, which is a typical sign of disease in this mouse model; the absence of tremor indicates amelioration of the encephalopathy.
It has been reported that neonatal AAV9 treatment is inefficient in transducing the kidneys in mice,17 which may explain the poor transduction of TK2 observed in the kidneys. Therefore, to improve this therapy, we modified our treatment plan with a second injection at age 29 days, using a different serotype to avoid immunogenicity. We chose the AAV2 serotype because of its reported high transduction efficiency in mouse kidneys.27 Interestingly, using this dual AAV treatment with total vg 75% of the high-dose AAV9 alone, TK2 activity in tissues remained at the same levels as in high-dose Tk2KI-AAV9 mice. TK2 activity in the kidneys was not detectably improved and renal dysfunction was only partially ameliorated (slightly reduced BUN levels in plasma), lifespan of Tk2KI-AAV9 + AAV2 mice was prolonged to a median of 119 days (34% increase compared to high-dose Tk2KI-AAV9 mice). Tk2KI-AAV9 + AAV2 mice weight and course of disease did not improve relative to high-dose Tk2KI-AAV9 mice and there were no differences in the levels of mtDNA that could account for increased survival between Tk2KI-AAV9 and Tk2KI-AAV9 + AAV2 mice. Importantly, the AAV9 + AAV2 combination produced the same effect on mtDNA levels and even improved survival using a lower overall viral dose compared to high-dose AAV9 alone. Hence, use of different AAV serotypes at different time points is a promising strategy to enhance this gene therapy.
To further improve this treatment, we supplemented Tk2KI-AAV9 + AAV2 mice with 520 mg/kg/day of oral dC + dT from day 21 to augment TK2 activity in tissues with low expression of the human TK2 transgene. This dC + dT supplementation further prolonged the median lifespan to 481 days. Interestingly, weight of Tk2KI-AAV9 + AAV2 + dCdT mice also increased significantly, which may be related to increased mtDNA copy number in the liver and kidneys relative to Tk2KI-AAV9 mice. TK2 activity in the liver was slightly higher in Tk2KI-AAV9 + AAV2 + dCdT relative to Tk2KI-AAV9 + AAV2 mice, which confirms that in tissues with TK2 activity, supplementation with dC + dT improves replication and maintenance of mtDNA. Whereas adult TK2 deficiency patients manifest mtDNA multiple deletions, rather than mtDNA depletion, our TK2KI mouse model did not develop mtDNA deletions perhaps because of the devastating mtDNA depletion and short survival. Nevertheless, the longer survival of our AAV9-TK2 treated TK2KI mouse model did not lead to development of mtDNA deletions in TK2KI mice. It remains unknown whether the therapy prevents formation of mtDNA deletions or whether absence of mtDNA deletions is an intrinsic phenomenon in our TK2KI mouse model.
There is one prior report of efficacy of combined pharmacological and gene therapy. Keeler and colleagues28 assessed a gene therapy in the experimental autoimmune encephalomyelitis mouse model for multiple sclerosis by transfection of full-length myelin oligodendrocyte glycoprotein (MOG) in AAV8. The combination of AAV8-MOG gene therapy with rapamycin, to induce a transient immune suppression, improved the results from AAV8-MOG gene therapy alone. Our study is the first to demonstrate synergy of AAV-mediated enzyme replacement therapy in combination with pharmacological substrate enhancement to enhance therapeutic efficacy beyond either therapy alone.
In conclusion, our study provides the first demonstration of efficacy of AAV-mediated gene therapy for Tk2 deficiency in a mouse model. Systemic transduction of the human TK2 cDNA using AAV9 is highly effective in targeting skeletal muscle, the most affected tissue in patients with TK2 deficiency. The chicken beta actin promoter in our system proved to be highly efficient in enhancing transgene expression and activity of TK2 in most tissues, but most effectively in skeletal muscle. Despite the high doses of AAV used in this study (1014 vg/kg), these doses are in the range of the dosage previously used in clinical trials for muscular diseases, which generally showed a safety profile.29 Furthermore, dC + dT supplementation as a co-treatment not only enhances the effects of TK2 gene therapy, but may also allow reduced viral dose, which may reduce known side effects of high-dose AAV therapy, including hepatotoxicity. Finally, our findings provide a foundation for potential future combination AAV-TK2 and deoxynucleoside therapy in patients with TK2 deficiency and potentially for analogous gene therapy with substrate enhancement for other metabolic diseases.
Supplementary Material
Acknowledgments
The authors acknowledge Professor Liya Wang for assistance with the assessment of TK2 activity, Maoxue Tang, PhD, for assistance with the retro-orbital injection to mice, and Alba Pesini, PhD, for assistance in calculating vector genomes per nucleus. Funding Sources: This work was supported by research grants from the National Institutes of Health (NIH; P01 HD32062) (to M.H.) and Department of Defense (W81XWH2010807). M.H. is supported by the Arturo Estopinan TK2 Research Fund, Nicholas Nunno Foundation, JDM Fund for Mitochondrial Research, Shuman Mitochondrial Disease Fund, and the Marriott Mitochondrial Disease Clinic Research Fund (MMDCRF) from the J. Willard and Alice S. Marriott Foundation. M.H. also acknowledges support from NIH U54 NS078059 from NINDS and NICHD.
Footnotes
Additional supporting information can be found in the online version of this article.
Potential Conflicts of Interest
Columbia University has a patent for deoxynucleoside therapies for mitochondrial DNA depletion syndrome including TK2 deficiency, which is licensed to Modis Therapeutics a wholly owned subsidiary of Zogenix Inc.; this relationship is monitored by an unconflicted external academic researcher. Dr. Hirano is a co-inventor of this patent. CUIMC has received royalty payments related to the development and commercialization of the technology; Dr. Hirano has received shares of the royalty payments following Columbia University policies. M.H. is a paid consultant to Modis Therapeutics, Inc. This relationship is de minimus for Columbia University Medical Center (to M.H.). Drs. Michio Hirano, Hasan O. Akman, and Carlos Lopez-Gomez are listed as co-inventors of a pending Columbia University patent for gene therapy for TK2 deficiency. The other authors declare no conflicts of interest.
References
- 1.Garone C, Taylor RW, Nascimento A, et al. Retrospective natural history of thymidine kinase 2 deficiency. J Med Genet 2018;55: 515–521. [DOI] [PMC free article] [PubMed] [Google Scholar]
- 2.Dorado B, Area E, Akman HO, et al. Onset and organ specificity of Tk2 deficiency depends on Tk1 down-regulation and transcriptional compensation. Hum Mol Genet 2011;20:155–164. [DOI] [PMC free article] [PubMed] [Google Scholar]
- 3.Akman HO, Dorado B, Lopez LC, et al. Thymidine kinase 2 (H126N) knockin mice show the essential role of balanced deoxynucleotide pools for mitochondrial DNA maintenance. Hum Mol Genet 2008; 17:2433–2440. [DOI] [PMC free article] [PubMed] [Google Scholar]
- 4.Blazquez-Bermejo C, Molina-Granada D, Vila-Julia F, et al. Age-related metabolic changes limit efficacy of deoxynucleoside-based therapy in thymidine kinase 2-deficient mice. EBioMedicine 2019;46: 342–355. [DOI] [PMC free article] [PubMed] [Google Scholar]
- 5.Lopez-Gomez C, Levy RJ, Sanchez-Quintero MJ, et al. Deoxycytidine and Deoxythymidine treatment for thymidine kinase 2 deficiency. Ann Neurol 2017;81:641–652. [DOI] [PMC free article] [PubMed] [Google Scholar]
- 6.Dominguez-Gonzalez C, Madruga-Garrido M, Mavillard F, et al. Deoxynucleoside therapy for thymidine kinase 2-deficient myopathy. Ann Neurol 2019;86:293–303. [DOI] [PMC free article] [PubMed] [Google Scholar]
- 7.Lopez-Gomez C, Hewan H, Sierra C, et al. Bioavailability and cytosolic kinases modulate response to deoxynucleoside therapy in TK2 deficiency. EBioMedicine 2019;46:356–367. [DOI] [PMC free article] [PubMed] [Google Scholar]
- 8.Wang D, Tai PWL, Gao G. Adeno-associated virus vector as a platform for gene therapy delivery. Nat Rev Drug Discov 2019;18:358–378. [DOI] [PMC free article] [PubMed] [Google Scholar]
- 9.Mendell JR, Sahenk Z, Malik V, et al. A phase 1/2a follistatin gene therapy trial for Becker muscular dystrophy. Mol Ther 2015;23:192–201. [DOI] [PMC free article] [PubMed] [Google Scholar]
- 10.D’Avola D, Lopez-Franco E, Sangro B, et al. Phase I open label liver-directed gene therapy clinical trial for acute intermittent porphyria. J Hepatol 2016;65:776–783. [DOI] [PubMed] [Google Scholar]
- 11.Cukras C, Wiley HE, Jeffrey BG, et al. Retinal AAV8-RS1 gene therapy for X-linked Retinoschisis: initial findings from a phase I/IIa trial by intravitreal delivery. Mol Ther 2018;26:2282–2294. [DOI] [PMC free article] [PubMed] [Google Scholar]
- 12.Rakoczy EP, Magno AL, Lai CM, et al. Three-year follow-up of phase 1 and 2a rAAV.sFLT-1 subretinal gene therapy trials for exudative age-related macular degeneration. Am J Ophthalmol 2019;204:113–123. [DOI] [PubMed] [Google Scholar]
- 13.Mendell JR, Al-Zaidy S, Shell R, et al. Single-dose gene-replacement therapy for spinal muscular atrophy. N Engl J Med 2017;377:1713–1722. [DOI] [PubMed] [Google Scholar]
- 14.Rashnonejad A, Chermahini GA, Li S, et al. Large-scale production of adeno-associated viral vector Serotype-9 carrying the human survival motor neuron gene. Mol Biotechnol 2016;58:30–36. [DOI] [PMC free article] [PubMed] [Google Scholar]
- 15.Franzolin E, Rampazzo C, Perez-Perez MJ, et al. Bromovinyl-deoxyuridine: a selective substrate for mitochondrial thymidine kinase in cell extracts. Biochem Biophys Res Commun 2006;344:30–36. [DOI] [PubMed] [Google Scholar]
- 16.Matic S, Jiang M, Nicholls TJ, et al. Mice lacking the mitochondrial exonuclease MGME1 accumulate mtDNA deletions without developing progeria. Nat Commun 2018;9:1202. [DOI] [PMC free article] [PubMed] [Google Scholar]
- 17.Bostick B, Ghosh A, Yue Y, et al. Systemic AAV-9 transduction in mice is influenced by animal age but not by the route of administration. Gene Ther 2007;14:1605–1609. [DOI] [PubMed] [Google Scholar]
- 18.El-Hattab AW, Scaglia F. Mitochondrial DNA depletion syndromes: review and updates of genetic basis, manifestations, and therapeutic options. Neurotherapeutics 2013;10:186–198. [DOI] [PMC free article] [PubMed] [Google Scholar]
- 19.Yadak R, Sillevis Smitt P, van Gisbergen MW, et al. Mitochondrial Neurogastrointestinal Encephalomyopathy caused by thymidine phosphorylase enzyme deficiency: from pathogenesis to emerging therapeutic options. Front Cell Neurosci 2017;11:31. [DOI] [PMC free article] [PubMed] [Google Scholar]
- 20.Halter J, Schupbach W, Casali C, et al. Allogeneic hematopoietic SCT as treatment option for patients with mitochondrial neurogastrointestinal encephalomyopathy (MNGIE): a consensus conference proposal for a standardized approach. Bone Marrow Transplant 2011;46:330–337. [DOI] [PMC free article] [PubMed] [Google Scholar]
- 21.Nishino I, Spinazzola A, Hirano M. Thymidine phosphorylase gene mutations in MNGIE, a human mitochondrial disorder. Science 1999; 283:689–692. [DOI] [PubMed] [Google Scholar]
- 22.Bax BE, Levene M, Bain MD, et al. Erythrocyte encapsulated thymidine phosphorylase for the treatment of patients with mitochondrial Neurogastrointestinal Encephalomyopathy: study protocol for a multi-Centre, multiple dose, open label trial. J Clin Med 2019;8: 1096. [DOI] [PMC free article] [PubMed] [Google Scholar]
- 23.Kripps K, Nakayuenyongsuk W, Shayota BJ, et al. Successful liver transplantation in mitochondrial neurogastrointestinal encephalomyopathy (MNGIE). Mol Genet Metab 2020;130:58–64. [DOI] [PMC free article] [PubMed] [Google Scholar]
- 24.Krishnan S, Zhou X, Paredes JA, et al. Transgene expression of Drosophila melanogaster nucleoside kinase reverses mitochondrial thymidine kinase 2 deficiency. J Biol Chem 2013;288:5072–5079. [DOI] [PMC free article] [PubMed] [Google Scholar]
- 25.Krishnan S, Paredes JA, Zhou X, et al. Long term expression of Drosophila melanogaster nucleoside kinase in thymidine kinase 2-deficient mice with no lethal effects caused by nucleotide pool imbalances. J Biol Chem 2014;289:32835–32844. [DOI] [PMC free article] [PubMed] [Google Scholar]
- 26.Wang J, Kim E, Dai H, et al. Clinical and molecular spectrum of thymidine kinase 2-related mtDNA maintenance defect. Mol Genet Metab 2018;124:124–130. [DOI] [PubMed] [Google Scholar]
- 27.Takeda S, Takahashi M, Mizukami H, et al. Successful gene transfer using adeno-associated virus vectors into the kidney: comparison among adeno-associated virus serotype 1–5 vectors in vitro and in vivo. Nephron Exp Nephrol 2004;96:e119–e126. [DOI] [PubMed] [Google Scholar]
- 28.Keeler GD, Kumar S, Palaschak B, et al. Gene therapy-induced antigen-specific Tregs inhibit neuro-inflammation and reverse disease in a mouse model of multiple sclerosis. Mol Ther 2018;26:173–183. [DOI] [PMC free article] [PubMed] [Google Scholar]
- 29.Ronzitti G, Gross DA, Mingozzi F. Human immune responses to adeno-associated virus (AAV) vectors. Front Immunol 2020;11:670. [DOI] [PMC free article] [PubMed] [Google Scholar]
Associated Data
This section collects any data citations, data availability statements, or supplementary materials included in this article.


