Abstract
Whole genomic DNA-DNA hybridization has been a cornerstone of bacterial species determination but is not widely used because it is not easily implemented. We have developed a method based on random genome fragments and DNA microarray technology that overcomes the disadvantages of whole-genome DNA-DNA hybridization. Reference genomes of four fluorescent Pseudomonas species were fragmented, and 60 to 96 genome fragments of approximately 1 kb from each strain were spotted on microarrays. Genomes from 12 well-characterized fluorescent Pseudomonas strains were labeled with Cy dyes and hybridized to the arrays. Cluster analysis of the hybridization profiles revealed taxonomic relationships between bacterial strains tested at species to strain level resolution, suggesting that this approach is useful for the identification of bacteria as well as determining the genetic distance among bacteria. Since arrays can contain thousands of DNA spots, a single array has the potential for broad identification capacity. In addition, the method does not require laborious cross-hybridizations and can provide an open database of hybridization profiles, avoiding the limitations of traditional DNA-DNA hybridization.
Bacterial identification methods currently used include analysis of morphological, physiological, biochemical, and genetic data. In the last two decades, molecular methods, especially 16S rRNA gene sequencing, have been a reliable aid to the identification of diverse bacteria. Although the 16S rRNA method has served as a powerful tool for finding phylogenetic relationships among bacteria (24), because of its molecular clock properties and the large database for sequence comparison, the molecule is too conserved to provide good resolution at the species and subspecies levels (2, 4, 9, 20, 23). The relationship between 16S rRNA gene similarity and percent DNA-DNA reassociation is a logarithmic function in which the sequence similarity within a species (>70% DNA relatedness) is expected to be >98% (3), and the similarity among different species in a genus, e.g., fluorescent Pseudmonas spp., is 93.3 to ∼99.9% (11). Considering the high sequence conservation and relative standard errors at 98 and 90% sequence similarities of 19 and 8%, respectively (5), 16S rDNA analysis results on closely related strains could be inaccurate and inconsistent with the results obtained by other methods. Incongruity between genome structure and 16S rDNA sequence similarity was also reported (8). Since many important ecological and clinical characteristics of bacteria, such as pathogenicity, competitiveness, substrate range, and bioactive molecule production, vary below the species level, methods with higher resolution than that of 16S rDNA sequencing are needed.
DNA-DNA hybridization is one method that provides more resolution than 16S rDNA sequencing, and the 70% criterion (22) has been a cornerstone for describing a bacterial species. In spite of these values, the method is not popular. Major disadvantages are the laborious nature of pairwise cross-hybridizations, the requirement for isotope use, and the impossibility of establishing a central database.
Here, we propose a new approach to identify and type bacteria based on genomic DNA-DNA similarity that eliminates the above disadvantages. The method takes advantage of the capacity provided by microarray technology (6). Bacterial genomes are fragmented randomly, and representative fragments are spotted on a glass slide and then hybridized to test genomes. Resulting hybridization profiles are used in statistical procedures to identify test strains. Importantly, a database of hybridization profiles can be established. This paper describes this method and its evaluation with previously characterized fluorescent Pseudomonas strains.
MATERIALS AND METHODS
Bacterial strains and DNA extraction.
The Pseudomonas strains used in this study were Pseudomonas fluorescens ATCC 13525T, P. fluorescens ATCC 17397, P. fluorescens ATCC 17400, P. fluorescens ATCC 17467, P. fluorescens ATCC 33512, P. marginalis LMG 5039, P. chlororaphis ATCC 9447, P. chlororaphis ATCC 17811, P. aureofaciens ATCC 13985T, P. putida ATCC 12633T, P. aeruginosa ATCC 15692, and P. aeruginosa ATCC 17429. All strains were routinely cultivated at 30°C in nutrient broth medium (Difco, Detroit, Mich.). Genomic DNAs from the strains were extracted and purified using Genomic Tips (Qiagen, Valencia, Calif.) with Genomic DNA Buffer Set (Qiagen). The concentration of DNA was determined by UV spectrophotometry and with SpotCheck (Sigma, St. Louis, Mo.).
Microarray fabrication.
Genomic DNAs from four fluorescent Pseudomonas strains (P. fluorescens ATCC 13525T, P. chlororaphis ATCC 9447, P. putida ATCC 12633T, and P. aeruginosa ATCC 15692, hereafter termed the reference strains) were fragmented by bead beating to ensure randomness, and the fragments were size fractionated (1 to 2 kb) by agarose gel electrophoresis. The QIAquick gel extraction kit (Qiagen) was used to elute and purify DNA from the agarose gel. The genomic DNA fragments were inserted into pPCR-Script Amp vector (Stratagene, La Jolla, Calif.) and then PCR amplified with the T3-T7 promoter primer set. Amplified genomic DNA fragments were purified with a QIAquick 8 PCR purification kit (Qiagen) and quantified with PicoGreen (Molecular Probes, Eugene, Oreg.).
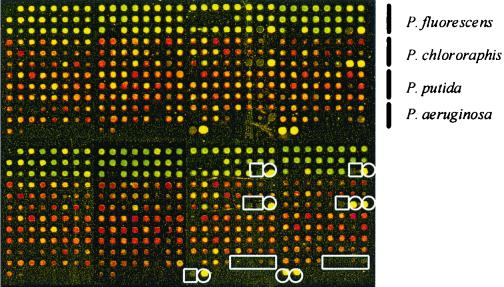
Purified DNAs were resuspended (200 ng/μl) in 3× SSC (1× SSC is 0.15 M NaCl plus 0.015 M sodium citrate) and printed (ca. 1 nl/spot) on CMT-GAPS amino silane-coated slides (Corning Co., Corning, N.Y.). Fragments from P. fluorescens, P. chlororaphis, P. putida and P. aeruginosa (92, 90, 96, and 60, respectively) were spotted in duplicate (Fig. 1). The yeast STE gene (pheromone receptor gene; GenBank accession no. M12239) was spotted as a positive control, and the yeast ACT gene (actin gene; GenBank accession no. L00026), lambda DNA, and water were spotted as negative controls. PCR primer pair STE3F1 (CCC CTT CAAAAT TGG AGC TTG C) and STE3R1 (CCC CCT TTA GCA TGG CAT TCA) and pair ACT1F1 (GAT GGA GCC AAA GCG GTG A) and ACT1R1 (GCG CTT GCA CCATCC CAT T) were used to amplify yeast genes STE and ACT, respectively.
FIG. 1.
Format of the array used in this study. Genome fragments from four reference strains were spotted in duplicate (upper and lower halves). Positive (yeast gene STE) and negative (yeast gene ACT, lambda DNA, and water) controls are indicated by circles and squares, respectively. Pseudocolors indicate the ratio (R) between the Cy3 channel and Cy5 channel (green, R > 1; yellow, R = 1; red, R < 1).
After drying, the slides were processed with the succinic anhydride blocking method according to the manufacturer's protocol and stored at room temperature until use.
Genomic DNA labeling and hybridization.
Genomic DNAs (1 μg) from all the strains listed, including reference strains, were labeled with FluoroLink Cy3-dCTP (Amersham Pharmacia, Piscataway, N.J.) by random priming (High Prime; Roche, Indianapolis, Ind.) and used as test DNAs. Mixtures of genomic DNA (1 μg) from the four reference strains (1:1:1:1) used for microarray fabrication were labeled with FluoroLink Cy5-dCTP (Amersham Pharmacia) and used as reference DNA for signal ratio calculation (Cy3-test/Cy5-reference). Yeast gene STE (10 ng) was included in each labeling reaction as a positive control as well as an internal standard (IS; Cy3-IS and Cy5-IS) for labeling-efficiency correction.
The arrays were prehybridized in prehybridization buffer (3.5× SSC, 0.1% sodium dodecyl sulfate [SDS], 10 mg of bovine serum albumin per ml) for 20 min at 65°C, hybridized with approximately 1 μg of Cy3- and Cy5-labeled DNA mixture (1:1) in hybridization buffer (3× SSC, 0.1% SDS, 0.5 mg of yeast tRNA per ml) at 65°C overnight, and then washed once with primary wash buffer (0.1× SSC, 0.1% SDS) at room temperature for 5 min and twice with secondary wash buffer (0.1× SSC) for 5 min.
Scanning and data processing.
Hybridized arrays were scanned with a GenePix 4000 laser scanner (Axon, Foster City, Calif.). Laser lights of wavelengths at 532 and 635 nm were used to excite Cy3 and Cy5 dye, respectively. Fluorescent images were captured as multi-image-tagged image file format and analyzed with GenePix Pro 3.0 software (Axon). The ratio (R) of the extent of hybridization between test DNAs and reference DNAs was derived from a median value of pixel-by-pixel ratios. By using this approach to calculate R, nonspecific signals, which appear in both wavelength images, had less of an effect than when the mean values of a whole spot were used.
Hybridization signal ratios (R) between test DNA and reference DNA (Cy3-Test/Cy5-Ref) were calculated and corrected with the correction factor (c = Cy5-IS/Cy3-IS) from the internal standard (yeast gene STE) (corrected signal ratio R′ = c × [Cy3-Test/Cy5-Ref]). Spearman correlation coefficients (r) were calculated to find relationships between hybridization patterns and transformed to a percentage scale. Unweighted arithmetic average clustering (UPGMA) was used for hierarchical data ordination. For characterizing the shape of hybridization signal distribution, the evenness (E) value of each spotted genome fragment was calculated based on information theory using E = (− Σ p log p)/log q (7, 15), where p is the relative proportion of hybridization signal ratio (R′) and q is the total number of hybridizations performed. Since the distribution of the calculated E values was highly skewed (skewness = −0.855), the E values were normalized by arc cosine transformation. The arc cosine-transformed evenness value, θE, was used to represent the degree of conservation of each genome fragment.
Microsoft Excel, Systat (SPSS, Chicago, Ill.), and NTSYS-pc (Exeter Software, East Setauket, N.Y.) were used for all statistical calculations.
RESULTS AND DISCUSSION
Reproducibility.
The ratio of Cy5 to Cy3 incorporation (Cy5-IS/Cy3-IS) during the DNA labeling was 1.04 ± 0.32 for all experiments. An incorporation ratio (c = Cy5-IS/Cy3-IS) obtained for each microarray was used as a correction factor for hybridization signal calibration (corrected signal ratio R′ = c × [Cy3-Test/Cy5-Ref]). The correction factor, however, did not affect the correlation coefficient calculation, since the correlation coefficient is independent of any constant (e.g., c).
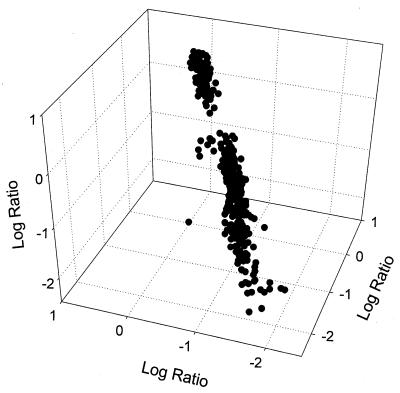
In order to test the reproducibility of array hybridization, seven arrays were hybridized to genomic DNAs of P. fluorescens ATCC 13525T (three times), P. putida ATCC 12633T (two times), and P. aeruginosa ATCC 15692 (two times). Figure 2 shows the scatter plot representation of triplicate hybridization profiles of P. fluorescens ATCC 13525T. The arrays hybridized to P. fluorescens ATCC 13525T (triplicate), P. putida ATCC 12633T (duplicate), and P. aeruginosa ATCC 15692 (duplicate) showed similarity values of >97.5% (r > 0.949, P < 0.0001), 95.3% (r = 0.906, P < 0.0001), and 94.1% (r = 0.882, P < 0.0001), respectively.
FIG. 2.
Scatter plot diagram of hybridization profiles of P. fluorescens ATCC 13525T. Results from triplicate hybridization experiments (r2 = 0.94) are displayed, and each axis (x, y, and z) represents the log-transformed hybridization signal ratios from each experiment.
Resolution.
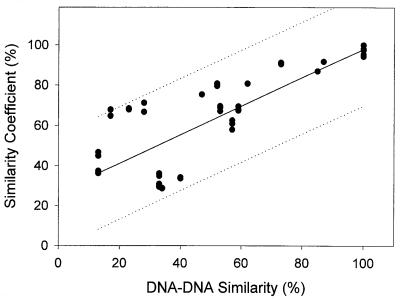
Regression analysis showed a good agreement between DNA-DNA reassociation values and the similarity coefficients obtained from this study (Fig. 3). The coefficient of determination (r2) was 0.713. Order 1 of linear relationship and the regression coefficient (slope, 0.718) indicate that the microarray method is similar in resolution to the whole-genome DNA-DNA hybridization method. The two methods lost their linear relationships below 50% DNA-DNA similarity, which approximately corresponds to a 60% similarity coefficient obtained by the DNA microarray method.
FIG. 3.
Relationship between previously reported whole-genome DNA similarity values (12, 13) and similarity values obtained by the microarray method. The solid line and dotted lines indicate the regression curve and 95% prediction interval, respectively.
A similar result was observed with the relationship between repetitive extragenic palindromic (REP)-PCR genomic DNA fingerprint similarity and percent DNA similarity values (16). REP-PCR fingerprinting (17) lost resolution when applied to strains of less than 70% DNA similarity, indicating that REP-PCR fingerprinting is capable of resolving relationships only among very closely related strains. The DNA chip method used here showed linearity over a broader span of DNA similarity values (50 to 100%) but provided slightly less resolution at >70% DNA similarity values than for the REP-PCR fingerprinting method. The microarray method, however, can still resolve closely related strains and, more importantly, provides resolution over the gap between REP-PCR fingerprinting and 16S rDNA analysis (1).
We have considered the case where different strains of the same species have differences in genome size, e.g., Escherichia coli K-12 versus O157 (GenBank accession no. U00096 and AE005174, respectively). This scale of difference (1 of 5 Mb) should not invalidate our approach, although our percent similarity should be slightly higher than the average percent similarity from whole-genome DNA-DNA hybridization.
Cluster analyses.
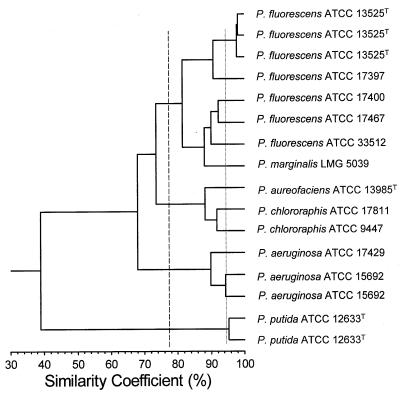
The overall topology of the dendrogram based on cluster analysis of similarity coefficient matrix was consistent with the phylogenetic tree obtained from 16S rDNA sequence data (11) except for P. putida and P. aeruginosa clusters (Fig. 4). The P. aeruginosa group clustered with the P. fluorescens and P. chlororaphis groups at a higher similarity (67.9%) than for the P. putida group (39.0%), of which generally shows greater 16S rDNA similarity to P. fluorescens and P. chlororaphis than to P. aeruginosa (11). However, a similar result to our array data was reported by Palleroni et al. (13) using DNA-DNA similarity values, where the P. aeruginosa group was found to be a closer relative to P. fluorescens group than was the P. putida group.
FIG. 4.
Similarity dendrogram (UPGMA) of microarray hybridization profiles of fluorescent Pseudomonas strains. The solid line indicates a cutoff value at which all different strains tested were resolved. The dashed line indicates species-level resolution that corresponds to 70% whole-genome DNA hybridization.
All replicate experiments showed similarity coefficients of ≥94% (r = 0.88), and all different strains were distinguished at similarity values of ≤91% (r = 0.82). Hence, similarity coefficients of <92 to 94% (r = 0.84 to 0.88) can reliably define different hybridization groups. Using the regression equation from Fig. 2, a cutoff value of 77% was calculated to correspond to a 70% DNA similarity value to define “species” (22). This cutoff resolved the P. fluorescens, P. chlororaphis, P. aeruginosa, and P. putida species but did not resolve P. marginalis from P. fluorescens or P. aureofaciens from P. chlororaphis, but these latter pairs of species are known to be very similar by other methods. P. aureofaciens ATCC 13985T and P. chlororaphis ATCC 9447 show 85% DNA similarity (13), and the 16S rDNA similarity between P. aureofaciens and P. chlororaphis and between P. fluorescens and P. marginalis is 99.5 and 99.9%, respectively (results from different strains) (11). P. marginalis is also reported to have very similar characteristics to P. fluorescens and was previously classified as P. fluorescens (10, 14, 18, 21). Hence, it appears that this method has promise for providing reliable guideline values for species or genomovar resolution.
Either the array hybridization profiles (signal ratios) or raw images (microarray scans) can be archived in a World Wide Web server to establish the central database so that researchers can compare their results with the database and consequently identify their strains, analogous to retrieval of RDP data.
The more reference strains whose genome fragments are spotted on the array and more genome fragments spotted from the reference strains, the greater the resolution and the consistency of this approach are likely to be. We used 338 genome fragments from four reference strains in our test model. Considering that the average genome size of fluorescent Pseudomonas strains is approximately 5 Mb and that the size of the genome fragments used is 1 to 2 kb, the array used in this study samples approximately 1 to 3% of a genome. However, supposing that each spot (genome fragment) tests individual genetic characteristics quantitatively, the array performed 338 individual tests for determining the similarity coefficients for one test strain. Sokal and Sneath (19) suggest that more than 60 characters give significant reliability for similarity coefficients and enough information for numerical taxonomy. In fact, all of our similarity coefficients were statistically significant (P < 0.0001).
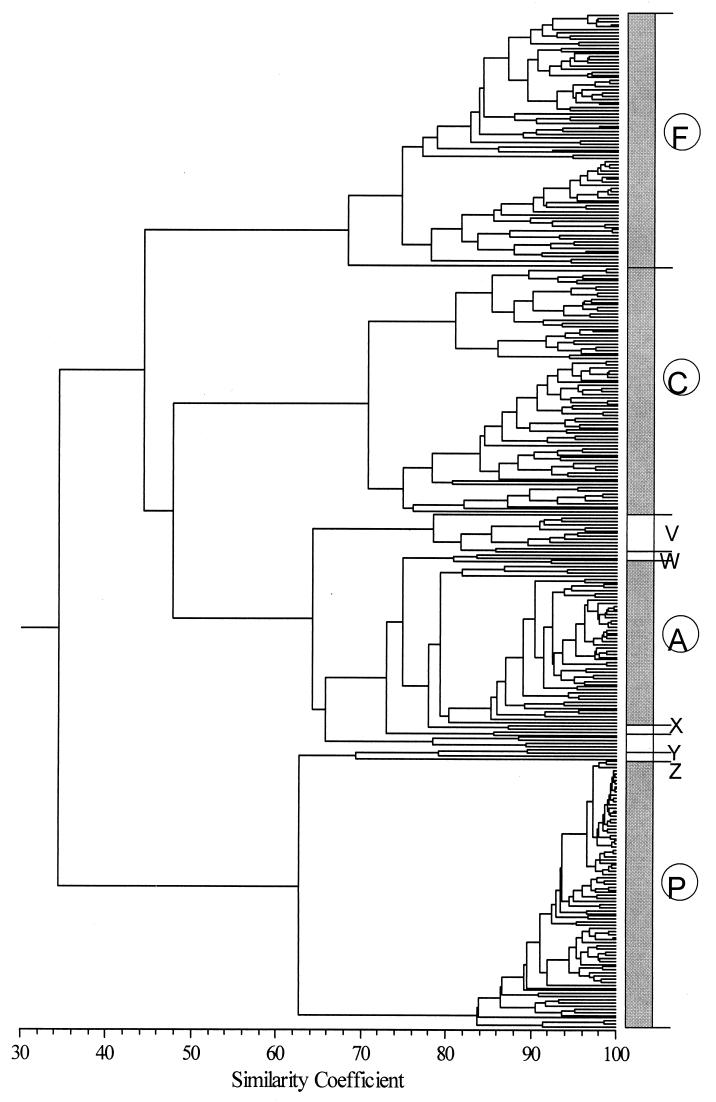
Cluster analysis was also performed on the hybridization patterns of all 338 spotted fragments across all strains tested (Fig. 5). Four main clusters were found at a cophenetic similarity of 70%. Main clusters F, C, A, and P mainly comprised the fragments from the four reference strains, P. fluorescens (98.7%), P. chlororaphis (94.1%), P. aeruginosa (91.8%), and P. putida (100%). Minor clusters V, W, X, and Z comprised the genome fragments from different reference strains. In a gene expression data analysis, such clusters indicate that these genes tend to turn on and off simultaneously, but the grouping in this study indicates only that the hybridization patterns of the cluster members are similar to a certain degree. If the genome fragments from the different reference strains form such a cluster, it suggests but does not confirm conserved sequences.
FIG. 5.
Similarity dendrogram (UPGMA) of hybridization profiles of 338 genome fragments spotted on the microarray. Clusters F (98.7%), C (94.1%), A (91.8%), P (100%), and Y (100%) comprise genome fragments from the reference strains P. fluorescens ATCC 13525T, P. chlororaphis ATCC 9447, P. aeruginosa ATCC 15692, and P. putida ATCC 12633T. Clusters V to Z comprise genome fragment from different reference strains, except cluster Y.
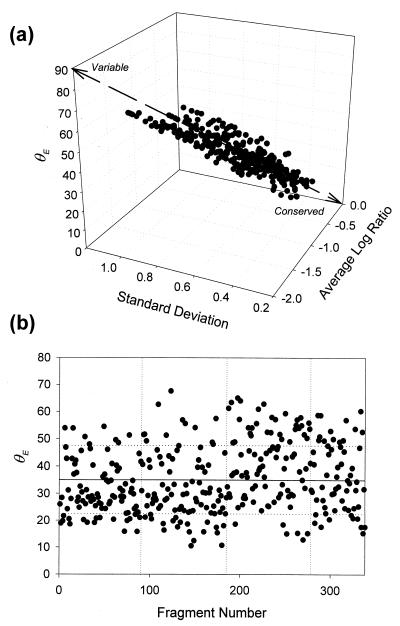
To conveniently find conserved and unique (variable) sequences in our fragment collection, we calculated an evenness index (E) (7, 15) from hybridization signal ratio profiles of each spotted genome fragment across the test strains (Fig. 6). If a fragment is extremely conserved in all test strains (e.g., rRNA genes), the angle (θE) would show its minimum value (0°). Genomic fragments showing a small angle (high evenness) tend to show high hybridization signal ratio with low standard deviation, indicating that they showed as high a hybridization signal as many genomes tested and hence can be considered conserved sequences. In contrast, genomic fragments with a large angle (low evenness) tend to show a low average signal ratio with high standard deviation, indicating that they showed appreciable hybridization signal only to the closely related strains and hence are considered variable sequences.
FIG. 6.
(a) Evenness value (θE) scatter diagram, with average and SD of log hybridization signal ratio. (b) θE values by genome fragment, ID 1 to 92, 93 to 182, 183 to 278, and 279 to 338 originated from P. fluorescens ATCC 13525T, P. chlororaphis ATCC 9447, P. putida ATCC 12633T, and P. aeruginosa ATCC 15692, respectively. The solid line and dotted lines (horizontal) indicate average and SD, respectively.
The average angle (θE) for all data was 35.0° ± 12.5°. Fifty-one (15.1%) fragments with θE values lower than 1 standard deviation (SD) below the mean (<22.5°) (Fig. 6b) showed appreciable hybridization signal (R′ > 1) for the genomic DNAs from closely related species, e.g., species pair P. fluorescens and P. marginalis and pair P. chlororaphis and P. aureofaciens. The majority of these originated from two reference strains, P. fluorescens ATCC 13525T and P. chlororaphis ATCC 9447, including only five fragments from the clusters V, W, X, and Z in Fig. 5. Fragments showing appreciable hybridization (R′ > 1) for all strains tested (e.g., θE << 10°) were not found on our array.
Sixty-eight (20.1%) fragments with θE values of 1 SD above the mean (>47.5°) showed appreciable hybridization only when hybridized to the reference strains. The rest of the fragments (64.8%) showed an intermediate level of conservation. While four main clusters (F, P, C, and A) (Fig. 5) contain all genome fragments with θE values of 22.5° to 47.5° (species level), the groups of highly variable sequences (θE value > 47.5°) (strain level) are also located in the main clusters (Fig. 5). It is noteworthy that the variable and conserved sequences cannot be reliably identified by cluster analysis (Fig. 5), but are easily revealed by θE values.
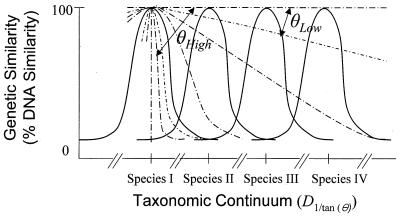
Using the calculated θE values, we can also construct a relationship between θE value and taxonomic distance (Fig. 7), where valley-shaped regions could be considered to be caused by selection pressure, resulting in subsequent speciation events. The genome fragments with low θE values have almost identical sequences and are distributed over a wide taxonomic range, while the fragments with high θE values are distributed over a narrow taxonomic range. When our empirical results (θE values) were applied to this diagram, the degree of conservation within strain level, species level, closely related species level, and genus level correspond roughly to θE values of >50°, 50° to 20°, 20° to 10°, and <10°, respectively. Additionally, a taxonomic distance [D1/tan(θ)] can be calculated {D1/tan(θ) = 1/[tan(θE)]}. The range of θE values for species level (>20°) in this study resulted in a D1/tan (θ) of 2.74, indicating a radius of taxonomic range for a species. This alternative to calculating taxonomic distance by using genome-wide analyses may be useful for delineating species, although the values would be expected to vary with microbial groups.
FIG. 7.
Proposed relationship between θE value and taxonomic distance in taxonomic continuum. Taxonomic continuum is multidimensional, and hence, genetic similarity peaks could also be a multidimensional structure, but diagram is drawn as shown (two-dimensional) for convenience. Broken lines indicate the degree of conservation of genome fragments with different θE values.
Conclusions.
This study provides a proof of concept for identification of bacteria using DNA-DNA hybridization with DNA microarrays, as tested on four reference strains of fluorescent Pseudomonas spp. With current technology of microarray fabrication, 100,000 genomic fragments can be spotted on a chip. Hence, it is feasible to test 1,000 reference strains with 100 genome fragments from each reference strain. Such an array should be enough to cover the full taxonomic range of either gram-negative or gram-positive bacteria. This approach also appears to be useful for determining the genetic distance among bacteria as well as for identifying bacterial species.
Major improvements and advantages over the traditional DNA-DNA reassociation approach are that our method does not require cross-hybridization to find genetic relationship between test strains, does not use an isotope, and can utilize an open database of hybridization profiles when standard genome chips for bacteria are available.
ACKNOWLEDGMENTS
We thank Alison Murray for helpful discussion, the MSU-Arabidopsis facility, and Syed Hashsham for microarray facilities.
This research was supported by NSF grant DEB-0075564 and the Center for Microbial Ecology under NSF grant DEB-9120006.
REFERENCES
- 1.Cho J-C, Tiedje J M. Biogeography and degree of endemicity of fluorescent Pseudomonas in soil. Appl Environ Microbiol. 2000;66:5448–5456. doi: 10.1128/aem.66.12.5448-5456.2000. [DOI] [PMC free article] [PubMed] [Google Scholar]
- 2.DeParasis J, Roth D A. Nucleic acid probes for identification of phytobacteria: identification of genus-specific 16S rRNA sequences. Phytopathology. 1990;80:618–621. [Google Scholar]
- 3.Devereux R, He S H, Doyle C L, Orkland S, Stahl D A, LeGall J, Whitman W B. Diversity and origin of Desulfovibrio species: phylogenetic definition of a family. J Bacteriol. 1990;172:3609–3619. doi: 10.1128/jb.172.7.3609-3619.1990. [DOI] [PMC free article] [PubMed] [Google Scholar]
- 4.Fox G E, Wisotzkey J D, Jurtshuk P., Jr How close is close: 16S rRNA sequence identity may not be sufficient to guarantee species identity. Int J Syst Bacteriol. 1992;42:166–170. doi: 10.1099/00207713-42-1-166. [DOI] [PubMed] [Google Scholar]
- 5.Keswani J, Orkand S, Premachandran U, Mandelco L, Franklin M J, Whitman W B. Phylogeny and taxonomy of mesophilic Methanococcus spp. and comparison of rRNA, DNA hybridization, and phenotypic method. Int J Syst Bacteriol. 1996;46:727–735. doi: 10.1099/00207713-46-3-727. [DOI] [PubMed] [Google Scholar]
- 6.Lander E S. Array of hope. Nat Genet. 1999;21:3–4. doi: 10.1038/4427. [DOI] [PubMed] [Google Scholar]
- 7.Legendre P, Legendre L. Numerical ecology. Amsterdam, The Netherlands: Elsevier Science; 1998. [Google Scholar]
- 8.Lessie T G, Hendrickson W, Manning B D, Devereux R. Genomic complexity and plasticity of Burkholderia cepacia. FEMS Microbiol Lett. 1996;144:117–128. doi: 10.1111/j.1574-6968.1996.tb08517.x. [DOI] [PubMed] [Google Scholar]
- 9.Martinez-Murcia A J, Benlloch S, Collins M D. Phylogenetic interrelationships of members of the genera Aeromonas and Plesiomonas as determined by 16S ribosomal DNA sequencing: lack of congruence with results of DNA-DNA hybridizations. Int J Syst Bacteriol. 1992;42:412–421. doi: 10.1099/00207713-42-3-412. [DOI] [PubMed] [Google Scholar]
- 10.Misaghi I, Grogan R G. Nutritional and biochemical comparisons of plant-pathogenic and saprophytic fluorescent pseudomonads. Phytopathology. 1969;59:1436–1450. [PubMed] [Google Scholar]
- 11.Moore E R B, Mau M, Arnscheidt A, Böttger E C, Hutson R A, Collins M D, van de Peer Y, de Wachter R, Timmis K N. The determination and comparison of the 16S rRNA gene sequences of species of the genus Pseudomonas (sensu stricto) and estimation of the natural intrageneric relationship. Syst Appl Microbiol. 1996;19:478–492. [Google Scholar]
- 12.Palleroni N, Kunisawa R, Contopoulou R, Doudoroff M. Nucleic acid homologies in the genus Pseudomonas. Int J Syst Bacteriol. 1973;23:333–339. [Google Scholar]
- 13.Palleroni N J, Ballard R W, Ralston E, Doudoroff M. Deoxyribonucleic acid homologies among some Pseudomonas species. J Bacteriol. 1972;110:1–11. doi: 10.1128/jb.110.1.1-11.1972. [DOI] [PMC free article] [PubMed] [Google Scholar]
- 14.Pecknold P C, Grogan R G. Deoxyribonucleic acid homology groups among phytopathogenic Pseudomonas species. Int J Syst Bacteriol. 1973;23:111–121. [Google Scholar]
- 15.Pielou E C. The measurement of diversity in different types of biological collections. J Theor Biol. 1966;13:131–144. [Google Scholar]
- 16.Rademaker J L W, Hoste B, Louws F J, Kersters K, Swings J, Vauterin L, Vauterin P, deBruijn F J. Comparison of AFLP and rep-PCR genomic fingerprinting with DNA-DNA homology studies: Xanthomonas as a model system. Int J Syst Evol Microbiol. 2000;50:665–677. doi: 10.1099/00207713-50-2-665. [DOI] [PubMed] [Google Scholar]
- 17.Rademaker J L W, Louws F J, de Bruijn F J. Characterization of the diversity of ecologically important microbes by rep-PCR fingerprinting. In: Akkermans A D L, van Elsas J D, de Bruijn F J, editors. Molecular microbial ecology manual, suppl. 3. Dordrecht, The Netherlands: Kluwer Academic Publishers; 1998. pp. 1–26. [Google Scholar]
- 18.Sands D C, Schroth M N, Hildebrand D C. Taxonomy of phytopathogenic pseudomonads. J Bacteriol. 1970;101:9–23. doi: 10.1128/jb.101.1.9-23.1970. [DOI] [PMC free article] [PubMed] [Google Scholar]
- 19.Sokal R R, Sneath P H. Principles of numerical taxonomy. W. H. San Francisco, Calif: Freeman and Company; 1963. [Google Scholar]
- 20.Stackebrandt E, Goebel B M. Taxonomic note: a place for DNA-DNA reassociation and 16S rRNA sequence analysis in the present species definition in bacteriology. Int J Syst Bacteriol. 1994;44:846–849. [Google Scholar]
- 21.Stanier R Y, Palleroni N J, Doudoroff M. The aerobic pseudomonads: a taxonomic study. J Gen Microbiol. 1966;43:159–271. doi: 10.1099/00221287-43-2-159. [DOI] [PubMed] [Google Scholar]
- 22.Wayne L G, Brenner D J, Colwell R R, Grimont P A D, Kandler O, Krichevsky M I, Truper H G. Report of the ad hoc committee on reconciliation of approaches to bacterial systematics. Int J Syst Bacteriol. 1987;37:463–464. [Google Scholar]
- 23.Weisburg W G, Barns S M, Pelletier D A, Lane D J. 16S ribosomal DNA amplification for phylogenetic study. J Bacteriol. 1991;173:697–703. doi: 10.1128/jb.173.2.697-703.1991. [DOI] [PMC free article] [PubMed] [Google Scholar]
- 24.Woese C R. Bacterial evolution. Microbiol Rev. 1987;51:221–271. doi: 10.1128/mr.51.2.221-271.1987. [DOI] [PMC free article] [PubMed] [Google Scholar]


