

Abstract
We propose a novel variational autoencoder (VAE) framework for learning representations of cell images for the domain of image-based profiling, important for new therapeutic discovery. Previously, generative adversarial network-based (GAN) approaches were proposed to enable biologists to visualize structural variations in cells that drive differences in populations. However, while the images were realistic, they did not provide direct reconstructions from representations, and their performance in downstream analysis was poor.
We address these limitations in our approach by adding an adversarial-driven similarity constraint applied to the standard VAE framework, and a progressive training procedure that allows higher quality reconstructions than standard VAE’s. The proposed models improve classification accuracy by 22% (to 90%) compared to the best reported GAN model, making it competitive with other models that have higher quality representations, but lack the ability to synthesize images. This provides researchers a new tool to match cellular phenotypes effectively, and also to gain better insight into cellular structure variations that are driving differences between populations of cells.
Keywords: Image-based Profiling, Variational Auto-Encoder, Adversarial Training, Biological Interpretability, Fluorescence Microscopy
1. Introduction
Microscopy images provide rich information about cell state. Image-based profiling—an approach where images of cells are used as a data source—is a powerful tool with several applications in drug discovery and biomedicine (Caicedo et al., 2016).
Cell samples are treated using chemical or genetic perturbations, then stained using fluorescent markers, and imaged under a microscope. Image-based profiles of these genes or compounds are created by summarizing the single-cell level information extracted from these images. When executed using high-throughput technologies, this framework can be used to generate profiles of tens to hundreds of thousands of perturbations.
Creating profiles that accurately capture variations in cellular structure is an open problem (Caicedo et al., 2016). Central to this problem is the task of generating representations of single cells, which can then be appropriately summarized into a profile representing the population (e.g. as the mean of the individual cell representations). In recent years, several methods have been proposed for generating single cell representations, spanning both feature engineering approaches (Ljosa et al., 2013), as well as feature learning using deep neural networks (Ando et al., 2017; Caicedo et al., 2018; Pawlowski et al., 2016; Godinez et al., 2017, 2018). While the resulting profiles perform well in downstream analysis, none are able to provide much biological insight into what cellular structure variations are important for discerning phenotypes (i.e. visible appearance). This lack of insight hinders a better understanding of what drives similarities or differences between perturbations.
Recently, generative adversarial networks (GANs) were shown to learn feature representations (Goldsborough et al., 2017), while also to synthesize cell images to help biologists visualize salient phenotypic variations. However, while the images generated were highly realistic, the accuracy of resulting profiles was relatively poor, and a direct reconstruction from the learned representations was not possible.
Here, we propose using an adversarial-driven similarity constraint applied to the standard variational autoencoder (VAE) framework (Kingma and Welling, 2014) that addresses these limitations: (1) VAEs enable direct reconstruction given a feature representation, (2) our proposed model is demonstrably better in learning representations for profiling applications, and (3) our proposed training procedure allows higher quality reconstructions than standard VAEs, making the visualizations comparable with previous GAN models.
By proposing a novel training procedure for learning representations of single cells, we provide researchers a new tool to match cellular phenotypes effectively, and also to gain greater insight into cellular structure variations that are driving differences between populations, offering insights into gene and drug function.
2. Related Work
Image-based profiling measures multiple phenotypic features of single cells to characterize the effect of drugs or the function of genes. The phenotypic features can be obtained by engineering representations that capture known relevant properties of cell state, such as cell size. Previous studies using feature engineering approaches demonstrate that profiles generated using standard feature sets in bioimaging software (e.g. CellProfiler (McQuin et al., 2018)) are successful in grouping compounds based on mechanism-of-action (Ljosa et al., 2013; Perlman et al., 2004; Young et al., 2008; Reisen et al., 2015; Ochoa et al., 2015), grouping genes into pathways (Ohya et al., 2005; Fuchs et al., 2010; Rohban et al., 2017), predicting genetic interactions (Horn et al., 2011; Laufer et al., 2013, 2014; Rauscher et al., 2018), and several other applications (Caicedo et al., 2016).
Deep convolutional neural networks (CNN) have been evaluated for computing cellular features using models pretrained on natural images. A deep metric network trained on a large collection of consumer images was evaluated (Ando et al., 2017) for predicting mechanism-of-action in the BBBC021 benchmark dataset (used in this paper), as were CNNs trained on the ImageNet dataset (Pawlowski et al., 2016). Both gave competitive results without requiring cell segmentation or image preprocessing.
Representations can be learned directly from biological images. Multiple instance learning and supervised learning using mechanism-of-action labels directly have been used to train neural networks that process full images without segmentation (Godinez et al., 2017; Kraus et al., 2016). Given that ground truth labels are rarely available for training in high-throughput projects, other strategies that require less supervision have also been explored. Weakly supervised learning using treatment replicates has been proposed to learn single-cell feature embeddings for profiling (Caicedo et al., 2018), and a similar technique has been developed for full fields of view (Godinez et al., 2018).
However, these approaches encode cellular features without an explicit mechanism for interpreting phenotypic variations, a major limitation for many applications in biology. Goldsborough et al. (2017) proposed to tackle this problem using the CytoGAN model to generate explanatory visualizations of cell variations between two treatments, but the models do not allow direct reconstructions, and have relatively poor classification accuracy on at least one benchmark dataset (BBBC021).
Unlike GAN models, autoencoder (AE) models are optimized to learn embeddings that can directly produce good reconstructions, and were successfully applied on cell images (Ruan and Murphy, 2018; Johnson et al., 2017). In particular, the variational autoencoder (VAE) framework (Kingma and Welling, 2014) implies a constraint on the embedding that produces some desired properties: smooth embedding interpolation (Johnson et al., 2017) and disentanglement of generative factors (Higgins et al., 2016). To improve the limited reconstruction quality of standard VAE models, some methods involving adversarial training were proposed (Larsen et al., 2016; Donahue et al., 2017; Dumoulin et al., 2016; Rosca et al., 2017). Here we propose to follow the concept proposed by Larsen et al. (2016) to address the requirements of the cell profiling pipeline (Caicedo et al., 2017), while allowing high-quality reconstructions from the embeddings.
3. Material and Methods
3.1. Datasets
We use the BBBC021 dataset, a popular benchmark for image-based profiling that has been adopted in several studies, mostly for evaluating assignment of chemicals to mechanisms-of-action using the leave-one-compound-out evaluation protocol (Ljosa et al., 2013). The dataset is from a high-throughput experiment performed in multi-well plates; each plate has 96 wells, and in each well, a sample of cells has been treated with a compound at a specific concentration.
The subset used in all profiling experiments, including ours, has 103 unique treatment conditions (i.e. compounds at a specific concentration) representing 12 mechanisms-of-action (Ljosa et al., 2012). After treatment with a given compound, the cells were stained using fluorescent markers for DNA, F-Actin and β-Tubulin and imaged under a microscope, capturing four 3-channel images for each well, and approximately one million cells across the entire dataset. These channels are stacked and treated as RGB images by mapping DNA ↦ R, β-Tubulin ↦ G, F-Actin ↦ B.
3.2. The VAE framework
In this study, we are interested in methods that can directly generate low-dimensional embeddings z and reconstructions of given input images x. Therefore we chose the VAE framework as a baseline (Kingma and Welling, 2014). VAE models consist of an encoder convolutional neural network (CNN) that models an approximation of the posterior qϕ(z|x) on the latent z, parameterized by ϕ, and a decoder CNN that models the likelihood of the data pθ(x|z), parameterized by θ. The model is then optimized by maximizing a lower bound on the marginal log likelihood of the data , with p(z) a defined prior distribution to constrain the embeddings, DKL the Kullback-Leibler divergence, and β an hyper-parameter controlling the strength of this constraint (Kingma and Welling, 2014; Higgins et al., 2016).
3.3. Transition from Pixel-Wise to Adversarial-Driven Reconstructions
The limited reconstruction quality of standard VAE models can be explained by the pixel-wise reconstruction objective related to the Gaussian observation process modeled by pθ(x|z) (Larsen et al., 2016; Mathieu et al., 2016).
Learned similarity
As proposed by Larsen et al. (2016), we define a discriminator CNN with parameters χ that is trained to classify real images x from independent reconstructions . The discriminator outputs the probability for the input to originate from the distribution of real images and is optimized via minimization of the binary cross-entropy.
The activations resulting from the hidden layers of the discriminator Di (x) and are used as additional, synthetic Gaussian observations, with i the layer indices. These observations are drawn from pχ (Di(x)|z), modeled as normal distributions with means and identity covariances. We thus define additional reconstruction losses for every hidden layer i of the discriminator. Figure 1 illustrates how the different losses of the framework arise in the full model pipeline.
Figure 1:
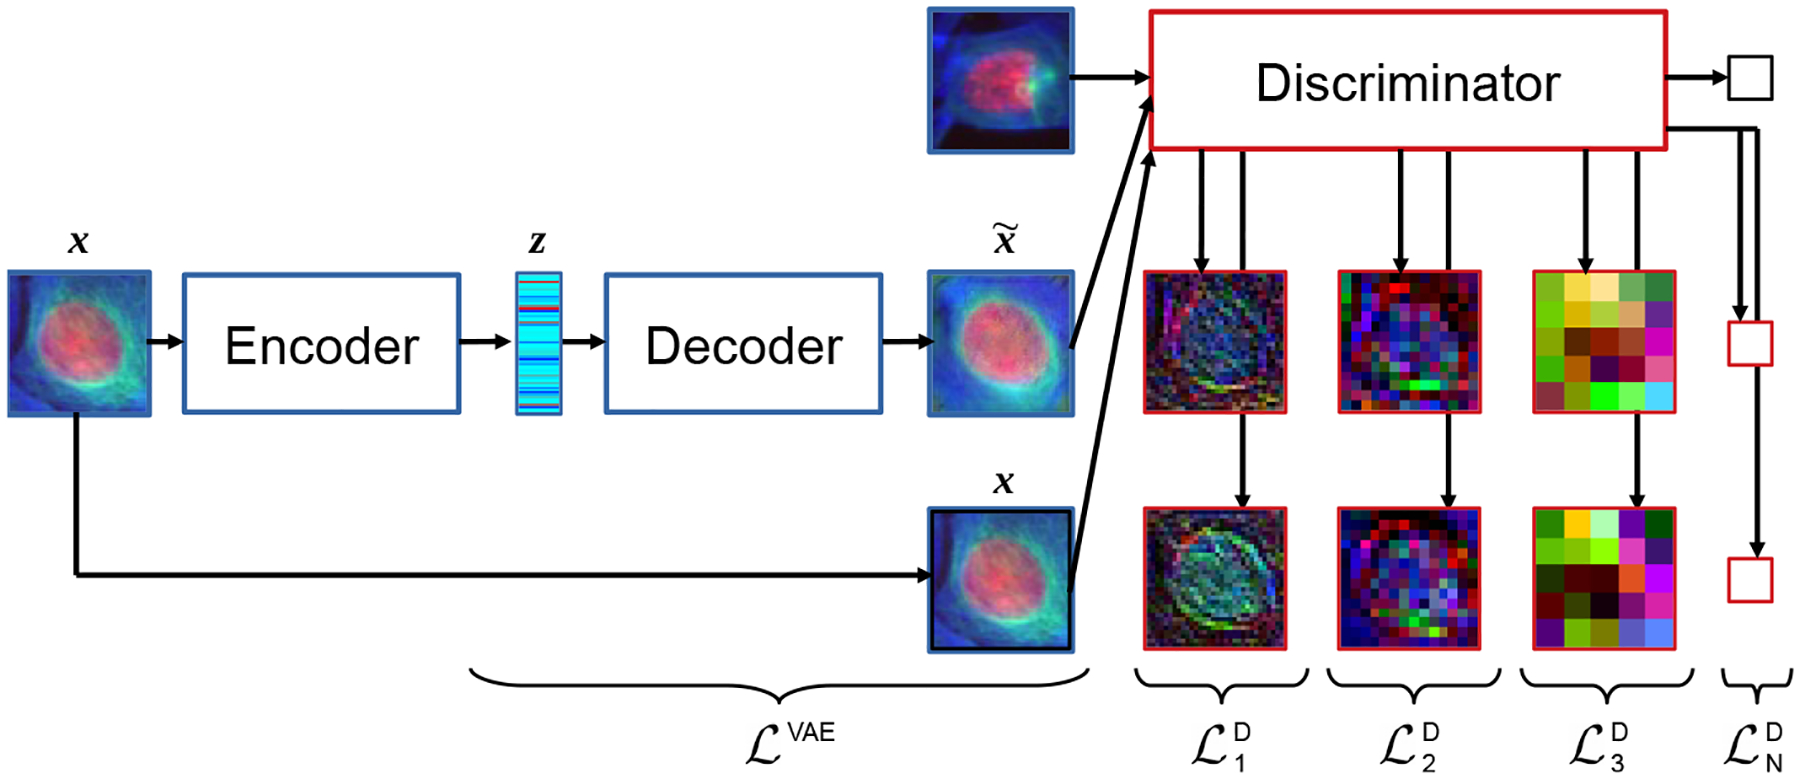
Flowchart of CNN models. The auto-encoder (blue-framed components) describes the original VAE formulation. The adversarial-driven reconstruction losses are illustrated by the representation learned by the discriminator (red-framed images).
Progressive Training
We conjecture that the reconstruction term in should not be discarded and that the additional losses can be all used to compensate the limited reconstruction ability induced by , as opposed to the formulation of Larsen et al. (2016). Therefore, we propose to use as the full objective for the encoder and decoder with , and (γi) a set of parameters to control the contribution of each reconstruction loss.
For stability purposes when dealing with adversarial training Karras et al. (2018), we chose to define the γi(t) as a function of the iteration step t. By defining γi(t) = min(1, max(0, t/T − i)), we induce a progressive training procedure, such that the abstraction levels of the discriminator contribute sequentially to . T is thus the hyper-parameter defining the period between two losses and to contribute to the final objective.
3.4. Model Architectures
The encoder takes image patches of size 68 × 68 as input, and estimates the mean and standard deviation of the Gaussian posterior, that allow sampling an embedding of size 256 using the reparameterization trick Kingma and Welling (2014).
The encoder, decoder and discriminator have four convolution layers with filters of size 5 × 5, with an additional 1 × 1 layer for the last layer of the decoder and an additional fully connected layer for the discriminator. Leaky Rectified Linear Units (coefficient 0.01) and max-pooling/up-sampling layers were used throughout the CNNs, except for the last layer of the discriminator, which is activated by a sigmoid.
The decoder is a mirrored version of the encoder, by using transposed convolutions followed by 2 × 2 up-sampling layers. Batch normalization (BN) layers were used throughout the CNNs, and the BN moments for the discriminator were computed only using batches balanced with input reconstructions and independent real images. The implementation of the model is available at https://github.com/tueimage/cytoVAE.
4. Experiments and Results
4.1. Experiments
We investigated three variations of the proposed model for comparison purposes. We trained standard AE and VAE models by setting the parameter β to 0.0 and 1.0 respectively while excluding from the full objective. The proposed model (VAE+) was trained using the full objective (see Sect. 3.3), β was set to 2.0 to compensate the additional reconstruction losses, and T was set to 2500 iterations.
Mini-batches were built by sampling a random image patch from each treatment of the dataset. Every channel of the image patches was normalized by its maximum intensity. Two independent mini-batches B1 and B2 were used at every iteration: B1 was used to compute through the encoder-decoder, B2 was paired with the reconstructions of B1 to train the discriminator. Finally, B1 and its reconstructions were used to compute .
We used the Adam optimizer to train the encoder and decoder (learning rate 0.001; momentum 0.9), and Stochastic Gradient Descent with momentum (learning rate 0.01; momentum 0.9) to train the discriminator. All the convolutional weights were regularized with weight decay (coefficient 0.0001). Training was stopped after 40,000 iterations.
4.2. Creating Profiles and Classifying Compounds
Given images of cells treated with a compound (the input), the challenge in the BBBC021 dataset is to predict the mechanism-of-action (the label) of the compound. Centers of each cell were precomputed using CellProfiler (McQuin et al., 2018) and were used to extract patches. Representations of these patches were generated using the trained models. Given a representation per cell, a profile for each well was computed as the average of all the cells in that well. Next, the profile for each unique treatment (a compound at a specific concentration) was computed by computing the median of all wells with that treatment. Treatments were classified using 1-nearest-neighbors, using one of two hold-out procedures as proposed by Ando et al. (2017): (1) Not-Same-Compound (NSC), where all profiles of the same compound (regardless of concentration) were held out, and (2) Not-Same-Compound-and-Batch (NSCB), where in addition to NSC constraints, profiles from the same experimental batch where held out.
NSCB indicates how sensitive the profiling method is to variations across experimental batches; better NSCB performance indicates better resilience to batch variations. Ando et al. (2017) transformed the profiles on a given plate using a whitening transform learned from the control wells on that plate, which improved NSCB performance; we tested this procedure (indicated by “Whitened” in Table 1). Further, Rohban et al. (2017) created profiles by summarizing using standard deviations as well as means; we tested this approach (indicated by “Mean+S.D.” in Table 1).
Table 1:
Classification Accuracy of the compared models. Mean result ± standard deviation across 3 repeated experiments with random initialization and random input sampling. The numbers in bold indicate the method-summarization combination that was best performing for each hold-out procedure (NSC and NSCB).
| Method | Mean | Mean+Whitened | Mean+S.D. | Mean+S.D.+Whitened | |
|---|---|---|---|---|---|
| NSC | VAE+ | 90.6 ± 1.5 | 90.3 ± 1.0 | 92.2 ± 1.7 | 92.9 ± 2.4 |
| VAE | 83.5 ± 1.0 | 80.6 ± 4.4 | 90.9 ± 1.1 | 87.1 ± 0.6 | |
| AE | 87.6 ± 2.0 | 92.2 ± 1.0 | 90.3 ± 0.0 | 92.5 ± 0.6 | |
| Ando et al. | N.A | 96.0 | N.A | N.A | |
| Singh et al. | 90.0 | N.A | N.A | N.A | |
| NSCB | VAE+ | 71.0 ± 1.2 | 76.1 ± 1.1 | 72.5 ± 2.3 | 82.2 ± 2.6 |
| VAE | 68.8 ± 0.6 | 69.9 ± 5.1 | 74.6 ± 0.6 | 71.0 ± 0.6 | |
| AE | 75.0 ± 2.0 | 79.0 ± 0.6 | 76.8 ± 0.7 | 80.8 ± 1.7 | |
| Ando et al. | N.A | 95.0 | N.A | N.A | |
| Singh et al. | 85.0 | N.A | N.A | N.A |
4.3. Results
4.3.1. Classification Performances
The proposed VAE model (VAE+ in Table 1) significantly outperforms the best GAN-based models (68% NSC; NSCB unavailable), which is the only model to our knowledge that can provide reconstructions. Further, whitening consistently improves accuracy across all configurations where mean is the summary statistic, and for some where both mean and S.D. are used as summary statistics. The VAE+ model, with mean + S.D. summaries followed by whitening (last column) performs similarly to the best performing classical approach (90% NSC; 85% NSCB Singh et al. (2014)). While none of these models, including VAE+, achieve classification performance as high as the best performing deep-learning-based model (96% NSC; 95% NSCB Ando et al. (2017)), they nonetheless provide valuable insight (discussed below) into the variations in cellular morphologies that underlie the similarities and differences between the treatment conditions. Finally, we observe that the AE model implemented performed very similarly to VAE+. The VAE+ reconstructions are however superior to AE, making the former overall better suited for profiling applications.
4.3.2. Visualizing Structural Variations in Cell Phenotypes
The proposed VAE+ model produces the most realistic images (Figure 2); both AE and VAE images are consistently blurrier than VAE+ images. Similar to Goldsborough et al. (2017), we assessed the quality of reconstructed images by presenting three expert biologists with 50 real cell images and 50 cells reconstructed using VAE+. The cells were balanced across the available treatments, including controls and the biologists were blinded with respect to this treatment information. Images were randomly shuffled and presented to experts to assess whether each cell was real or synthetic. On average, 40.7% of the time the synthetic cells were realistic enough to deceive the experts into labeling them as real, compared to 30% previously reported with GANs (Goldsborough et al., 2017).
Figure 2:
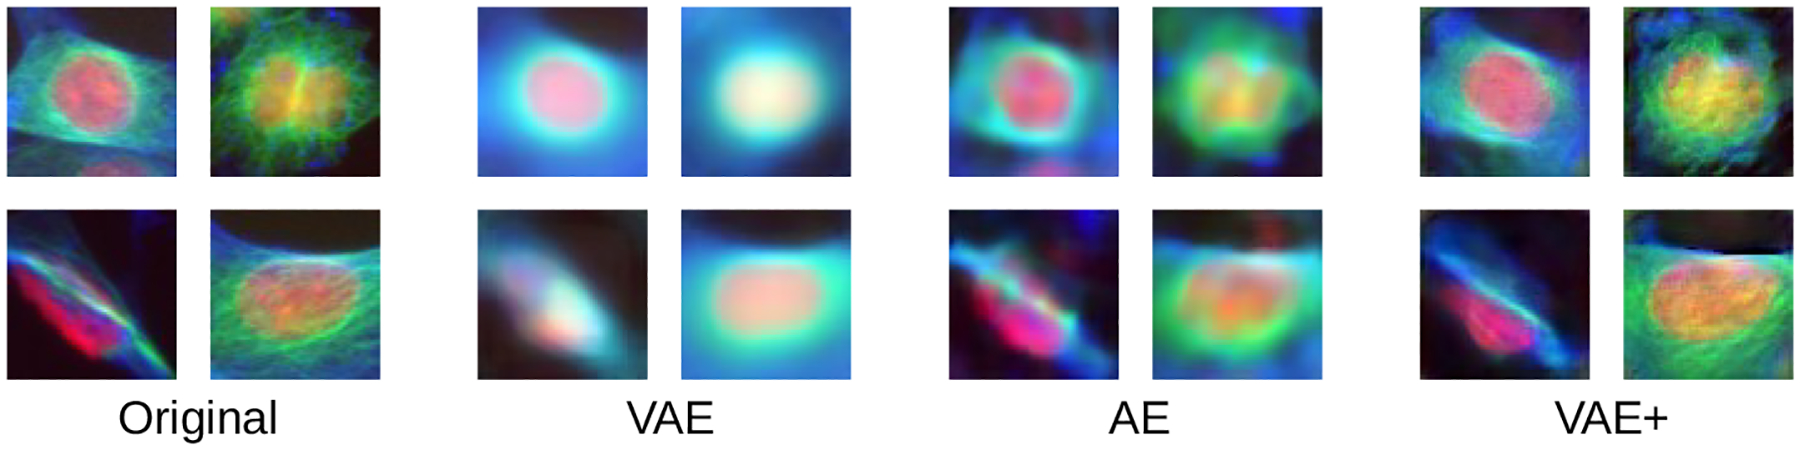
Comparison between original images of four randomly sampled single cells, and their reconstructions produced via different auto-encoders.
The ability to interpolate between real cells from different treatment conditions and produce realistic images is powerful tool to visualize how a compound affects cellular structure (Figure 3). Compounds from different mechanisms induce visually distinct phenotypes. Interpolating between a control cell and a treated cell presents a hypothetical path in phenotypic space that the cell may have taken to arrive at the observed (target) state. Verifying these hypotheses would require further followup experiments. Regardless, these visualizations give valuable insight into how each compound is affecting cellular structure. For instance, an actin disrupting chemical (cytochalasin D) appears to make the cells smaller, with both actin and tubulin condensing more tightly and symmetrically around the nucleus. A cholesterol lowering chemical (simvastatin) has a similar effect but makes the tubulin more asymmetric. Both results match expectations and inspection of real images.
Figure 3:
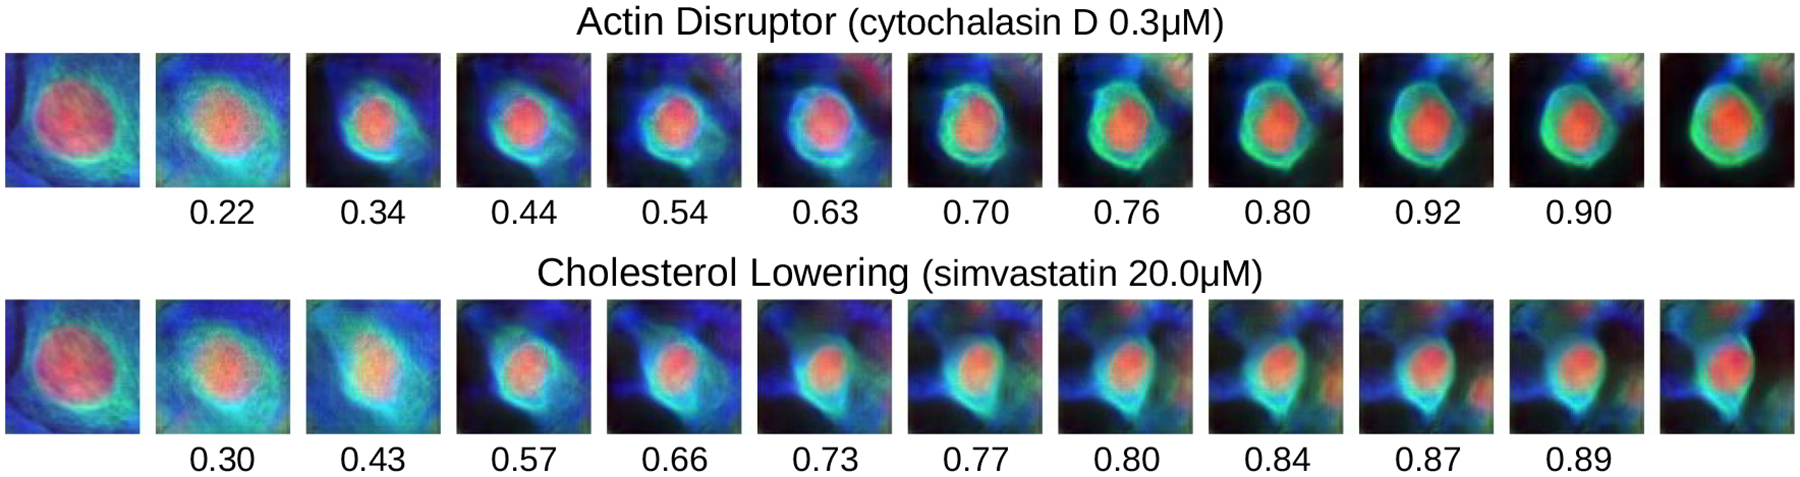
Translation in VAE+ latent space of a control cell (left) to target cells (right) corresponding to compounds with different mechanisms-of-action. The target cell is the one closest to the mean of the compound. Each interpolation step is a shift of features with highest absolute difference w.r.t. the target features. Cosine similarity between the embedding of an image and its target is shown below each.
However, we noticed one interesting anomaly when exploring a case where VAE+ correctly classified a drug and AE did not (recall their overall classification accuracies across all classes are similar (Table 1)). For the drug Nocodazole, a known microtubule destabilizer, AE yields a blurry reconstruction of tubulin while VAE+ yields a more accurate texture (Figure 4). Upon inspection of randomly sampled cell images, however, it becomes clear that neither representation is able to capture the distinctive fragmented nucleus phenotype caused in some cells by Nocodazole. We suspect that the selection of the target cell is thus a crucial choice in the proposed strategy, particularly when a population of cells shows two very distinct types of appearances.
Figure 4:
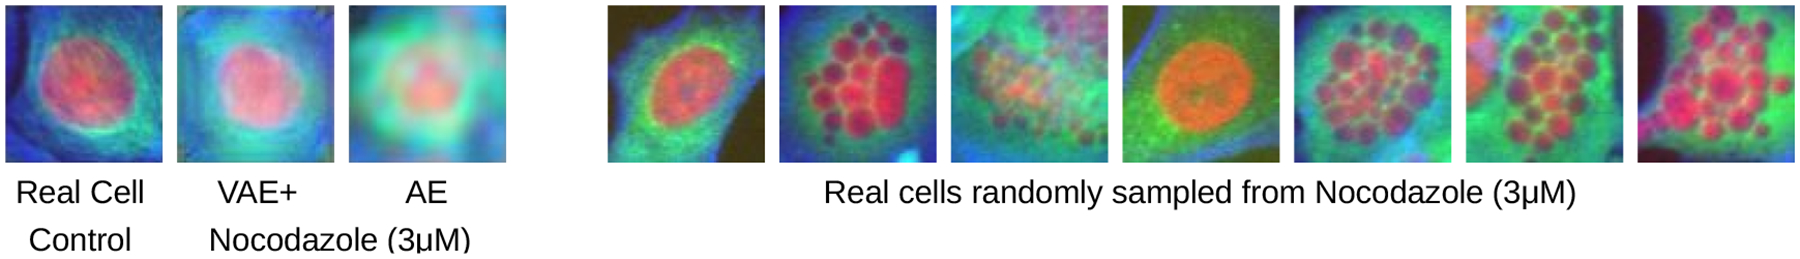
VAE+ captures β-tubulin structure better (less blurry) and correctly identifies Nocodazole as a microtubule destabilizer. AE incorrectly classifies it as an actin disruptor. However, neither captures the fragmented nucleus phenotype seen in a fraction of cells’ real images (right).
5. Conclusions and Discussion
We proposed an auto-encoding approach competitive with other unsupervised learning approaches while overcoming the challenge of high quality reconstructions.
We introduced adversarial-driven representation learning for the problem of image-based profiling using a straightforward extension of the VAE framework, by proposing a generic method inline with the work of Larsen et al. (2016). Some methods are other plausible solutions for this task, such as Adversarially Learned Inference Dumoulin et al. (2016) and are worth investigating for future work.
The unsupervised training context explains the limited classification performances reported here, but could be improved when combined with more effective approaches (weakly/fully supervised training).
This model offers researchers a powerful tool to probe the structural changes in a cell induced by genetic and chemical perturbations, or even disease states. This is a step towards filling the gap of interpretability in image-based profiling approaches: to reveal not just which perturbations are similar or different, but also to provide clues about the underlying biology that makes them so. We identified room for improvement in capturing phenotypes for very heterogeneous cell populations. The proposed strategy may be applied to other domains in biomedical imaging that require capturing phenotypic variations, particularly detecting, understanding, and reversing disease.
Acknowledgments
This work was supported in part by a grant from the COST Action CA15124 (NEUBIAS) and from the National Institutes of Health (MIRA R35 GM122547 to AEC). We thank Peter Goldsborough and Nick Pawlowski for the app to assess real vs. synthetic images, and Drs. Beth Cimini, Minh Doan, and Hamdah Abbasi for doing the assessment. We are grateful to everyone at the Imaging Platform at the Broad for their help throughout this project.
References
- Ando D Michael, McLean Cory, and Berndl Marc. Improving phenotypic measurements in high-content imaging screens. bioRxiv, page 161422, 2017. [Google Scholar]
- Caicedo Juan C, Singh Shantanu, and Carpenter Anne E. Applications in image-based profiling of perturbations. Curr. Opin. Biotechnol, 39:134–142, June 2016. [DOI] [PubMed] [Google Scholar]
- Caicedo Juan C, Cooper Sam, Heigwer Florian, Warchal Scott, Qiu Peng, Molnar Csaba, Vasilevich Aliaksei S, Barry Joseph D, Bansal Harmanjit Singh, Kraus Oren, Wawer Mathias, Paavolainen Lassi, Herrmann Markus D, Rohban Mohammad, Hung Jane, Hennig Holger, Concannon John, Smith Ian, Clemons Paul A, Singh Shantanu, Rees Paul, Horvath Peter, Linington Roger G, and Carpenter Anne E. Data-analysis strategies for image-based cell profiling. Nat. Methods, 14(9):849–863, August 2017. [DOI] [PMC free article] [PubMed] [Google Scholar]
- Caicedo Juan C, McQuin Claire, Goodman Allen, Singh Shantanu, and Carpenter Anne E. Weakly supervised learning of feature embeddings for single cells in microscopy images. IEEE CVPR, 2018. [DOI] [PMC free article] [PubMed] [Google Scholar]
- Donahue Jeff, Krähenbühl Philipp, and Darrell Trevor. Adversarial feature learning. ICLR, 2017. [Google Scholar]
- Dumoulin Vincent, Belghazi Ishmael, Poole Ben, Mastropietro Olivier, Lamb Alex, Arjovsky Martin, and Courville Aaron. Adversarially learned inference. arXiv preprint arXiv:1606.00704, 2016. [Google Scholar]
- Fuchs Florian, Pau Gregoire, Kranz Dominique, Sklyar Oleg, Budjan Christoph, Steinbrink Sandra, Horn Thomas, Pedal Angelika, Huber Wolfgang, and Boutros Michael. Clustering phenotype populations by genome-wide RNAi and multiparametric imaging. Mol. Syst. Biol, 6:370, June 2010. [DOI] [PMC free article] [PubMed] [Google Scholar]
- Godinez William J, Hossain Imtiaz, Lazic Stanley E, Davies John W, and Zhang Xian. A multi-scale convolutional neural network for phenotyping high-content cellular images. Bioinformatics, 33(13):2010–2019, July 2017. [DOI] [PubMed] [Google Scholar]
- Godinez William J, Hossain Imtiaz, and Zhang Xian. Unsupervised phenotypic analysis of cellular images with multi-scale convolutional neural networks. BioRxiv, page 361410, 2018. [Google Scholar]
- Goldsborough Peter, Pawlowski Nick, Caicedo Juan C, Singh Shantanu, and Carpenter Anne. Cytogan: Generative modeling of cell images. bioRxiv, page 227645, 2017. [Google Scholar]
- Higgins Irina, Matthey Loic, Glorot Xavier, Pal Arka, Uria Benigno, Blundell Charles, Mohamed Shakir, and Lerchner Alexander. Early visual concept learning with unsupervised deep learning. arXiv preprint arXiv:1606.05579, 2016. [Google Scholar]
- Horn Thomas, Sandmann Thomas, Fischer Bernd, Axelsson Elin, Huber Wolfgang, and Boutros Michael. Mapping of signaling networks through synthetic genetic interaction analysis by RNAi. Nat. Methods, 8(4):341–346, March 2011. [DOI] [PubMed] [Google Scholar]
- Johnson Gregory R, Donovan-Maiye Rory M, and Maleckar Mary M. Generative modeling with conditional autoencoders: Building an integrated cell. arXiv preprint arXiv:1705.00092, 2017. [Google Scholar]
- Karras Tero, Aila Timo, Laine Samuli, and Lehtinen Jaakko. Progressive growing of gans for improved quality, stability, and variation. ICLR, 2018. [Google Scholar]
- Kingma Diederik P and Welling Max. Auto-encoding variational bayes. ICLR, 2014. [Google Scholar]
- Kraus Oren Z, Ba Jimmy Lei, and Frey Brendan J. Classifying and segmenting microscopy images with deep multiple instance learning. Bioinformatics, 32(12):i52–i59, June 2016. [DOI] [PMC free article] [PubMed] [Google Scholar]
- Larsen Anders Boesen Lindbo, Sønderby Søren Kaae, Larochelle Hugo, and Winther Ole. Autoencoding beyond pixels using a learned similarity metric. ICML, 2016. [Google Scholar]
- Laufer Christina, Fischer Bernd, Billmann Maximilian, Huber Wolfgang, and Boutros Michael. Mapping genetic interactions in human cancer cells with RNAi and multiparametric phenotyping. Nat. Methods, 10(5):427–431, May 2013. [DOI] [PubMed] [Google Scholar]
- Laufer Christina, Fischer Bernd, Huber Wolfgang, and Boutros Michael. Measuring genetic interactions in human cells by RNAi and imaging. Nat. Protoc, 9(10):2341–2353, October 2014. [DOI] [PubMed] [Google Scholar]
- Ljosa Vebjorn, Sokolnicki Katherine L, and Carpenter Anne E. Annotated high-throughput microscopy image sets for validation. Nat. Methods, 9(7):637, July 2012. [DOI] [PMC free article] [PubMed] [Google Scholar]
- Ljosa Vebjorn, Caie Peter D, Horst Rob Ter, Sokolnicki Katherine L, Jenkins Emma L, Daya Sandeep, Roberts Mark E, Jones Thouis R, Singh Shantanu, Genovesio Auguste, Clemons Paul A, Carragher Neil O, and Carpenter Anne E. Comparison of methods for image-based profiling of cellular morphological responses to small-molecule treatment. J. Biomol. Screen, 18(10):1321–1329, December 2013. [DOI] [PMC free article] [PubMed] [Google Scholar]
- Mathieu Michael, Couprie Camille, and LeCun Yann. Deep multi-scale video prediction beyond mean square error. ICLR, 2016. [Google Scholar]
- McQuin Claire, Goodman Allen, Chernyshev Vasiliy, Kamentsky Lee, Cimini Beth A, Karhohs Kyle W, Doan Minh, Ding Liya, Rafelski Susanne M, Thirstrup Derek, and Others. CellProfiler 3.0: Next-generation image processing for biology. PLoS Biol, 16 (7):e2005970, 2018. [DOI] [PMC free article] [PubMed] [Google Scholar]
- Ochoa Jessica L, Bray Walter M, Lokey R Scott, and Linington Roger G. Phenotype-Guided natural products discovery using cytological profiling. J. Nat. Prod, 78(9):2242–2248, September 2015. [DOI] [PMC free article] [PubMed] [Google Scholar]
- Ohya Yoshikazu, Sese Jun, Yukawa Masashi, Sano Fumi, Nakatani Yoichiro, Saito Taro L, Saka Ayaka, Fukuda Tomoyuki, Ishihara Satoru, Oka Satomi, Suzuki Genjiro, Watanabe Machika, Hirata Aiko, Ohtani Miwaka, Sawai Hiroshi, Fraysse Nicolas, Latgé Jean-Paul, François Jean M, Aebi Markus, Tanaka Seiji, Muramatsu Sachiko, Araki Hiroyuki, Sonoike Kintake, Nogami Satoru, and Morishita Shinichi. High-dimensional and large-scale phenotyping of yeast mutants. Proc. Natl. Acad. Sci. U. S. A, 102(52):19015–19020, December 2005. [DOI] [PMC free article] [PubMed] [Google Scholar]
- Pawlowski Nick, Caicedo Juan C, Singh Shantanu, Carpenter Anne E, and Storkey Amos. Automating morphological profiling with generic deep convolutional networks. BioRxiv, page 085118, 2016. [Google Scholar]
- Perlman Zachary E, Slack Michael D, Feng Yan, Mitchison Timothy J, Wu Lani F, and Altschuler Steven J. Multidimensional drug profiling by automated microscopy. Science, 306(5699):1194–1198, November 2004. [DOI] [PubMed] [Google Scholar]
- Rauscher Benedikt, Heigwer Florian, Henkel Luisa, Hielscher Thomas, Voloshanenko Oksana, and Boutros Michael. Toward an integrated map of genetic interactions in cancer cells. Mol. Syst. Biol, 14(2):e7656, February 2018. [DOI] [PMC free article] [PubMed] [Google Scholar]
- Reisen Felix, de Chalon Amelie Sauty, Pfeifer Martin, Zhang Xian, Gabriel Daniela, and Selzer Paul. Linking phenotypes and modes of action through High-Content screen fingerprints. Assay Drug Dev. Technol, 13(7):415–427, September 2015. [DOI] [PubMed] [Google Scholar]
- Rohban Mohammad Hossein, Singh Shantanu, Wu Xiaoyun, Berthet Julia B, Bray Mark-Anthony, Shrestha Yashaswi, Varelas Xaralabos, Boehm Jesse S, and Carpenter Anne E. Systematic morphological profiling of human gene and allele function via cell painting. Elife, 6, March 2017. [DOI] [PMC free article] [PubMed] [Google Scholar]
- Rosca Mihaela, Lakshminarayanan Balaji, Warde-Farley David, and Mohamed Shakir. Variational approaches for auto-encoding generative adversarial networks. arXiv preprint arXiv:1706.04987, 2017. [Google Scholar]
- Ruan Xiongtao and Murphy Robert F. Evaluation of methods for generative modeling of cell and nuclear shape. Bioinformatics, December 2018. [DOI] [PMC free article] [PubMed] [Google Scholar]
- Singh S, Bray M-A, Jones TR, and Carpenter AE. Pipeline for illumination correction of images for high-throughput microscopy. J. Microsc, 256(3):231–236, December 2014. [DOI] [PMC free article] [PubMed] [Google Scholar]
- Young Daniel W, Bender Andreas, Hoyt Jonathan, McWhinnie Elizabeth, Chirn Gung-Wei, Tao Charles Y, Tallarico John A, Labow Mark, Jenkins Jeremy L, Mitchison Timothy J, and Feng Yan. Integrating high-content screening and ligand-target prediction to identify mechanism of action. Nat. Chem. Biol, 4(1):59–68, January 2008. [DOI] [PubMed] [Google Scholar]