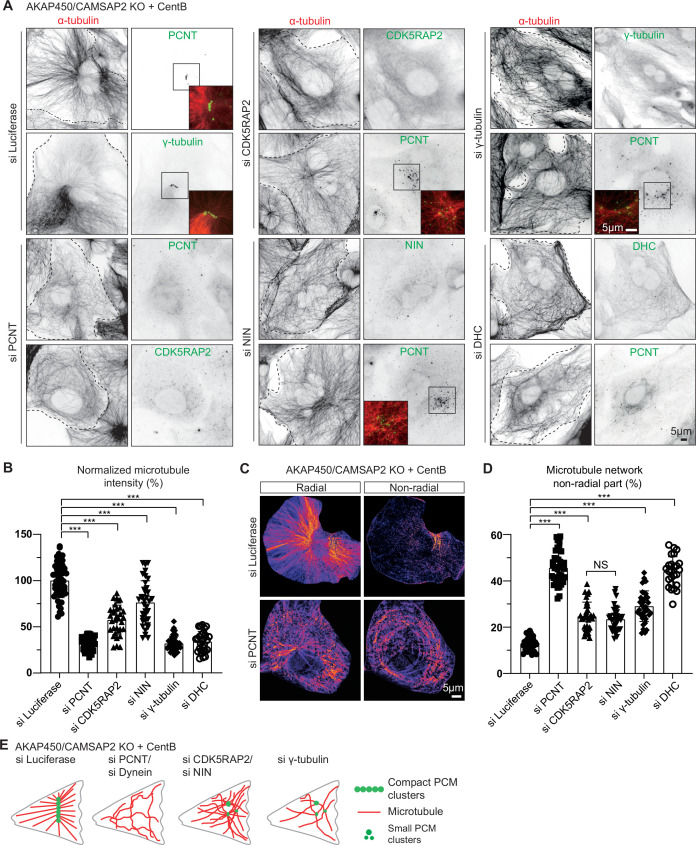
Figure 3. Microtubule organization in acentriolar cells missing different caMTOC components.
(A) Immunofluorescence images of centrinone-treated AKAP450/CAMSAP2 knockout RPE1 cells depleted of the indicated proteins and stained for microtubules (α-tubulin, red) and different PCM proteins (green). Insets show enlargements of the merged channels of the boxed areas and dashed lines show cell boundaries. (B) Quantification of the normalized overall microtubule intensity for the indicated conditions. The number of cells analyzed in three independent experiments: n=56 (siLuci), 45 (siPCNT), 33 (siCDK5RAP2), 36 (siNinein), 43 (siγ-tubulin), and 28 (siDHC). The statistical significance was determined by unpaired two-tailed Mann-Whitney test in Prism 9.1 (***P<0.001). Values represent mean ± SD. (C) Microtubule images were split into a radial and non-radial components (heat maps) based on microtubule orientation in relation to the PCM clusters or the brightest point, as described in Materials and methods. (D) Quantification of the proportion of the non-radial microtubules shown in panel C (see Materials and methods for details). The number of cells analyzed for each measurement in three independent experiments: n=25 (siLuci), 43 (siPCNT), 32 (siCDK5RAP2), 34 (siNinein), 37 (siγ-tubulin), and 25 (siDHC). The statistical significance was determined by unpaired two-tailed Mann-Whitney test in Prism 9.1 (***p<0.001). Values represent mean ± SD. (E) Diagram illustrating the distribution of PCM clusters and microtubule organization upon the depletion of the indicated proteins in centrinone-treated AKAP450/CAMSAP2 knockout cells.

