

Abstract
The effect of long gaming sessions on energy intake, caffeine intake, blood pressure, heart rate, heart rate variability, and biochemical cardiac injury markers is unknown. The objective of this exploratory study was to investigate the changes in healthy male adults during two consecutive 18-hour sedentary video gaming sessions. Nine participants were enrolled in the study. Energy intake was noted in food diaries. Heart rate variability was monitored continuously; blood pressure and cardiac injury markers were measured every three to six hours. During the 42-hour study, the participants had an energy and caffeine intake of 8004.9 kcal and 1354.4 mg, respectively. The participants had a significant decrease in energy intake in the second session (p=0.01). A strong, negative correlation was found between body mass index and total energy intake (R=–0.84, p=0.005) and waist circumference and total energy intake (R=–0.70, p=0.036) in the first session. No nightly dip in blood pressure or heart rate was observed. Based on this study, long-term adverse effects of gaming cannot be ruled out. The non-dip of HR and BP suggests that long gaming sessions could be detrimental to cardiovascular health long term.
Key words: sedentary video gaming, energy intake, caffeine intake, blood pressure, lifestyle, heart rate variability
Introduction
Gaming has become a favorite pastime among children, adolescents, and adults. Competitive gaming (e-sport) is gaining popularity as a spectator sport, collegiate sport, and professional competition 1 . A recent review of the physiological and biochemical effects of gaming found that no studies simulated real-life gaming behavior, i. e., gaming for long hours or even days 2 . Additionally, the authors found that there were no studies of cardiac injury markers. Therefore, this pilot study aimed to explore changes in the physiological parameters and cardiac injury markers during long sedentary video gaming (gaming) sessions and the corresponding eating and drinking behavior.
Among teenage boys and girls in the US, 99and 94%, respectively, play video games 3 . In addition, it has been reported that children spend as much as 7 to 11 hours on weekdays engaged with screen-based after-school activities 4 .
Studies have shown that sedentary gaming increases energy expenditure (EE) compared to other seated activities 5 6 , however, not equivalent to that of physical activity or active gaming 7 8 . Energy intake (EI) has been shown to increase in gamers who played seated video games 5 9 , even as much as in active video games 7 10 . Additionally, gaming has been linked to the overconsumption of sugar-rich soft drinks in children and youths 11 . In children, it has been proposed that a diet "high in calories but low in nutrients” is an indicator of addictive behavior 12 . The effect of gaming on EI during and after long sedentary sessions is unknown 13 .
Most intervention studies have primarily used short gaming sessions of five to 15 minutes 6 14 15 to test the effects of gaming, while the most prolonged gaming sessions were close to four hours of video game play 16 .
No prior studies have investigated the effects of long gaming sessions on the human heart, combining heart rate variability (HRV) and biochemical markers of cardiac injury. Studies of video games have predominantly used blood pressure (BP), heart rate (HR), and HRV as markers of physical activity and the impact of gaming on the heart and as surrogate markers of the emotional impact of gaming 2 13 17 18 . In addition, HRV has been used as a marker of physiological nervous system stress in the gaming literature 2 5 19 and is also used as a predictor of various cardiovascular and psychiatric diseases 20 .
Cardiac injury markers (troponin T (TnT), creatine kinase MB (CK-MB), and aspartate transaminase (AST)) have not yet been explored in the gaming literature.
Thus, our knowledge of the effect of the behavior undertaken by millions of children, adolescents, and adults is limited 2 .
Methods
The study protocol was approved by The North Denmark Region Committee on Health Research Ethics. The participants gave their written informed consent in the weeks before the study. On the day of the study, each of the participants reaffirmed their consent in writing.
Much input was received during the study protocol design from colleagues, people in the gaming community, and the participants.
Protocol
The original idea of this pilot study was to let participants play video games for as long as they could, let them sleep, and then conduct another gaming session until exhaustion while measuring their physiological and biochemical responses.
On the day of the trial, the participants reported to the test site no later than 4 PM for baseline measurements. Hard physical labor, alcohol, and fast food can affect various biochemical parameters 21 22 23 . Therefore, the participants were instructed to abstain from hard physical labor, heavy resistance training, strenuous cardiovascular exercise, and alcohol consumption and to limit the consumption of sweets and fast food for seven days before the trial.
Participants were instructed to abstain from food intake from noon on the day of the study and limit the intake of beverages to water. At baseline, the participants completed biochemical and physiological sampling, including anthropometric measurements, weighing, BP, blood sampling, urine and saliva sampling, and installation of Holter ECG monitors. In addition, the participants completed a questionnaire detailing gaming habits, education, employment, medicine, over-the-counter supplements, tobacco history, and alcohol use.
The first 18-hour session started Friday at 6 PM and ran until Saturday at noon. The second session started at 6 PM Saturday and concluded at noon Sunday. During the 36 hours of gaming, participants had unlimited access to a snack and beverage bar and were served dinner on Friday and Saturday nights. The design simulated an ordinary local area network (LAN) party.
The participants had blood sampled every six hours.
Participants
An announcement of the study with a call for participants was posted on several Danish gaming-related message boards, through word-of-mouth with the local E-sports instructors, and a national gaming organization.
As this was a pilot study, a sample size estimation was not possible. Per protocol, the goal was to recruit six participants and have two additional "backup” participants. During the recruitment process, participants signed up and withdrew from the study in groups. A total of four groups were recruited, but two groups withdrew from the study after a single member of each group withdrew owing to personal reasons. This complicated the enrollment process. Finally, two groups were successfully recruited with a total of nine participants, all completing the trial.
Inclusion criteria were healthy, male adults over 18 years old. Exclusion criteria were baseline hemoglobin below the reference interval (8.3 mmol/L), BP>150/95 mmHg, hemoglobin A1c (IFCC)>44 mmol/mol, or known chronic disease.
Food, snacks, and beverages (food diaries)
Before the start, the participants were familiarized with the food diary. The participants kept their food diary, weighing and noting all intake of food and drink from the snack bar immediately after acquiring it. Food diaries were kept in six-hour intervals concurring with blood sampling. Each of the food diaries was indexed with the participants’ names, color codes, and correct time intervals. They were located so that the participants could not leave the snack bar without passing their food diaries.
A warm meal was served twice during periods one and five, respectively ( Table 1 ). Consumption of alcohol and recreational drugs was not allowed during the trial. Calorie and caffeine contents of ingested food and drinks were calculated using manufacturer-provided information when possible and USDA FoodData Central estimations 24 when manufacturer information was not available (e. g., pizza, burgers, and coffee).
Table 1 Anthropometrics, gaming behavior, and food diary during the study for each gamer.
| Gamer | Age | Height (cm) | Weight (kg) | BMI | WC (cm) | DGH (hrs/d) | Total Energy (Kcal) | Total Liquid (kcal) | Total Liquid (ml) | Total Food (kcal) | Total Food (g) | Total Caffeine (mg) |
|---|---|---|---|---|---|---|---|---|---|---|---|---|
| Gamer 1 | 24.5 | 180.5 | 66.5 | 20.4 | 77 | 1.3 | 7534.4 | 1163.9 | 4830 | 6370.5 | 1937 | 1499.5 |
| Gamer 2 | 26.2 | 185 | 84 | 24.5 | 91 | 1.9 | 7668.0 | 778.5 | 8640 | 6889.4 | 2250 | 1038.0 |
| Gamer 3 | 29.5 | 189 | 73.7 | 20.6 | 82 | 3.9 | 9969.4 | 1795.5 | 4980 | 8173.9 | 2857 | 1375.1 |
| Gamer 4 | 29.3 | 174.5 | 81.1 | 26.6 | 88 | 0.9 | 7485.5 | 2727.0 | 9214 | 4758.5 | 2072 | 1625.5 |
| Gamer 5 | 28.3 | 185 | 95.3 | 27.8 | 102 | 5.0 | 6089.1 | 714.2 | 4350 | 5375.0 | 1634 | 669.0 |
| Gamer 6 | 23.5 | 186 | 85.6 | 24.7 | 89 | 3.4 | 10141.2 | 4190.5 | 10820 | 5950.7 | 2849 | 1679.0 |
| Gamer 7 | 23.9 | 180 | 94.1 | 29.0 | 99 | 4.6 | 8491.2 | 2026.3 | 6840 | 6464.9 | 2356 | 1477.0 |
| Gamer 8 | 23.7 | 178.5 | 77.6 | 24.4 | 89 | 5.0 | 7353.2 | 1985.0 | 4180 | 5368.2 | 2055 | 1300.0 |
| Gamer 9 | 23.3 | 186.5 | 87.5 | 25.2 | 82.5 | 4.6 | 7311.9 | 1217.8 | 5770 | 6094.1 | 2424 | 1526.9 |
| Median | 24.5 | 185 | 84 | 24.7 | 89 | 3,9 | 7534.4 | 1795.5 | 5770 | 6094.1 | 2250 | 1477.0 |
| Mean | 25.8 (±2.6) a | 182.8 (±4.6) a | 82.8 (±9.3) a | 24.8 (±2.9) a | 88.8 (±8.0) a | 3.4 (±1.6) a | 8004.9 (±438.4) b | 1844.3 (±365.3) b | 6624.9 (±801.2) b | 6160.6 (±332.9) b | 2270.4 (±135.0) b | 1354.4 (±106.6) b |
BMI, body mass index; WC, waist circumference; DGH, daily gaming hours.; a Standard deviation; b Standard error.
Blood pressure and heart rate variability
BP was measured in triplicate after a few minutes of rest every three hours using a digital sphygmomanometer (OMRON M6; Mediq Danmark, Brøndby, Denmark) with one minute between every measurement
HRV data was collected using a Holter monitor (Lifecard CF; Del Mar Reynolds Medical, Hertfort, UK). The monitor was attached and tested before baseline blood samples were collected.
The raw data analysis was conducted using the Pathfinder Digital 700 (Del Mar Reynolds Medical) and HRV tools (Del Mar Reynolds Medical).
The 42-hour recording of the study was broken into six-hour intervals that matched the blood sampling schedule and the gaming/rest schedule. Six parameters were included for the study of HRV: high-frequency bands (HF), low-frequency bands (LF), the ratio of LF-to-HF power (LF/HF), average inter-beat interval (mean RR), the root mean square of successive inter-beat interval differences (RMSSD), and the standard deviation of inter-beat intervals from which artifacts have been removed (SDNN) 25 .
Gaming
Participants decided what games to play at their discretion. During the 36 hours of gaming, the participants played more than ten different game titles. The games were played alone, cooperatively in groups of two to five players, and now and then, all nine participants played together.
Statistical analysis
The difference in intake of food amount (g), food energy (kcal), liquid amount (ml), liquid energy (kcal), and caffeine amount (mg) was analyzed between the two 18-hour sessions using Student’s paired t-test. Normal distribution was tested by the Shapiro–Wilk test of normality. All the data had a normal distribution. However, since the number of observations was low, a Wilcoxon signed-rank test was also performed. This made no difference from the results compared with the paired t-test, and the results are not shown.
Pearson's R correlation analysis was used to investigate correlations between participants’ BMI, waist circumference, and habitual gaming hours as independent variables, with the intake of food and drink (both amount and calories) and caffeine intake. All calculations for correlation analysis were conducted manually in Microsoft Excel 2013 (Microsoft Corp., Redwood, Washington, USA).
Average systolic blood pressure (SBP) and diastolic blood pressure (DBP) (±SE) for each triplicate measurement were calculated using Microsoft Excel. Mean arterial pressure (MAP) was estimated using the formula MAP=(SBP+2DPB)/3. There were six missing data points in the BP data. These data points were adjusted using the last observation carried forward (LOCF) technique.
The statistical analyses of HRV and cardiac injury marker data were conducted in R (R Core Team), using a linear mixed-effects model (lme4 package) 26 . The absolute changes of the HRV and biochemical parameters were investigated using this method. A separate univariate analysis for each change in each parameter was conducted. Time was set as the fixed effect, and participants were the random effect. A subsequent model was introduced, which included an interaction term between time and session.
The analyses and visualizations were conducted in R. Results are presented as mean (±SE) unless otherwise stated.
Results
Anthropometrics, gaming behavior, and food diaries
Four of nine participants had a BMI above 25, whereas the rest had normal BMIs. Table 1 gives an overview of relevant anthropometric measurements, gaming behavior, food, liquid, and caffeine intake. The average total calorie intake from food and liquid was 8004.9 kcal (±438.4 kcal). Table 2 shows ingestion of food and drinks per 6-hour period. Period 4 was the rest period. No food or drinks were ingested during this time. Researchers found that participants had taken items from the snack bar without noting them correctly in their food diary twice. This was corrected immediately during the study.
Table 2 Overview of the mean intake of food, drink, and caffeine.
| Interval 1 6 PM – Midnight | Interval 2 Midnight – 6 AM | Interval 3 6 AM – Noon | Interval 4 Noon – 6 PM | Interval 5 6 PM – Midnight | Interval 6 Midnight – 6 AM | Interval 7 6 AM – Noon | |
|---|---|---|---|---|---|---|---|
| Liquid (kcal) | 615.0 (±88.9) | 281.3 (±88.0) | 171.8 (±49.9) | 0.0 | 437.5 (±146.4) | 248.4 (±41.4) | 90.2 (±38.2) |
| Liquid (ml) | 1631.1 (±203.6) | 910.0 (±174.8) | 770.0 (145.2) | 0.0 | 1483.8 (±291.4) | 1191.1 (±237.8) | 638.9 (±158.9) |
| Food (kcal) | 1828.2 (±300.0) | 1016.0 (±310.0) | 675.5 (±96.0) | 0.0 | 2176.9 (±193.8) | 343.4 (±154.5) | 120.6 (±63.9) |
| Food (g) | 689.1 (±101.7) | 305.4 (±107.6) | 275.1 (±43.0) | 0.0 | 736.3 (±78.5) | 150.9 (±61.6) | 113.6 (±56.8) |
| Caffeine (mg) | 427.8 (±45.6) | 149.6 (±13.6) | 146.4 (±25.8) | 0.0 | 328.5 (±56.9) | 202.4 (±22.5) | 99.8 (±23.2) |
Overview of the mean intake of food, drink, and caffeine by 6-hour time interval. Interval 1–3 constitutes the first 18-hour gaming session, Interval 4 was the rest interval, and Interval 5–7 constitutes the second 18-hour gaming session. All data are presented as mean (±SE).
Food, drink, and caffeine intake
Participants had the highest intake of food, liquid, and caffeine in intervals 1 and 5, right at the start of the two sessions ( Table 2 ) ( Fig.1 ). The total number of calories ingested (from food and liquid) was higher in the first 18-hour period than in the second 18-hour period (p=0.01) ( Fig. 2a ), with the difference in means of 1170.8 kcal. Concordantly, the intake of calories from liquid (kcal) was lower in the second period (p=0.003) with the difference in means of 292.0 kcal ( Fig. 2b ). There was no significant difference between the amount of liquid consumed (ml) between the two periods (p=0.99), and the difference in means was –2.67 ml ( Fig. 2c ). The intake of calories from food decreased significantly in the second period (p=0.03) with a difference in means of 878.8 kcal ( Fig. 2d ). The weight of food eaten fell significantly (p=0.04), with a difference in means of 268.9 g ( Fig. 2e ). There was no significant difference between caffeine intake in the first period compared with the second period (p=0.16), the difference in means was 93.2 mg ( Fig. 2f ).
Fig 1.
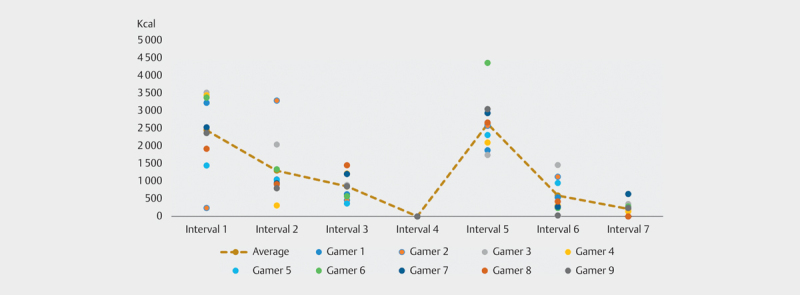
Intake of total calories for each participant.; Intake of total calories (from both food and liquid) for each participant during each six-hour interval. Meals were served during Interval 1 and 5. Gamer 2 arrived late and thus ate his first full meal during Interval 2.
Fig 2.
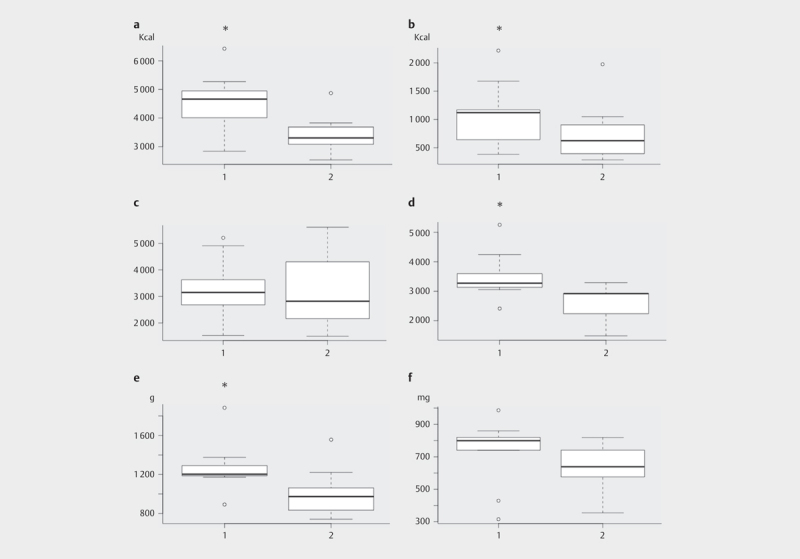
Comparison of intake during gaming sessions.; Boxplot comparison of the first 18-hour gaming period versus the second 18-hour gaming period.; a : The total calorie (Kcal) intake.; b : Intake of liquid calories (Kcal).; c : Intake of liquid amount (mL).; d : Intake of food calories (Kcal).; e : Intake of food amount (g).; f : Intake of caffeine (mg).; * denotes significant difference in a paired Student’s t-test (p<0.05).
Food calorie intake in the first gaming period was negatively correlated to BMI and waist circumference (R=–0.84, p=0.005; R=–0.70, p=0.036, respectively). There were no other statistically significant correlations.
Cardiac data
SBP, DBP, and MAP are presented in Fig. 3 . All BP measurements were normal and did not change during the gaming session. Additionally, no statistically significant changes in CK–MB and TnT were observed. However, AST decreased significantly from a baseline of 28.2 U/L. During the first gaming session, AST decreased by 0.6 (±0.44) U/L per six hours. During the second gaming session, AST decreased by 1.2 (±0.44) U/L per six hours (p=0.02).
Fig 3.
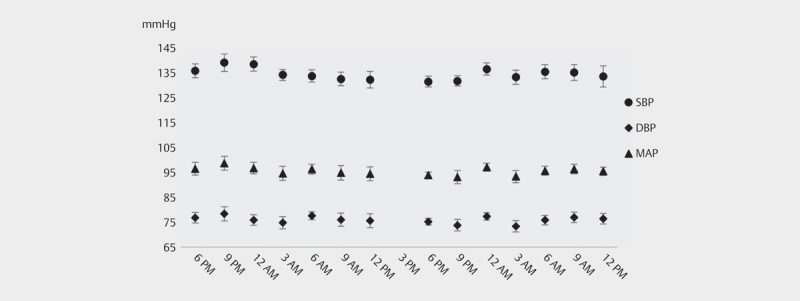
Blood pressure during the 42 hours of the study.; Blood pressure was not measured at 3 PM as the participants were resting. SBP, systolic blood pressure; DBP, diastolic blood pressure; MAP, mean arterial pressure.
The linear mixed-effects model of the HRV data showed that RMSSD declined significantly over time, –1.54 (±0.7) from a baseline of 39.9. HF, LF, LF/HF interval, mean RR, and SDNN showed no significant changes. When an interaction term between time and session was introduced, there were no significant changes in the six parameters.
Discussion
This study is the first of its kind and included a setup that encouraged realistic gaming behavior. In addition, the EI data is unique because it was accumulated over a long period of time.
Design and setting
Gaming is a social behavior 27 , and this aspect of gaming should not be disregarded when studies are designed. One participant remarked concerning the gaming room that while it was not designed for gaming, it was more comfortable than most setups at public and private LAN parties. The setup allowed participants to behave in a manner that was congruent with their habitual gaming behavior. While the study did take place at a hospital, it gives a realistic insight into LAN-party and gaming behavior. This study is the first of its kind, using long gaming sessions in a realistic LAN-party setup (Picture 1).
Gaming
The participants enrolled in this study were experienced gamers and reported playing between one to five hours of video games per day. The participants were not in the habit of undertaking back-to-back 18-hour gaming sessions, but all the participants had prior LAN-party experience.
The participants played many different games throughout the study. It was previously argued that gaming most likely affects the players according to how the game was played, the requirements of the game, and the stakes of the game 2 . In this study, the participants switched between games and changed the stakes, at their own volition or in collaboration with other participants. As such, this study gives an insight into gaming behavior in general and not specific games or game genres in particular. Studies that investigate e-sports in particular (competitive Counter-Strike: Global Offensive, League of Legends, Fortnite, Dota 2, or similar titles) are scarce in the literature 28 .
Food and liquid intake
Previous studies have estimated EI after shorter gaming sessions 5 . This is the first study to collect the data during long gaming sessions. During the study, the participants ingested vastly more calories than what was required in sedentary behavior. The energy required to complete 48 hours of sedentary activity for males in this age group is approximately 4800 kcal 29 . The participants ingested 8004.9 (±438.4) kcal on average (from food and liquid) during the 42 hours of the study. This excessive intake may be necessary to achieve high and consistent performance throughout the long gaming sessions, but this would not explain why the intake of calories fell during the second period. Consequently, overeating may be part of this lifestyle with an excessive supply of snacks. Overall, the number of calories ingested through fluids does not comply with a healthy lifestyle 29 . The data in the food diaries suggest that participants switched from sugary soft drinks to water and coffee (data not shown). At present, we have no explanation for this switch in beverage choice.
The calorie intake from food was significantly lower in the second 18-hour session despite an identical availability of food and drinks. Both sessions included a warm evening meal, and participants had unlimited access to the snack bar. It is possible that the novelty of the snack bar wore off throughout the study or that the participants simply overate during the first hours of the study. Another reason for the decrease in food intake could be exhaustion, though exhaustion has also been correlated with overeating 30 .
It was found that higher BMI and bigger waist circumference surprisingly had a strong negative correlation with calorie intake from food in the first 18-hour period. This is not in line with the literature, suggesting that overweight gamers have a larger energy surplus during gaming than normal weight gamers 9 . These correlations may result from a "white coat syndrome” phenomenon, e. g., “unhealthy” participants were aware of their health status and thus consciously limited their EI compared to their habitual gaming behavior. Furthermore, the decrease in calorie intake in the groups during the second 18-hour session was smaller among participants with a BMI>25 than participants with a BMI<25 (data not shown). Previous gaming studies have investigated the effect of weight on hunger after gaming 31 32 . However, this study is, to our knowledge, the first to report a negative correlation between BMI and EI, as well as waist circumference and EI.
Caffeine
The participants had a caffeine intake that equaled approximately double the advised daily maximal intake 29 . Caffeine intake came from liquid, and though liquid calorie intake decreased significantly in the second 18-hour period, a similar decrease in caffeine intake was not registered. The participants changed their sugary soft drinks to coffee as the gaming sessions wore on. Caffeine supplementation is very popular among gamers and e-sports athletes as a performance enhancer, but the positive effect of caffeine on gaming performance has not yet been proven 28 .
Cardiac data
The results of our study indicate that gaming per se does not induce unhealthy cardiovascular stress in healthy male adults in the short term.
BP remained steady throughout the study. While this underscores that the physical demand for gaming is limited, it is surprising that there was no dip in BP during the rest period. A dip would be expected during the night but is absent. HR and BP non-dipping during nighttime predict cardiovascular disease 33 34 .
Our results show no clinical difference in HRV during the study, even comparing gaming periods to rest. This lack of variability could indicate cardiovascular stress, and it is reasonable to assume that long, successive gaming sessions that disrupt the circadian rhythm could be detrimental to long-term health 35 36 .
CK–MB and TnT were unaffected. AST decreased significantly throughout the study, however, this is not presumed to be clinically relevant. These results suggest that the overall stress on the body and the heart was limited. Gaming, in general, has been linked to inactivity, obesity, and other cardiovascular risk factors. Gaming does not cause biochemical changes related to cardiac damage, even during extremely long gaming sessions. Gaming can, however, potentially induce health-adverse effects as a part of sedentary behavior.
Conclusion
Based on this study, long-term adverse effects of gaming cannot be ruled out, and further studies are needed.
The non-dip of HR and BP suggests that long gaming sessions could be detrimental to cardiovascular health over the long term. This could be exacerbated by excessive eating patterns. Long gaming sessions may pose a health risk for those who often engage in this behavior.
Acknowledgements
We thank the participants for their huge effort which made the study possible. We also thank the laboratory technicians for their detailed planning, testing, and execution of the laboratory protocols.
Footnotes
Conflict of Interest The authors declare that they have no conflict of interest.
References
- 1.DiFrancisco-Donoghue J, Balentine J, Schmidt G et al. Managing the health of the eSport athlete: an integrated health management model. BMJ Open Sport Exerc Med. 2019;5:e000467. doi: 10.1136/bmjsem-2018-000467. [DOI] [PMC free article] [PubMed] [Google Scholar]
- 2.Krarup K B, Krarup H B. The physiological and biochemical effects of gaming: A review. Environ Res. 2020;184:109344. doi: 10.1016/j.envres.2020.109344. [DOI] [PubMed] [Google Scholar]
- 3.Lenhart A, Kahne J, Middaugh E . Washington, DC: Pew Internet & American Life Project; 2008. Teens, video games, and civics. [Google Scholar]
- 4.Strasburger V C, Jordan A B, Donnerstein E.Children, adolescents, and the media: health effects Pediatr Clin North Am 201259533–587.vii 10.1016/j.pcl.2012.03.025 [DOI] [PubMed] [Google Scholar]
- 5.Chaput J P, Visby T, Nyby S et al. Video game playing increases food intake in adolescents: a randomized crossover study. Am J Clin Nutr. 2011;93:1196–1203. doi: 10.3945/ajcn.110.008680. [DOI] [PubMed] [Google Scholar]
- 6.Mellecker R R, McManus A M. Energy expenditure and cardiovascular responses to seated and active gaming in children. Arch Pediatr Adolesc Med. 2008;162:886–891. doi: 10.1001/archpedi.162.9.886. [DOI] [PubMed] [Google Scholar]
- 7.Allsop S, Green B P, Dodd-Reynolds C J et al. Comparison of short-term energy intake and appetite responses to active and seated video gaming, in 8-11-year-old boys. Br J Nutr. 2016;115:1117–1125. doi: 10.1017/S0007114515005437. [DOI] [PubMed] [Google Scholar]
- 8.Dutta N, Pereira M A. Effects of active video games on energy expenditure in adults: a systematic literature review. J Phys Act Health. 2015;12:890–899. doi: 10.1123/jpah.2013-0168. [DOI] [PubMed] [Google Scholar]
- 9.Siervo M, Hannah C, Jonathan W C et al. Frequent video-game playing in young males is associated with central adiposity and high-sugar, low-fibre dietary consumption. EWD. 2014;19:515–520. doi: 10.1007/s40519-014-0128-1. [DOI] [PubMed] [Google Scholar]
- 10.Straker L, Abbott R. Effect of screen-based media on energy expenditure and heart rate in 9- to 12-year-old children. Pediatr Exerc Sci. 2007;19:459–471. doi: 10.1123/pes.19.4.459. [DOI] [PubMed] [Google Scholar]
- 11.Turel O, Romashkin A, Morrison K M. A model linking video gaming, sleep quality, sweet drinks consumption and obesity among children and youth. Clin Obes. 2017;7:191–198. doi: 10.1111/cob.12191. [DOI] [PubMed] [Google Scholar]
- 12.Pentz M A, Spruijt-Metz D, Chou C P et al. High calorie, low nutrient food/beverage intake and video gaming in children as potential signals for addictive behavior. Int J Environ Res Public Health. 2011;8:4406–4424. doi: 10.3390/ijerph8124406. [DOI] [PMC free article] [PubMed] [Google Scholar]
- 13.Ballard M E, Hamby R H, Panee C D et al. Repeated exposure to video game play results in decreased blood pressure responding. Media Psychol. 2006;8:323–341. doi: 10.1207/s1532785xmep0804_1. [DOI] [Google Scholar]
- 14.Wang X, Perry A C. Metabolic and physiologic responses to video game play in 7- to 10-year-old boys. Arch Pediatr Adolesc Med. 2006;160:411–415. doi: 10.1001/archpedi.160.4.411. [DOI] [PubMed] [Google Scholar]
- 15.Maddison R, Mhurchu C N, Jull A et al. Energy expended playing video console games: an opportunity to increase children's physical activity? Pediatr Exerc Sci. 2007;19:334–343. doi: 10.1123/pes.19.3.334. [DOI] [PubMed] [Google Scholar]
- 16.Lin T C. Effects of gender and game type on autonomic nervous system physiological parameters in long-hour online game players. Cyberpsychol Behav Soc Netw. 2013;16:820–827. doi: 10.1089/cyber.2012.0230. [DOI] [PubMed] [Google Scholar]
- 17.Siervo M, Gan J, Fewtrell M S et al. Acute effects of video-game playing versus television viewing on stress markers and food intake in overweight and obese young men: a randomised controlled trial. Appetite. 2018;120:100–108. doi: 10.1016/j.appet.2017.08.018. [DOI] [PubMed] [Google Scholar]
- 18.Segal K R, Dietz W H. Physiologic responses to playing a video game. Am J Dis Child. 1960;1991:1034–1036. doi: 10.1001/archpedi.1991.02160090086030. [DOI] [PubMed] [Google Scholar]
- 19.Ivarsson M, Anderson M, Akerstedt T et al. The effect of violent and nonviolent video games on heart rate variability, sleep, and emotions in adolescents with different violent gaming habits. Psychosom Med. 2013;75:390–396. doi: 10.1097/PSY.0b013e3182906a4c. [DOI] [PubMed] [Google Scholar]
- 20.Quintana D S, Heathers J A. Considerations in the assessment of heart rate variability in biobehavioral research. Front Psychol. 2014;5:805. doi: 10.3389/fpsyg.2014.00805. [DOI] [PMC free article] [PubMed] [Google Scholar]
- 21.Kechagias S, Ernersson A, Dahlqvist O et al. Fast-food-based hyper-alimentation can induce rapid and profound elevation of serum alanine aminotransferase in healthy subjects. Gut. 2008;57:649–654. doi: 10.1136/gut.2007.131797. [DOI] [PMC free article] [PubMed] [Google Scholar]
- 22.Teschke R, Eickhoff A, Brown A C et al. Diagnostic biomarkers in liver injury by drugs, herbs, and alcohol: tricky dilemma after EMA correctly and officially retracted letter of support. Int J Mol Sci. 2019;21 doi: 10.3390/ijms21010212. [DOI] [PMC free article] [PubMed] [Google Scholar]
- 23.Cerqueira E, Marinho D A, Neiva H P et al. Inflammatory effects of high and moderate intensity exercise – a systematic review. Front Physiol. 2019;10:1550. doi: 10.3389/fphys.2019.01550. [DOI] [PMC free article] [PubMed] [Google Scholar]
- 24.USDA . Department of Agriculture; 2019. USDA FoodData Central. In: USDA ed U. S. [Google Scholar]
- 25.Shaffer F, Ginsberg J P. An Overview of heart rate variability metrics and norms. Front Public Health. 2017;5:258–258. doi: 10.3389/fpubh.2017.00258. [DOI] [PMC free article] [PubMed] [Google Scholar]
- 26.Bates D, Mächler M, Bolker B et al. Fitting linear mixed-effects models using lme4. J Stat Softw. 2015;67 doi: 10.18637/jss.v067.i01. [DOI] [Google Scholar]
- 27.Lenhart A, Smith A, Anderson M Teens, technology & friendships. Pew Research Center. 2015.
- 28.Thomas C J, Rothschild J, Earnest C P et al. The effects of energy drink consumption on cognitive and physical performance in elite league of legends players. Sports (Basel, Switzerland) 2019;7 doi: 10.3390/sports7090196. [DOI] [PMC free article] [PubMed] [Google Scholar]
- 29.Millen B, Lichtenstein A H, Abrams S et al. Dietary guidelines for Americans 2015–2020 8th edition. Adv Nutr. 2016:438–444. doi: 10.3945/an.116.012120. [DOI] [PMC free article] [PubMed] [Google Scholar]
- 30.Padilla H M, Wilson M, Vandenberg R J et al. Health behavior among working adults: workload and exhaustion are associated with nutrition and physical activity behaviors that lead to weight gain. J Health Psychol. 2021;26:892–904. doi: 10.1177/1359105319851205. [DOI] [PubMed] [Google Scholar]
- 31.Gheller BJ F, Totosy de Zepetnek J O, Welch J M et al. Effect of video game playing and a glucose preload on subjective appetite, subjective emotions, and food intake in overweight and obese boys. Appl Physiol Nutr Metab. 2019;44:248–254. doi: 10.1139/apnm-2018-0281. [DOI] [PubMed] [Google Scholar]
- 32.Branton A, Akhavan T, Gladanac B et al. Pre-meal video game playing and a glucose preload suppress food intake in normal weight boys. Appetite. 2014;83:256–262. doi: 10.1016/j.appet.2014.08.024. [DOI] [PubMed] [Google Scholar]
- 33.Cuspidi C, Facchetti R, Bombelli M et al. Night-time heart rate nondipping: clinical and prognostic significance in the general population. J Hypertens. 2018;36:1311–1317. doi: 10.1097/hjh.0000000000001703. [DOI] [PubMed] [Google Scholar]
- 34.Cuspidi C, Facchetti R, Bombelli M et al. Nighttime blood pressure and new-onset left ventricular hypertrophy: findings from the Pamela population. Hypertension. 2013;62:78–84. doi: 10.1161/hypertensionaha.111.00682. [DOI] [PubMed] [Google Scholar]
- 35.Trivedi G, Saboo B, Singh R et al. Can decreased heart rate variability be a marker of autonomic dysfunction, metabolic syndrome and diabetes? J Diabetol. 2019;10:48–56. doi: 10.4103/jod.jod_17_18. [DOI] [Google Scholar]
- 36.Brosschot J F, Van Dijk E, Thayer J F. Daily worry is related to low heart rate variability during waking and the subsequent nocturnal sleep period. Int J Psychophysiol. 2007;63:39–47. doi: 10.1016/j.ijpsycho.2006.07.016. [DOI] [PubMed] [Google Scholar]