

Graphical abstract
Keywords: Prostate adenocarcinoma (PRAD), Weighted gene co-expression analysis (WGCNA), ceRNA network, Cross-talk, Prognostic biomarker
Highlights
-
•
Deregulated hub genes were obtained via a comprehensive analysis.
-
•
A survival model containing 8 hub genes was constructed with AUC 0.972 at 10 years, indicating that it was a specific biomarker for cancer prognosis.
-
•
Further analysis validated that TK1:miR-222-3p:SNHG3 axis may be a potential prognostic biomarker.
Abstract
As one of common malignancies, prostate adenocarcinoma (PRAD) has been a growing health problem and a leading cause of cancer-related death. To obtain expression and functional relevant RNAs, we firstly screened candidate hub mRNAs and characterized their associations with cancer. Eight deregulated genes were identified and used to build a risk model (AUC was 0.972 at 10 years) that may be a specific biomarker for cancer prognosis. Then, relevant miRNAs and lncRNAs were screened, and the constructed primarily interaction networks showed the potential cross-talks among diverse RNAs. IsomiR landscapes were surveyed to understand the detailed isomiRs in relevant homologous miRNA loci, which largely enriched RNA interaction network due to diversities of sequence and expression. We finally characterized TK1, miR-222-3p and SNHG3 as crucial RNAs, and the abnormal expression patterns of them were correlated with poor survival outcomes. TK1 was found synthetic lethal interactions with other genes, implicating potential therapeutic target in precision medicine. LncRNA SNHG3 can sponge miR-222-3p to perturb RNA regulatory network and TK1 expression. These results demonstrate that TK1:miR-222-3p:SNHG3 axis may be a potential prognostic biomarker, which will contribute to further understanding cancer pathophysiology and providing potential therapeutic targets in precision medicine.
1. Introduction
Prostate adenocarcinoma (PRAD) is one of common malignancies among men, and it has been a growing health problem globally and a leading cause of cancer-related death [1]. It is growing rapidly throughout the world, especially in the United States [2], [3], and the risk of progression maybe vary significantly. Many patients can be cured using standard treatments, mainly including radical prostatectomy (RP) or primary definitive radiotherapy (RT)[4], [5] that is an available treatment. However, it is still need further understanding of prevention, early diagnosis, treatment or prognosis determination [6], which is quite crucial to cure this disease and improve low survival rate [7]. Exploring the detailed molecular mechanisms is very important particularly the potential interactions between diverse molecules.
Many studies have validated some genes and related pathways contribute to PRAD, and some crucial genes may be potential biomarkers for diagnosis and treatment [8], especially for non-coding RNAs (ncRNAs). As a class of potential important regulators, mainly including microRNA (miRNA), long-non-coding RNA (lncRNA) and circular RNAs (circRNA), has been widely concerned due to the key roles with mRNAs in ncRNA regulatory network. For example, EWI-2 controls nucleocytoplasmic shuttling of EGFR signaling molecules and miRNA sorting in exosomes to inhibit prostate cancer cell metastasis [9], SChLAP1 can promote prostate cancer development through interacting with EZH2 to mediate promoter methylation modification of multiple miRNAs [10], circulating miRNA pairs could potentially bring more benefits to early diagnosis for clinical practice [11], upregulation of miR-3195, miR-3687 and miR-4417 is associated with castration-resistant prostate cancer [12], and NF-kB2/p52 induces resistance to enzalutamide [13]. These relevant studies have shown the crucial roles of RNAs in tumorigenesis, and these genes may be potential biomarkers for cancer diagnosis. Further studies should be focus on the interactions of these genes, especially interactions among ncRNAs and mRNAs that may be a crucial method to explore the detailed molecular mechanism via a systematic method.
Recently, competing endogenous RNAs (ceRNAs) network based on the potential interactions among different RNAs, has been widely studied due to correlation with the initiation and development of diverse cancers. For example, lncRNA OGFRP1 can be as a ceRNA to promote the progression of prostate cancer by regulating SARM1 level via miR-124-3p [14], circABCC4 as a ceRNA of miR-1182 facilitates prostate cancer progression by promoting FOXP4 expression [15], SP1-mediated upregulation of lncRNA SNHG4 functions as a ceRNA for miR-377 can facilitate prostate cancer progression through regulation of ZIC5 [16], TUG1 promotes prostate cancer progression by acting as a ceRNA of miR-26a [17], and lncRNA UCA1 functions as a ceRNA can promote prostate cancer progression via sponging miR-143 [18]. These studies indicate that these interactions may have important roles in cancer pathology, which largely contributes to surveying a series of RNAs associated with PRAD. Whether relevant mRNAs have an important role in cancer, whether cross-talks among diverse RNAs contribute to cancer pathology, and particularly whether the multiple isomiRs from miRNA locus also perturb coding-non-coding RNA interaction network, are quite interesting issues. It is necessary to further query for the potential roles of diverse RNAs in cancer, especially for epigenetic change of these genes.
In this study, we aim to survey potential prognostic and therapeutic targets via ncRNA-mediated RNA cross-talk using weighted gene co-expression analysis (WGCNA), and then perform in-depth analysis to further understand the role of cancer-associated RNAs. Firstly, deregulated mRNA profiles are analyzed via an integrative analysis of datasets, and candidate deregulated mRNAs are further validated via WGCNA analysis. The hub genes are obtained based on univariate and multivariate Cox proportional hazard regression analysis, and then a survival model is constructed to estimate its role as a potential prognostic biomarker. Secondly, based on the biological relationships, relevant ncRNAs, mainly including miRNAs and lncRNAs, are surveyed and analyzed to calculate their roles and prognostic values. Thirdly, interaction networks are constructed that are used to further survey and validate crucial RNAs associated cancer. Finally, for the screened crucial RNAs, in-depth analysis is performed to validate the potential biological roles in cancer pathology and prognostic values in cancer, especially for the potential roles of multiple isomiRs in miRNA locus. Our results will contribute to understanding of RNA cross-talks as well as their potential roles in cancer diagnosis and prognosis, which provides insight into finding the novel therapeutic or anti-cancer drug targets in precision medicine.
2. Results
2.1. Overview of deregulated mRNA expression profiles
To understand the deregulated mRNA expression profiles, expression analysis was performed based on integrated data sources. A total of 1,488 significantly abnormally expressed genes were detected (Figure S1A), including 737 up-regulated and 751 down-regulated genes. These genes showed potential biological functions, mainly including roles in some KEGG (Kyoto Encyclopedia of Genes and Genomes) pathways and GO (Gene Ontology) terms (Figure S1B and S1C). For example, these deregulated genes may contribute to cAMP signaling pathway and focal adhesion, and had a role in cell adhesion and cell junction. The top 100 deregulated genes could be used to classify the normal and tumor populations (Fig. 1A).
Fig. 1.

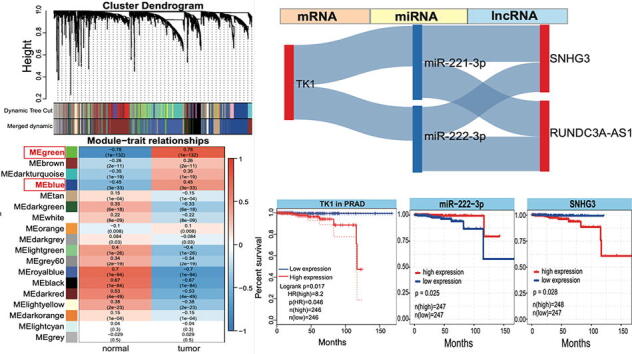
Integrative analysis of abnormally expressed genes and WGCNA analysis. A. Expression distributions of the top 100 up-regulated (n = 50) and down-regulated (n = 50) genes. B. The distributions of soft thresholding powers. The left picture indicates the distribution of R2 (scale free topology fitting index R2), and the right picture indicates the distribution of mean connectivity. C. WGCNA analysis indicates several gene modules. D. Correlations of genes associated with cancer and genes in green module. E. Functional enrichment analysis for screened genes. (For interpretation of the references to colour in this figure legend, the reader is referred to the web version of this article.)
2.2. Screening of crucial mRNA modules based on WGCNA analysis
In order to survey the potential crucial gene modules associated with cancer, WGCNA analysis was used to analyze relevant genes. According to normalized expression data, the top 40 % genes via variance comparison were used to screen potential gene modules because the selection of the top 40 % showed higher correlation of divided modules and cancer in further analysis than other selections of the top 80 %, 75 %, 60 % and 50 % genes. The value of soft thresholding power of 7 was selected in constructing network based on distribution of scale free topology fitting index R2 (scale-free R2 = 0.85) and the mean connectivity (Fig. 1B), and then a total of 18 gene modules were detected according to co-expression similarity with the height threshold >0.75 (Fig. 1C). Based on co-expression similarity and calculate adjacency, green (correlation = 0.78, p = 1.0e-132) and blue (correlation = 0.45, p = 3.0e-33) modules, containing 1,923 genes, were surveyed as candidate genes (Fig. 1C and 1D).
To further understand the potential biological function of these candidate genes, functional enrichment analysis was performed (Fig. 1E and Figure S1D). These genes had a role in multiple biological pathways, including protein binding, cytoplasm and metabolic pathways, indicating that they may contribute to tumorigenesis. Then, these candidate genes were further queried for their expression patterns, and 157 genes were found with abnormal expression, containing 118 up-regulated and 39 down-regulated genes (Table S1). Only 8 of them (5.10 %) were identified as core essential genes, indicating that most of deregulated genes were non-essential genes. Seven (4.46 %) were identified as human cancer genes, and 40 genes (25.48 %) were found with roles in multiple hallmarks of cancer, particularly insensitivity to antigrowth signals and self-sufficiency in growth signals. Further, we found that 58 genes (36.94 %) were detected as members in multiple KEGG pathways, especially in MAPK signaling pathway, arachidonic acid metabolism and pathways in cancer.
2.3. Prognosis values of candidate genes using Cox regression analysis
A total of 157 deregulated genes were selected as candidate crucial genes associated with cancer according to the above analysis. To understand the potential prognostic value, the correlation of gene expression level and the total survival rate were then estimated. Based on Wald test, 17 genes were primarily involved in further multivariate Cox proportional hazard model (Table 1). Eight crucial genes were selected, including significantly up-regulated 7 genes of TK1, PDIA5, NME2, TMEM132A, SLC12A8, DBNDD1 and PYCR1, and significantly down-regulated FAM107A (Fig. 2A). These genes showed relative consistent expression patterns in diverse cancers (Figure S2A), implying the similar functions and potential critical roles in tumorigenesis. No genes were identified as core essential genes, implying that dynamic expression patterns may largely contribute to cancer pathophysiology and developmental process. Further, negative correlations could be found between FAM107A and other candidate genes, while others usually showed positive significant expression correlations (Fig. 2B). The interesting correlations implied that these genes had potential associations in relevant biological pathways. NME2 had a role in hallmarks of cancer of evading apoptosis, tissue invasion and metastasis, and was a member in KEGG pathways of pyrimidine metabolism and purine metabolism. TK1 was a member in pathways of pyrimidine metabolism and drug metabolism other enzymes, and PYCR1 was a member in pathway of arginine and proline metabolism. These results showed that screened genes had a role in key biological pathways, and the abnormal expression patterns might directly or indirectly lead to perturbed interaction network.
Table 1.
Screened candidate genes associated with PRAD.
| Gene | Univariate |
Multivariate |
|||
|---|---|---|---|---|---|
| HR (95 % CI) | p | coef | HR | p | |
| PKMYT1 | 1.7976(1.3440–2.4044) | 0.0001 | |||
| TK1 | 1.0642(1.0307–1.0988) | 0.0001 | 0.0654 | 1.0676 | 0.0209 * |
| TMEM97 | 1.1631(1.0734–1.2603) | 0.0002 | |||
| MAP2K6 | 1.4568(1.1418–1.8585) | 0.0025 | |||
| PLAGL1 | 1.7457(1.1778–2.5875) | 0.0055 | |||
| PDIA5 | 1.0625(1.0176–1.1094) | 0.0060 | 0.0655 | 1.0677 | 0.0170 * |
| NME2 | 1.0574(1.0088–1.1084) | 0.0201 | 0.0494 | 1.0507 | 0.1244 |
| MAL2 | 1.0242(1.0028–1.0460) | 0.0266 | |||
| TMEM132A | 1.0721(1.0071–1.1412) | 0.0291 | −0.0208 | 0.9794 | 0.7144 |
| SLC12A8 | 1.3775(1.0190–1.8623) | 0.0373 | 0.3000 | 1.3499 | 0.1714 |
| DBNDD1 | 1.1464(1.0054–1.3072) | 0.0414 | 0.0529 | 1.0544 | 0.5537 |
| PYCR1 | 1.0253(1.0002–1.0510) | 0.0479 | −0.0239 | 0.9764 | 0.2923 |
| CRISPLD2 | 0.8980(0.8043–1.0025) | 0.0555 | |||
| EPCAM | 1.0080(0.9998–1.0162) | 0.0560 | |||
| FOXA1 | 1.0109(0.9997–1.0222) | 0.0562 | |||
| FAM107A | 0.7939(0.6214–1.0142) | 0.0647 | −0.0563 | 0.9452 | 0.6826 |
| C9orf152 | 1.0420(0.9926–1.0939) | 0.0969 | |||
Risk = 0.0654*TK1 + 0.0655*PDIA5 + 0.0494*NME2 + (-0.0208)*TMEM132A + 0.3000*SLC12A8 + 0.0529*DBNDD1 + (-0.0239)*PYCR1 + (-0.0563)*FAM107A.
Fig. 2.

In-depth analysis for screened 8 genes associated with cancer. A. Expression distributions for screened genes in tumor and normal samples. B. Paired gene correlations among the 8 genes based on their expression patterns. C. A heatmap shows expression patterns in high-risk group and low-risk group for the 8 genes based on multivariate COX proportional hazard model. All patients are divided into high-risk group and low-risk group, respectively. D. Distributions of risk scores and survival time of patient. A total of 10 dead patients are divided in high-risk group. E. Survival analysis and ROC curve of the 8 screened genes based on data in TCGA. F. Survival analysis and ROC curve of the 8 screened genes based on validation data from GEO (GSE116918).
According to estimated prognostic risk scores (Table 1), patients were divided into high-risk and low-risk groups (Fig. 2C and 2D), and the detailed expression patterns were obviously found between the two groups. Dead patients were in high-risk groups (Fig. 2D), implying potential association of high-risk and high expression. To further estimate prediction accuracy, survival analysis and the area under the receiver operating characteristic (ROC) curve analysis were performed. The probability of survival at 100 months of patients with low expression was significantly higher than that in patients with high expression, and the AUC was 0.972 at 10 years (0.854 at 9 years, and 0.850 at 8 years) (Fig. 2E). Further analysis using independent GEO data (GSE116918) also validated this result, and the AUC was 0.768 at 9 years (Fig. 2F), which further validated the effectiveness and high accuracy of the prognosis model. Compared with other relevant reported risk models [19], [20], [21], our risk score model had better effect and was robust (Figure S2B-S2D). Simultaneously, to avoid the potential influence of down-regulated gene (FAM107A), we also analyzed another 7 up-regulated genes, and similar results could be found (Figure S2E-S2F). The AUC was 0.995 at 9 years (the valuated AUC was 0.749 at 9 years), which indicated that the crucial genes could be a potential biomarker in cancer prognosis.
2.4. Screening related ncRNAs and construction of interaction networks
Based on the screened 8 key genes, related miRNAs were primarily collected according to their biological relationships. Deregulated miRNAs were surveyed as potential associated miRNAs, and then these miRNAs were used to screen related lncRNAs based on the potential interactions (Figure S3). Among the related miRNAs, homologous miRNAs were involved, such as miR-221-3p and miR-222-3p, miR-20a-5p and miR-20b-5p, indicating their similar function due to highly homologous functional regions. Related ncRNAs were further screened according to opposite expression patterns of miRNAs and mRNAs, and miRNAs and lncRNAs, respectively. Thus, 4 mRNAs were remained, including up-regulated DBNDD1, SLC12A8 and TK1, down-regulated FAM107A (Fig. 3A). Related 5 miRNAs and 9 lncRNAs were collected. These different RNAs had potential interactions, and further analysis was performed to validate the potential expression correlations among RNAs. Negative expression correlations of miRNA:mRNA and miRNA:lncRNA were used to identify cross-talk among key RNAs, and several RNAs, including TK1, 2 miRNAs and 2 lncRNAs (TK1:miR-221-3p/miR-222-3p:SNHG3/RUNDC3A-AS1), were obtained as potential interactions among ncRNAs and mRNAs (Fig. 3A). Among screened 5 RNAs, miR-221-3p and miR-222-3p were homologous miRNAs with sequence similarity, and they have been validated with potential prognostic roles in cancers [22]. They may promote osteogenic differentiation of bone marrow mesenchyme stem cells through IGF-1/ERK pathway under high glucose condition [23]. The two miRNAs were median molecules correlated with TK1 and lncRNAs, and lncRNAs further disturbed TK1 expression through interaction with miRNAs as a competing endogenous RNA.
Fig. 3.

Interaction networks among diverse RNAs. A. Interaction networks among screened mRNAs, related miRNAs and lncRNAs. B. The screened ceRNA network according to interactions of diverse RNAs. C. Survival analysis of TK1 in PRAD. D. Pan-cancer expression analysis of TK1 in different cancer types, and most of cancers are found with up-regulated TK1 expression patterns. The log2FC value is presented, and ** indicates p < 0.001, *** indicates p < 0.0001.
2.5. The potential prognostic values of screened RNAs
For the screened RNAs associated with cancer, patients with low expression of TK1 had higher probability of survival than that in patients with high expression (Fig. 3B and 3C), indicating that TK1 may have potential prognostic value in PRAD. The similar results were also detected based on all the cancer types, and this gene was always over-expressed in other cancers (Fig. 3D), mainly including BLCA, BRCA, CHOL, and other 8 cancer types (17 cancer types were involved, and it only showed down-regulated expression in KICH). These pan-cancer expression analysis showed that TK1 was prone to show over-expression in cancers, implying its role in the occurrence and development of cancer. Similar to TK1, another two involved ncRNAs, miR-222-3p and SNHG3, also showed significant prognostic values (Fig. 4A). Patients with high expression of miR-222-3p showed higher probability of survival than that in group with low expression (p = 0.025), while patients with low expression of SNHG3 had higher probability of survival (p = 0.028). Thus, the TK1:miR-222-3p:SNHG3 axis might be a potential biomarker in diagnosis and prognosis of PRAD, and interactions among them might provide more biological implication.
Fig. 4.

The potential prognostic values and expression distributions of screened RNAs. A. Survival analysis of miR-222-3p and SNHG3 also indicate the potential prognostic values in PRAD. B. The detailed expression patterns for homologous miRNA genes loci (miR-221-3p and miR-222-3p) based on the screened dominantly expressed 5 isomiRs. The circled isomiRs are the abundant isomiR species in the specific miRNA locus. The location on chromosome X: 184–203 indicates hg38:chrX:45746184–45746203:-, and 32–57 indicates hg38:chrX:45747032–45747057:-.C. IsomiR expression patterns in miR-222-3p locus across diverse cancer types. * indicates the significantly deregulated isomiRs (log2FC > 1.2 or < -1.2 and padj < 0.05). The expression distributions of multiple isomiRs in PRAD are circled. D. Pan-cancer analysis of SNHG3. The significantly up-regulated gene is presented the detailed log2FC value, and *** indicates p < 0.0001. E. The correlation analysis of paired RNAs (TK1 and miR-222-3p, miR-222-3p and SNHG3, and TK1 and SNHG3).
2.6. In-depth analysis of screened RNAs with potential cross-talks
In recent years, miRNAs have been concerned because of the multiple isomiRs in the miRNA locus [24], [25], [26], [27], [28], which may be an approach to reveal the miRNA world due to potential perturbing coding-non-coding RNA interaction network. Here, based on homologous miRNAs, isomiRs profiles were queried for the detailed expression. Five abundant isomiRs were detected in the two homologous miRNA loci, respectively (Fig. 4B), but they showed diverse expression patterns. A specific isomiR had the absolute expression level than other isomiRs in miR-221-3p (the median percentage was 45.60 %), while two isomiRs with dominant expression in miR-222-3p were found (the median percentages were 36.11 % and 30.12 %, respectively, Fig. 4B). The diverse expression patterns showed that isomiR expression profiles were not random, and they may be diverged even in homologous gene loci. Interestingly, all of these isomiRs were 3′ isomiRs with the same 5′ ends and seed sequences. They were only involved in divergence in 3′ ends that led to diverse length distributions, implicating the well-conserved 5′ ends and stable regulatory function.
For the screened miR-222-3p gene loci, the 5 abundant isomiRs were further queried for their expression patterns in diverse cancer types. Compared with TK1, isomiRs showed diverse expression patterns in cancers (Fig. 4C). Two isomiRs were significantly down-regulated in PRAD, and one isomiR was found with down-regulated expression in UCEC, while others did not show significant abnormal expression. However, the over-expression patterns were more popular in other cancer types (Fig. 4C), especially the 5 abundant isomiRs were found with up-regulation expression in 4 cancers (CHOL, LIHC, THCA and KICH), indicating the diverse roles of isomiRs in different cancer types and tissues. The dynamic expression patterns may contribute to flexible interaction with target mRNAs and lncRNAs.
Pan-cancer analysis of relevant lncRNA, SNHG3, was found up-regulation in several cancer types (Fig. 4D), and over-expression pattern showed that SNHG3 may competitively bind to miRNAs that may further lead to expression change of TK1. The significant positive expression correlation could be found between TK1 and SNHG3, and negative expression correlations were detected between miR-222-3p and TK1, and miR-222-3p and SNHG3, respectively (Fig. 4E), implying their interactions or cross-talks in regulatory network. The ceRNA network among the three RNAs further complicated regulatory process, which may be an important step in cancer pathology via the coding-non-coding RNA interaction network.
2.7. Potential biological roles of crucial RNAs
The screened axis, TK1:miR-222-3p:SNHG3, may be a biomarker for diagnosis and prognosis of PRAD, and it is necessary to understand their potential biological roles. The expression of TK1 had certain association with immune infiltration levels in immune cells (Fig. 5A), implying its role in immune process. As a well-known marker of abnormal cell proliferation, TK1 was not detected mutation sites, and it also had lower mutation frequency in other cancers (Fig. 5B). Both TK1 and SNHG3 were found with lower methylation levels in tumor samples than those in normal samples, which may beneficial to up-regulation expression patterns (Fig. 5C and 5D). Indeed, TK1 was also validated with higher enrichment level at protein level (Fig. 5E), indicating that over-expression of TK1 may have a role in the development process of cancer, especially in KEGG pathways of pyrimidine metabolism and drug metabolism other enzymes. Based on the potential value of synthetic lethality in cancer treatment, TK1 was also analyzed to survey the potential interactions with other genes. Further analysis showed that TK1 had potential synthetical lethal interaction with 6 genes according to published data [29], [30], [31], [32], [33] (Fig. 5F), and CDC20 and AURKB were significantly up-regulated as well as TK1. These potential synthetical lethal interactions provided a possibility of TK1 as potential drug target in precision cancer therapy.
Fig. 5.

In-depth analysis of screened RNAs. A. Correlations of TK1 expression and infiltration levels in different immune cells B. Mutation frequencies of TK1 in different cancer types. C. Significant negative correlations of expression and methylation in TK1 and SNHG3. D. Methylation distributions of TK1 between tumor and normal samples. E. The protein levels of TK1 based on Human Protein Altas. F. The synthetical lethal interactions of TK1 with other mRNAs and their expression patterns in PRAD. G. The subcellular localization of lncRNA SNHG3.
Moreover, as a competing endogenous RNA, lncRNA SNHG3 was mainly located in cytoplasm (Fig. 5G), which ensured that SNHG3 could bind to miR-222-3p and then lead to abnormal expression of TK1, a target of miR-222-3p. LncRNA SNHG3 has been widely studied as an important lncRNA that can interact with other RNAs in different cancers [34], [35], [36], [37], [38], [39] (Fig. 6A). For example, lncRNA SNHG3/miRNA-151a-3p/RAB22A axis regulates invasion and migration of osteosarcoma [34], SNHG3 overexpression can induce hepatocellular carcinoma cells EMT via miR-128/CD151 cascade activation [35], and SNHG3 can promote the growth and metastasis of colorectal cancer by regulating miR-539/RUNX2 axis [39]. These results validated that lncRNA SNHG3 had potential role in the occurrence and development of cancers via interactions with miRNAs. Similar to lncRNA SNHG3, miR-222-3p also indicated crucial roles in many cancers [40], [41], [42], [43], [44], [45] (Fig. 6B).
Fig. 6.

Potential biological roles of screened ncRNAs in diverse cancer types. A. The potential biological roles of SNHG3 in several cancer types [34], [35], [36], [37], [38], [39]. Yellow circle shows lncRNA, purple circle shows miRNA, and blue circle shows mRNA. B. The potential biological roles of miR-222-3p in several cancer types [40], [41], [42], [43], [44], [45]. (For interpretation of the references to colour in this figure legend, the reader is referred to the web version of this article.)
3. Discussion
The RNA interactions, especially between mRNAs and ncRNAs, have been widely concerned because the RNA-RNA interactions may perturb gene expression and contribute to tumorigenesis. Herein, in order to obtain expression and functional relevant cancer-associated RNAs, an integrative analysis is performed to survey and identify cross-talks among mRNAs and ncRNAs. Based on integrated datasets in PRAD, 8 deregulated hub genes (TK1, PDIA5, NME2, TMEM132A, SLC12A8, DBNDD1, PYCR1 and FAM107A) are surveyed using WGCN and Cox regression analysis, and most genes also have significant positive or negative expression correlations (Fig. 2B), indicating that they may have expression and functional associations. The gene set is then built a survival model (AUC is 0.972 at 10 year) that can be a specific prognostic biomarker (Fig. 2E), and further validation using GEO data also indicates consistent results (Fig. 2F). A survival model using 7 up-regulated genes show that AUC is 0.995 at 10 year (Figure S2B), and this significant result largely support that these hub genes are crucial in tumorigenesis.
According to screened hub genes, relevant ncRNAs are further surveyed and analyzed. We finally obtain TK1:miR-222-3p:SNHG3 axis that may be a prognostic biomarker and potential therapeutic target, and abnormal expression of them are correlated with poor survival outcomes. TK1 may be a potential diagnostic and prognostic biomarker as well as a therapeutic target for prostate cancer [46], and it might be involved in the development and progression of pancreatic ductal adenocarcinoma (PDAC) by regulating cell proliferation, indicating that TK1 may work as a promising therapeutic target in patients with PDAC [47]. Also, serum TK1 may be a tumor biomarker in breast and prostate cancer [48], implicating its potential roles in cancer diagnosis and prognosis due to its crucial roles in tumorigenesis, and it also has a role in immune response that may be correlated with cancer pathophysiology. miR-222-3p is a kind miRNA that has an important role in tumorigenesis, for example, it might be a potential diagnostic and therapeutic target for hepatocellular carcinoma (HCC) and HBV-related HCC [49]. miR-222-3p can inhibit formation of medulloblastoma stem-like cells by targeting Notch2/c-myc signaling pathway, and it can suppress cell viability, alter cell cycle distribution, and inhibit the formation of MB stem-like cells via the Notch2/c-myc pathway [50]. Relevant lncRNA, SNHG3, may promote gastric cancer progression through the miR-326/TWIST axis and provide a new diagnostic and prognostic biomarker [51]. Indeed, all the 3 RNAs have been validated cross-talks with other RNAs as discussed above, and interactions of diverse RNAs have been widely concerned especially that lncRNA can perturb target mRNA expression via interacting miRNA as a competing endogenous RNA. Moreover, for the screened miR-222-3p, several dominant isomiRs can be found in the miRNA locus, although it shows diverse expression patterns than its homologous miR-221-3p locus (Fig. 4B). Due to alternative and imprecise cleavage during miRNA maturation process, the phenomenon of multiple isomiRs have been widely found in miRNA loci, and some isomiRs may perturb coding-non-coding RNA regulatory network via gaining/losing target mRNAs [52]. These abundant isomiRs with sequence and expression diversities also enrich the small RNA expression profiles that are flexible regulators, which may provide more selections to interact mRNAs and lncRNAs in RNA regulatory network. More importantly, whether these isomiRs with diverse 3′ ends and enrichment levels may affect interactions with other RNAs still remains unclear, while various isomiRs further complicate RNA cross-talks with potential functional collaboration as well as homologous miRNAs.
Taken together, to obtain functional relevant RNAs associated with PRAD, a survival model containing 8 genes is constructed as a specific biomarker for cancer prognosis, and further analysis shows that TK1:miR-222-3p:SNHG3 axis may be a potential prognostic biomarker via RNA cross-talks. Based on their roles in tumorigenesis, they also may be potential therapeutic targets in future precision medicine, which will contribute to understanding the detailed molecular mechanisms of cancer.
4. Materials and methods
4.1. Data resource
To screen potential ceRNA interactions in PRAD, we obtained relevant RNA sequencing data (52 normal samples and 499 tumor samples) and the clinical data (mainly including survival status, cancer stage and grade, survival time, and molecular subtype) from The Cancer Genome Atlas (TCGA) (https://tcga-data.nci.nih.gov/tcga/) using the “TCGAbiolinks” package [53] (https://doi.org/10.1093/nar/gkv1507). Simultaneously, another 100 normal samples were downloaded from the GTEx portal database (https://xenabrowser.net/datapages/). Differentially expression profiles were estimated using limma [54] for mRNAs and lncRNAs, and genes were significantly dysregulated if |log2FC| > 1.5 and padj < 0.05. Differentially expressed miRNAs/isomiRs were obtained using DESeq2 [55], and related deregulated small RNAs with mRNAs were primarily collected according to |log2FC| > 1.2 and padj < 0.05, while further strict analysis was performed using |log2FC| > 1.5 and padj < 0.05.
Moreover, in order to simultaneously understand expression patterns of screened genes in other cancer types that contributed to revealing their roles in tumorigenesis and expression specificity, the screened RNAs were also performed a pan-cancer analysis according to high-throughput sequencing data of other cancer types in TCGA.
4.2. Function enrichment analysis
For screened significantly deregulate mRNAs, functional enrichment analysis was conducted with The Database for Annotation, Visualization and Integrated Discovery (DAVID) version 6.8 [56]. Based on analyzed KEGG pathways, z scores were then calculated using the following formula [57]:
| (1) |
in which count indicated the number of deregulated genes, up indicated the numbers of up-regulated genes, and down indicated the numbers of down-regulated genes.
To understand the potential roles in cancer development, dysregulated genes were also investigated distributions associated with hallmarks of cancer [58] (https://software.broadinstitute.org/gsea/msigdb/), whether they were core essential genes according to the common data of Hart et al. [59], Blomen et al. [60] and Wang et al. [61], and whether they were identified as human cancer genes.
4.3. Screening of crucial mRNA modules based on WGCNA
Weighted gene co-expression network analysis, WGCNA [62], was used to screen potential crucial mRNA modules. Variance distributions of normalized data of TCGA and GETx were compared, and the top 40 % genes (based on multiple comparison analysis with other selections) were used to screen related gene modules using WGCNA, an R package [62]. Different gene co-expression modules were divided according to soft threshold, and these modules were used to screen crucial mRNAs associated with cancer. Then, correlation analysis of genes associated cancer and genes in screened modules were used to screen crucial genes.
4.4. COX regression analysis validating prognostic values
Based on the screened candidate genes with potential prognostic values, hub genes were analyzed using Cox multivariate regression analysis. The prognostic model of risk assessment was then constructed. In order to understand the potential association of these genes with cancer, prognostic risk scores of the screened hub genes were estimated using the formula (2):
| (2) |
in which N indicated the number of key prognostic genes, Expi indicated genei expression, Ci indicated estimated regression coefficient of genei.
The potential expression correlations among the screened hub genes were analyzed to understand their expression relationships, and groups with high-risk and low-risk were analyzed to understand whether these gene sets could distinguish different groups.
4.5. Survival analysis
To validate whether screened genes (including mRNAs and ncRNAs) have potential prognostic values in cancer, survival analysis was performed. The log-rank test was used to calculate the differences between the high expression group and low expression group, and a p < 0.05 indicated significant difference. Simultaneously, to obtain an integrative survival result, prognostic analysis was also obtained in the GEPIA [63], [64] and StarBase [65], [66] databases.
The ROC (receiver-operating characteristics) was used to compare the diagnostic power for the screened gene sets according to the area under the ROC curve (AUC).
4.6. Construction of networks to screen cancer-associated RNAs
According to screened RNAs, interaction networks among different RNAs (hub genes, interacted miRNAs and associated lncRNAs) were constructed using Cytoscape 3.8.2 [67], and ceRNA networks were constructed using a R package of “networkD3” (https://CRAN.R-project.org/package=networkD3). The primary networks were firstly constructed according to relevant RNAs, and then they were further optimized according to the correlations of RNAs (the correlation coefficients of mRNA:miRNA and miRNA:lncRNA were less than – 0.20, p < 0.05).
4.7. Understanding the potential biological role of RNAs via in-depth analysis
To further understand the potential biological roles of the finally screened crucial RNAs, especially the potential roles in tumorigenesis, in-depth analysis was performed. For example, screened RNAs were further queried for their roles in immune process according to TIMER [68], the protein expression patterns of screened mRNA in tumor and normal tissues were obtained from The Human Protein Atlas (HPA) [69], correlation of gene expression and methylation was obtained from UALCAN [70], screened specific lncRNA was analyzed its subcellular localization using lncLocato [71], [72] that contributed to understanding potential interaction with other RNAs.
4.8. Statistical analysis
To validate the potential difference between different groups, an unpaired t test, the Wilcoxon rank-sum test, and trend test were performed in this study. To calculate the expression correlations among different genes, a Pearson or a Spearman correlation coefficient was analyzed. All these statistical analyses were performed using R programming language (version 3.4.3), and venn distributions were performed with Venn (http://bioinformatics.psb.ugent.be/webtools/Venn/).
Abbreviation lists of cancers in TCGA.
BLCA, bladder urothelial carcinoma; BRCA, breast invasive carcinoma; CHOL, cholangiocarcinoma; COAD, colon adenocarcinoma; ESCA, esophageal carcinoma; HNSC, head and neck squamous cell carcinoma; KICH, kidney chromophobe; KIRC, Kidney renal clear cell carcinoma; KIRP, kidney renal papillary cell carcinoma; LIHC, liver hepatocellular carcinoma; LUAD, lung adenocarcinoma; LUSC, lung squamous cell carcinoma; PRAD, prostate adenocarcinoma; READ, rectum adenocarcinoma; STAD, stomach adenocarcinoma; THCA, thyroid carcinoma; UCEC, uterine corpus endometrial carcinoma.
Declaration of Competing Interest
The authors declare that they have no known competing financial interests or personal relationships that could have appeared to influence the work reported in this paper.
Acknowledgments
This work was supported by National Natural Science Foundation of China (Nos. 61771251 and 62171236), the key projects of Natural Science Research in Universities of Jiangsu Province (22KJA180006), the key project of social development in Jiangsu Province (No. BE2016773), Sponsored by NUPTSF (No. NY220041), the Qinglan Project in Jiangsu Province, and the Priority Academic Program Development of Jiangsu Higher Education Institution (PAPD).
Footnotes
Supplementary data to this article can be found online at https://doi.org/10.1016/j.csbj.2022.07.020.
Appendix A. Supplementary data
The following are the Supplementary data to this article:
References
- 1.Watson P.A., Arora V.K., Sawyers C.L. Emerging mechanisms of resistance to androgen receptor inhibitors in prostate cancer. Nat Rev Cancer. 2015;15(12):701–711. doi: 10.1038/nrc4016. [DOI] [PMC free article] [PubMed] [Google Scholar]
- 2.Siegel R.L., Miller K.D., Jemal A. Cancer statistics, 2019. CA Cancer J Clin. 2019;69(1):7–34. doi: 10.3322/caac.21551. [DOI] [PubMed] [Google Scholar]
- 3.Siegel R.L., Miller K.D., Jemal A. Cancer statistics, 2016. CA Cancer J Clin. 2016;66(1):7–30. doi: 10.3322/caac.21332. [DOI] [PubMed] [Google Scholar]
- 4.Mottet N., van den Bergh R.C.N., Briers E., Van den Broeck T., Cumberbatch M.G., De Santis M., et al. EAU-EANM-ESTRO-ESUR-SIOG Guidelines on Prostate Cancer-2020 Update. Part 1: Screening, Diagnosis, and Local Treatment with Curative Intent. Eur Urol. 2021;79(2):243–262. doi: 10.1016/j.eururo.2020.09.042. [DOI] [PubMed] [Google Scholar]
- 5.Bill-Axelson A., Holmberg L., Garmo H., Rider J.R., Taari K., Busch C., et al. Radical prostatectomy or watchful waiting in early prostate cancer. N Engl J Med. 2014;370(10):932–942. doi: 10.1056/NEJMoa1311593. [DOI] [PMC free article] [PubMed] [Google Scholar]
- 6.Etzioni R., Urban N., Ramsey S., McIntosh M., Schwartz S., Reid B., et al. The case for early detection. Nat Rev Cancer. 2003;3(4):243–252. doi: 10.1038/nrc1041. [DOI] [PubMed] [Google Scholar]
- 7.Hu J., He J., Kuang Y., Wang Z., Sun Z., Zhu H., et al. Expression and significance of 90K/Mac-2BP in prostate cancer. Exp Ther Med. 2013;5(1):181–184. doi: 10.3892/etm.2012.768. [DOI] [PMC free article] [PubMed] [Google Scholar]
- 8.Javed Z., Khan K., Rasheed A., Sadia H., Shahwani M.N., Irshad A., et al. Targeting androgen receptor signaling with MicroRNAs and Curcumin: a promising therapeutic approach for Prostate Cancer Prevention and intervention. Cancer Cell Int. 2021;21(1):77. doi: 10.1186/s12935-021-01777-3. [DOI] [PMC free article] [PubMed] [Google Scholar]
- 9.Fu C., Zhang Q., Wang A., Yang S., Jiang Y., Bai L., et al. EWI-2 controls nucleocytoplasmic shuttling of EGFR signaling molecules and miRNA sorting in exosomes to inhibit prostate cancer cell metastasis. Mol Oncol. 2021;15(5):1543–1565. doi: 10.1002/1878-0261.12930. [DOI] [PMC free article] [PubMed] [Google Scholar]
- 10.Huang K., Tang Y. SChLAP1 promotes prostate cancer development through interacting with EZH2 to mediate promoter methylation modification of multiple miRNAs of chromosome 5 with a DNMT3a-feedback loop. Cell Death Dis. 2021;12(2):188. doi: 10.1038/s41419-021-03455-8. [DOI] [PMC free article] [PubMed] [Google Scholar]
- 11.Liu H.P., Lai H.M., Guo Z. Prostate cancer early diagnosis: circulating microRNA pairs potentially beyond single microRNAs upon 1231 serum samples. Brief Bioinform. 2021;22(3):bbaa111. doi: 10.1093/bib/bbaa111. [DOI] [PubMed] [Google Scholar]
- 12.Ronnau C.G.H., Fussek S., Smit F.P., Aalders T.W., van Hooij O., Pinto P.M.C., et al. Upregulation of miR-3195, miR-3687 and miR-4417 is associated with castration-resistant prostate cancer. World J Urol. 2021;39(10):3789–3797. doi: 10.1007/s00345-021-03723-4. [DOI] [PMC free article] [PubMed] [Google Scholar]
- 13.Nadiminty N., Tummala R., Liu C., Yang J., Lou W., Evans C.P., et al. NF-kappaB2/p52 induces resistance to enzalutamide in prostate cancer: role of androgen receptor and its variants. Mol Cancer Ther. 2013;12(8):1629–1637. doi: 10.1158/1535-7163.MCT-13-0027. [DOI] [PMC free article] [PubMed] [Google Scholar]
- 14.Yan K., Hou L., Liu T., Jiao W., Ma Q., Fang Z., et al. lncRNA OGFRP1 functions as a ceRNA to promote the progression of prostate cancer by regulating SARM1 level via miR-124-3p. Aging (Albany NY) 2020;12(10):8880–8892. doi: 10.18632/aging.103007. [DOI] [PMC free article] [PubMed] [Google Scholar]
- 15.Huang C., Deng H., Wang Y., Jiang H., Xu R., Zhu X., et al. Circular RNA circABCC4 as the ceRNA of miR-1182 facilitates prostate cancer progression by promoting FOXP4 expression. J Cell Mol Med. 2019;23(9):6112–6119. doi: 10.1111/jcmm.14477. [DOI] [PMC free article] [PubMed] [Google Scholar]
- 16.Wang Z.Y., Duan Y., Wang P. SP1-mediated upregulation of lncRNA SNHG4 functions as a ceRNA for miR-377 to facilitate prostate cancer progression through regulation of ZIC5. J Cell Physiol. 2020;235(4):3916–3927. doi: 10.1002/jcp.29285. [DOI] [PubMed] [Google Scholar]
- 17.Yang B., Tang X., Wang Z., Sun D., Wei X., Ding Y. TUG1 promotes prostate cancer progression by acting as a ceRNA of miR-26a. Biosci Rep. 2018;38(5) doi: 10.1042/BSR20180677. BSR20180677. [DOI] [PMC free article] [PubMed] [Google Scholar]
- 18.Yu Y., Gao F., He Q., Li G., Ding G. lncRNA UCA1 Functions as a ceRNA to Promote Prostate Cancer Progression via Sponging miR143. Mol Ther Nucleic Acids. 2020;19:751–758. doi: 10.1016/j.omtn.2019.11.021. [DOI] [PMC free article] [PubMed] [Google Scholar]
- 19.Li X.Y., You J.X., Zhang L.Y., Su L.X., Yang X.T. A Novel Model Based on Necroptosis-Related Genes for Predicting Prognosis of Patients With Prostate Adenocarcinoma. Front Bioeng Biotechnol. 2021;9 doi: 10.3389/fbioe.2021.814813. [DOI] [PMC free article] [PubMed] [Google Scholar]
- 20.Fei H., Chen X. Development of a novel five-gene immune-related risk model for the prognosis evaluation of prostate adenocarcinoma patients. Am J Cancer Res. 2022;12(5):2337–2349. [PMC free article] [PubMed] [Google Scholar]
- 21.Hu D., Cao Q., Tong M., Ji C., Li Z., Huang W., et al. A novel defined risk signature based on pyroptosis-related genes can predict the prognosis of prostate cancer. BMC Med Genomics. 2022;15(1):24. doi: 10.1186/s12920-022-01172-5. [DOI] [PMC free article] [PubMed] [Google Scholar]
- 22.Ravegnini G., Cargnin S., Sammarini G., Zanotti F., Bermejo J.L., Hrelia P., et al. Prognostic Role of miR-221 and miR-222 Expression in Cancer Patients:A Systematic Review and Meta-Analysis. Cancers (Basel) 2019;11(7):970. doi: 10.3390/cancers11070970. [DOI] [PMC free article] [PubMed] [Google Scholar]
- 23.Gan K., Dong G.H., Wang N., Zhu J.F. miR-221-3p and miR-222-3p downregulation promoted osteogenic differentiation of bone marrow mesenchyme stem cells through IGF-1/ERK pathway under high glucose condition. Diabetes Res Clin Pract. 2020;167 doi: 10.1016/j.diabres.2020.108121. [DOI] [PubMed] [Google Scholar]
- 24.Guo L., Liang T. MicroRNAs and their variants in an RNA world: implications for complex interactions and diverse roles in an RNA regulatory network. Brief Bioinform. 2018;19(2):245–253. doi: 10.1093/bib/bbw124. [DOI] [PubMed] [Google Scholar]
- 25.Cloonan N., Wani S., Xu Q., Gu J., Lea K., Heater S., et al. MicroRNAs and their isomiRs function cooperatively to target common biological pathways. Genome Biol. 2011;12(12):R126. doi: 10.1186/gb-2011-12-12-r126. [DOI] [PMC free article] [PubMed] [Google Scholar]
- 26.Neilsen C.T., Goodall G.J., Bracken C.P. IsomiRs–the overlooked repertoire in the dynamic microRNAome. Trends Genet. 2012;28(11):544–549. doi: 10.1016/j.tig.2012.07.005. [DOI] [PubMed] [Google Scholar]
- 27.Tan G.C., Chan E., Molnar A., Sarkar R., Alexieva D., Isa I.M., et al. 5' isomiR variation is of functional and evolutionary importance. Nucleic Acids Res. 2014;42(14):9424–9435. doi: 10.1093/nar/gku656. [DOI] [PMC free article] [PubMed] [Google Scholar]
- 28.Telonis A.G., Magee R., Loher P., Chervoneva I., Londin E., Rigoutsos I. Knowledge about the presence or absence of miRNA isoforms (isomiRs) can successfully discriminate amongst 32 TCGA cancer types. Nucleic Acids Res. 2017;45(6):2973–2985. doi: 10.1093/nar/gkx082. [DOI] [PMC free article] [PubMed] [Google Scholar]
- 29.Jerby-Arnon L., Pfetzer N., Waldman Y.Y., McGarry L., James D., Shanks E., et al. Predicting cancer-specific vulnerability via data-driven detection of synthetic lethality. Cell. 2014;158(5):1199–1209. doi: 10.1016/j.cell.2014.07.027. [DOI] [PubMed] [Google Scholar]
- 30.Sinha S., Thomas D., Chan S., Gao Y., Brunen D., Torabi D., et al. Systematic discovery of mutation-specific synthetic lethals by mining pan-cancer human primary tumor data. Nat Commun. 2017;8:15580. doi: 10.1038/ncomms15580. [DOI] [PMC free article] [PubMed] [Google Scholar]
- 31.Guo J., Liu H., Zheng J. SynLethDB: synthetic lethality database toward discovery of selective and sensitive anticancer drug targets. Nucleic Acids Res. 2016;44(D1):D1011–D1017. doi: 10.1093/nar/gkv1108. [DOI] [PMC free article] [PubMed] [Google Scholar]
- 32.Li X.J., Mishra S.K., Wu M., Zhang F., Zheng J. Syn-lethality: an integrative knowledge base of synthetic lethality towards discovery of selective anticancer therapies. Biomed Res Int. 2014;2014 doi: 10.1155/2014/196034. [DOI] [PMC free article] [PubMed] [Google Scholar]
- 33.Srivas R., Shen J.P., Yang C.C., Sun S.M., Li J., Gross A.M., et al. A Network of Conserved Synthetic Lethal Interactions for Exploration of Precision Cancer Therapy. Mol Cell. 2016;63(3):514–525. doi: 10.1016/j.molcel.2016.06.022. [DOI] [PMC free article] [PubMed] [Google Scholar]
- 34.Zheng S., Jiang F., Ge D., Tang J., Chen H., Yang J., et al. LncRNA SNHG3/miRNA-151a-3p/RAB22A axis regulates invasion and migration of osteosarcoma. Biomed Pharmacother. 2019;112 doi: 10.1016/j.biopha.2019.108695. [DOI] [PubMed] [Google Scholar]
- 35.Zhang P.F., Wang F., Wu J., Wu Y., Huang W., Liu D., et al. LncRNA SNHG3 induces EMT and sorafenib resistance by modulating the miR-128/CD151 pathway in hepatocellular carcinoma. J Cell Physiol. 2019;234(3):2788–2794. doi: 10.1002/jcp.27095. [DOI] [PubMed] [Google Scholar]
- 36.Wang L., Su K., Wu H., Li J., Song D. LncRNA SNHG3 regulates laryngeal carcinoma proliferation and migration by modulating the miR-384/WEE1 axis. Life Sci. 2019;232 doi: 10.1016/j.lfs.2019.116597. [DOI] [PubMed] [Google Scholar]
- 37.Sui G., Zhang B., Fei D., Wang H., Guo F., Luo Q. The lncRNA SNHG3 accelerates papillary thyroid carcinoma progression via the miR-214-3p/PSMD10 axis. J Cell Physiol. 2020;235(10):6615–6624. doi: 10.1002/jcp.29557. [DOI] [PubMed] [Google Scholar]
- 38.Dai G., Huang C., Yang J., Jin L., Fu K., Yuan F., et al. LncRNA SNHG3 promotes bladder cancer proliferation and metastasis through miR-515-5p/GINS2 axis. J Cell Mol Med. 2020;24(16):9231–9243. doi: 10.1111/jcmm.15564. [DOI] [PMC free article] [PubMed] [Google Scholar]
- 39.Dacheng W., Songhe L., Weidong J., Shutao Z., Jingjing L., Jiaming Z. LncRNA SNHG3 promotes the growth and metastasis of colorectal cancer by regulating miR-539/RUNX2 axis. Biomed Pharmacother. 2020;125 doi: 10.1016/j.biopha.2020.110039. [DOI] [PubMed] [Google Scholar]
- 40.Fan L., Lei H., Zhang S., Peng Y., Fu C., Shu G., et al. Non-canonical signaling pathway of SNAI2 induces EMT in ovarian cancer cells by suppressing miR-222-3p transcription and upregulating PDCD10. Theranostics. 2020;10(13):5895–5913. doi: 10.7150/thno.43198. [DOI] [PMC free article] [PubMed] [Google Scholar]
- 41.Zhai S., Xu Z., Xie J., Zhang J., Wang X., Peng C., et al. Epigenetic silencing of LncRNA LINC00261 promotes c-myc-mediated aerobic glycolysis by regulating miR-222-3p/HIPK2/ERK axis and sequestering IGF2BP1. Oncogene. 2021;40(2):277–291. doi: 10.1038/s41388-020-01525-3. [DOI] [PMC free article] [PubMed] [Google Scholar]
- 42.Liu L., Wang H.J., Meng T., Lei C., Yang X.H., Wang Q.S., et al. lncRNA GAS5 Inhibits Cell Migration and Invasion and Promotes Autophagy by Targeting miR-222-3p via the GAS5/PTEN-Signaling Pathway in CRC. Mol Ther Nucleic Acids. 2019;17:644–656. doi: 10.1016/j.omtn.2019.06.009. [DOI] [PMC free article] [PubMed] [Google Scholar] [Retracted]
- 43.Wei F., Ma C., Zhou T., Dong X., Luo Q., Geng L., et al. Exosomes derived from gemcitabine-resistant cells transfer malignant phenotypic traits via delivery of miRNA-222-3p. Mol Cancer. 2017;16(1):132. doi: 10.1186/s12943-017-0694-8. [DOI] [PMC free article] [PubMed] [Google Scholar]
- 44.Wang X., Cheng M.L., Gong Y., Ma W.J., Li B., Jiang Y.Z. LncRNA DANCR promotes ATG7 expression to accelerate hepatocellular carcinoma cell proliferation and autophagy by sponging miR-222-3p. Eur Rev Med Pharmacol Sci. 2020;24(17):8778–8787. doi: 10.26355/eurrev_202009_22816. [DOI] [PubMed] [Google Scholar]
- 45.Li Z., Yu Z., Meng X., Zhou S., Xiao S., Li X., et al. Long noncoding RNA GAS5 impairs the proliferation and invasion of endometrial carcinoma induced by high glucose via targeting miR-222-3p/p27. Am J Transl Res. 2019;11(4):2413–2421. [PMC free article] [PubMed] [Google Scholar]
- 46.Xie H., Guo L., Wang Z., Peng S., Ma Q., Yang Z., et al. Assessing the Potential Prognostic and Immunological Role of TK1 in Prostate Cancer. Front Genet. 2022;13 doi: 10.3389/fgene.2022.778850. [DOI] [PMC free article] [PubMed] [Google Scholar]
- 47.Zhu X., Shi C., Peng Y., Yin L., Tu M., Chen Q., et al. Thymidine kinase 1 silencing retards proliferative activity of pancreatic cancer cell via E2F1-TK1-P21 axis. Cell Prolif. 2018;51(3):e12428. doi: 10.1111/cpr.12428. [DOI] [PMC free article] [PubMed] [Google Scholar]
- 48.Jagarlamudi K.K., Hansson L.O., Eriksson S. Breast and prostate cancer patients differ significantly in their serum Thymidine kinase 1 (TK1) specific activities compared with those hematological malignancies and blood donors: implications of using serum TK1 as a biomarker. BMC Cancer. 2015;15:66. doi: 10.1186/s12885-015-1073-8. [DOI] [PMC free article] [PubMed] [Google Scholar]
- 49.Sun Y., Shi P., Wu Q., Liu B., Yu Z., Jia H., et al. MiR-222-3p induced by hepatitis B virus promotes the proliferation and inhibits apoptosis in hepatocellular carcinoma by upregulating THBS1. Hum Cell. 2021 doi: 10.1007/s13577-021-00577-1. [DOI] [PubMed] [Google Scholar]
- 50.Wang H., Wang Y., Wang Y. MiR-222-3p inhibits formation of medulloblastoma stem-like cells by targeting Notch2/c-myc signaling pathway. Immunopharmacol Immunotoxicol. 2022;1–8 doi: 10.1080/08923973.2022.2062381. [DOI] [PubMed] [Google Scholar]
- 51.Rao J., Fu J., Meng C., Huang J., Qin X., Zhuang S. LncRNA SNHG3 Promotes Gastric Cancer Cells Proliferation, Migration, and Invasion by Targeting miR-326. J Oncol. 2021;2021:9935410. doi: 10.1155/2021/9935410. [DOI] [PMC free article] [PubMed] [Google Scholar]
- 52.Guo L., Li Y., Cirillo K.M., Marick R.A., Su Z., Yin X., et al. mi-IsoNet: systems-scale microRNA landscape reveals rampant isoform-mediated gain of target interaction diversity and signaling specificity. Brief Bioinform. 2021;22(5):bbab091. doi: 10.1093/bib/bbab091. [DOI] [PMC free article] [PubMed] [Google Scholar]
- 53.Colaprico A., Silva T.C., Olsen C., Garofano L., Cava C., Garolini D., et al. TCGAbiolinks: an R/Bioconductor package for integrative analysis of TCGA data. Nucleic Acids Res. 2016;44(8):e71. doi: 10.1093/nar/gkv1507. [DOI] [PMC free article] [PubMed] [Google Scholar]
- 54.Ritchie M.E., Phipson B., Wu D., Hu Y., Law C.W., Shi W., et al. limma powers differential expression analyses for RNA-sequencing and microarray studies. Nucleic Acids Res. 2015;43(7):e47. doi: 10.1093/nar/gkv007. [DOI] [PMC free article] [PubMed] [Google Scholar]
- 55.Love M.I., Huber W., Anders S. Moderated estimation of fold change and dispersion for RNA-seq data with DESeq2. Genome Biol. 2014;15(12):550. doi: 10.1186/s13059-014-0550-8. [DOI] [PMC free article] [PubMed] [Google Scholar]
- 56.Huang D.W., Sherman B.T., Lempicki R.A. Systematic and integrative analysis of large gene lists using DAVID bioinformatics resources. Nat Protoc. 2009;4(1):44–57. doi: 10.1038/nprot.2008.211. [DOI] [PubMed] [Google Scholar]
- 57.Walter W., Sanchez-Cabo F., Ricote M. GOplot: an R package for visually combining expression data with functional analysis. Bioinformatics. 2015;31(17):2912–2914. doi: 10.1093/bioinformatics/btv300. [DOI] [PubMed] [Google Scholar]
- 58.Hanahan D., Weinberg R.A. Hallmarks of cancer: the next generation. Cell. 2011;144(5):646–674. doi: 10.1016/j.cell.2011.02.013. [DOI] [PubMed] [Google Scholar]
- 59.Hart T., Chandrashekhar M., Aregger M., Steinhart Z., Brown K.R., MacLeod G., et al. High-Resolution CRISPR Screens Reveal Fitness Genes and Genotype-Specific Cancer Liabilities. Cell. 2015;163(6):1515–1526. doi: 10.1016/j.cell.2015.11.015. [DOI] [PubMed] [Google Scholar]
- 60.Blomen V.A., Majek P., Jae L.T., Bigenzahn J.W., Nieuwenhuis J., Staring J., et al. Gene essentiality and synthetic lethality in haploid human cells. Science. 2015;350(6264):1092–1096. doi: 10.1126/science.aac7557. [DOI] [PubMed] [Google Scholar]
- 61.Wang T., Birsoy K., Hughes N.W., Krupczak K.M., Post Y., Wei J.J., et al. Identification and characterization of essential genes in the human genome. Science. 2015;350(6264):1096–1101. doi: 10.1126/science.aac7041. [DOI] [PMC free article] [PubMed] [Google Scholar]
- 62.Langfelder P., Horvath S. WGCNA: an R package for weighted correlation network analysis. BMC Bioinf. 2008;9:559. doi: 10.1186/1471-2105-9-559. [DOI] [PMC free article] [PubMed] [Google Scholar]
- 63.Li C., Tang Z., Zhang W., Ye Z., Liu F. GEPIA2021: integrating multiple deconvolution-based analysis into GEPIA. Nucleic Acids Res. 2021;49(W1):W242–W246. doi: 10.1093/nar/gkab418. [DOI] [PMC free article] [PubMed] [Google Scholar]
- 64.Tang Z., Li C., Kang B., Gao G., Zhang Z. GEPIA: a web server for cancer and normal gene expression profiling and interactive analyses. Nucleic Acids Res. 2017;45(W1):W98–W102. doi: 10.1093/nar/gkx247. [DOI] [PMC free article] [PubMed] [Google Scholar]
- 65.Li JH, Liu S, Zhou H, Qu LH, Yang JH. starBase v2.0: decoding miRNA-ceRNA, miRNA-ncRNA and protein-RNA interaction networks from large-scale CLIP-Seq data. Nucleic Acids Res. 2014;42(Database issue):D92-7. [DOI] [PMC free article] [PubMed]
- 66.Yang JH, Li JH, Shao P, Zhou H, Chen YQ, Qu LH. starBase: a database for exploring microRNA-mRNA interaction maps from Argonaute CLIP-Seq and Degradome-Seq data. Nucleic Acids Res. 2011;39(Database issue):D202-9. [DOI] [PMC free article] [PubMed]
- 67.Shannon P., Markiel A., Ozier O., Baliga N.S., Wang J.T., Ramage D., et al. Cytoscape: A software environment for integrated models of biomolecular interaction networks. Genome Res. 2003;13(11):2498–2504. doi: 10.1101/gr.1239303. [DOI] [PMC free article] [PubMed] [Google Scholar]
- 68.Li T., Fu J., Zeng Z., Cohen D., Li J., Chen Q., et al. TIMER2.0 for analysis of tumor-infiltrating immune cells. Nucleic Acids Res. 2020;48(W1):W509–W514. doi: 10.1093/nar/gkaa407. [DOI] [PMC free article] [PubMed] [Google Scholar]
- 69.Uhlen M., Zhang C., Lee S., Sjostedt E., Fagerberg L., Bidkhori G., et al. A pathology atlas of the human cancer transcriptome. Science. 2017;357(6352):eaan2507. doi: 10.1126/science.aan2507. [DOI] [PubMed] [Google Scholar]
- 70.Chandrashekar D.S., Bashel B., Balasubramanya S.A.H., Creighton C.J., Ponce-Rodriguez I., Chakravarthi B., et al. UALCAN: A Portal for Facilitating Tumor Subgroup Gene Expression and Survival Analyses. Neoplasia. 2017;19(8):649–658. doi: 10.1016/j.neo.2017.05.002. [DOI] [PMC free article] [PubMed] [Google Scholar]
- 71.Cao Z., Pan X., Yang Y., Huang Y., Shen H.B. The lncLocator: a subcellular localization predictor for long non-coding RNAs based on a stacked ensemble classifier. Bioinformatics. 2018;34(13):2185–2194. doi: 10.1093/bioinformatics/bty085. [DOI] [PubMed] [Google Scholar]
- 72.Lin Y., Pan X., Shen H.B. lncLocator 2.0: a cell-line-specific subcellular localization predictor for long non-coding RNAs with interpretable deep learning. Bioinformatics. 2021;37(16):2308–2316. doi: 10.1093/bioinformatics/btab127. [DOI] [PubMed] [Google Scholar]
Associated Data
This section collects any data citations, data availability statements, or supplementary materials included in this article.