

SUMMARY
The amygdala and prelimbic cortex (PL) communicate during fear discrimination retrieval, but how they co-ordinate discrimination of a non-threatening stimulus is unknown. Here, we show that somatostatin (SOM) interneurons in the basolateral amygdala (BLA) become active specifically during learned non-threatening cues and desynchronize cell firing by blocking phase reset of theta oscillations during the safe cue. Furthermore, we show that SOM activation and desynchronization of the BLA is PL-dependent and promotes discrimination of non-threat. Thus, fear discrimination engages PL-dependent coordination of BLA SOM responses to non-threatening stimuli.
In brief
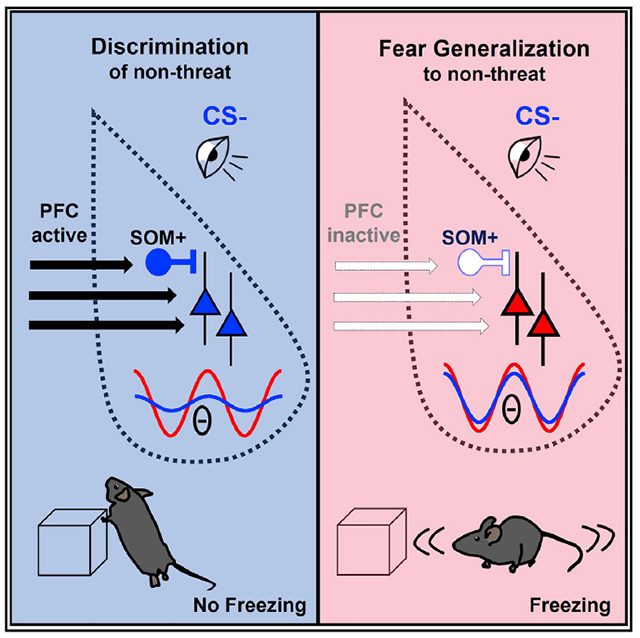
Overgeneralization of fear to non-aversive stimuli is observed in several psychiatric disorders. Using a mouse model, Stujenske et al. identify the dorsomedial prefrontal cortex acting via somatostatin interneurons in the basolateral amygdala as the mechanism that desynchronizes sensory activation of the amygdala during non-aversive stimuli, thereby suppressing generalized fear responses.
Graphical Abstract
INTRODUCTION
Generalized fear is a cardinal symptom in disorders of trauma and anxiety and is associated with a hyperactive amygdala and a hypoactive medial prefrontal cortex (mPFC) (Ghosh and Chattarji, 2015; Hayes et al., 2012; Milad et al., 2009). Neural signatures of fear discrimination are present in the basolateral amygdala (BLA) (Grewe et al., 2017; Grosso et al., 2018; Sangha et al., 2013), and mice with dysfunctional BLA inhibitory circuits generalize fear (Bergado-Acosta et al., 2008; Shaban et al., 2006).
During classical fear conditioning, the BLA parvalbumin-positive (PV) and somatostatin-positive (SOM) interneurons (INs) play opposing roles (Krabbe et al., 2019; Wolff et al., 2014), promoting and impeding fear acquisition, respectively. However, the role of BLA INs during discrimination of non-threatening cues is unknown.
Furthermore, the question remains whether discrimination of non-threat is an actively maintained or a passive process. Recent work showed that during conditioning, BLA principal neurons (PNs) remap to encode fear-conditioned stimuli, whereas neutral stimuli remain passively maintained (Grewe et al., 2017). However, it was also shown that discrimination learning recruits specific PNs and INs that prevent generalization (Grosso et al., 2018), suggesting that generalization is actively prevented. Given that BLA SOMs are posited to dampen defensive freezing and gate BLA PN potentiation (Ito et al., 2020), we sought to investigate how BLA SOMs participate in the retrieval of learned non-threat and interact with the mPFC, which is critical for fear discrimination (Likhtik et al., 2014).
RESULTS
BLA SOM INs selectively upregulate during the CS
We trained mice (n = 18) on a 3-day auditory differential fear conditioning (DFC) paradigm (Likhtik et al., 2014) (Figure 1A).The CS+ was paired with a shock, and the CS− was explicitly un-paired (tones of 2 or 8 kHz, 50 ms pips at 1 Hz for 30 s). After con-ditioning, mice were exposed to either CS+ (n = 9) or CS− (n = 9) in a new context to quantify BLA SOMs and PV c-fos co-labeling (Figures 1A–1B). SOM INs were significantly more active during CS− than CS+ retrieval (Figures 1C and 1D). PV INs exhibited a smaller, non-significant difference (Figures 1C and 1D). Total c-fos expression also did not differ (Figure S1A), consistent with our prior electrophysiology findings (Likhtik et al., 2014; Stujenske et al., 2014).
Figure 1. BLA SOM interneurons are selectively upregulated during CS− retrieval (see Table S1 for statistics).
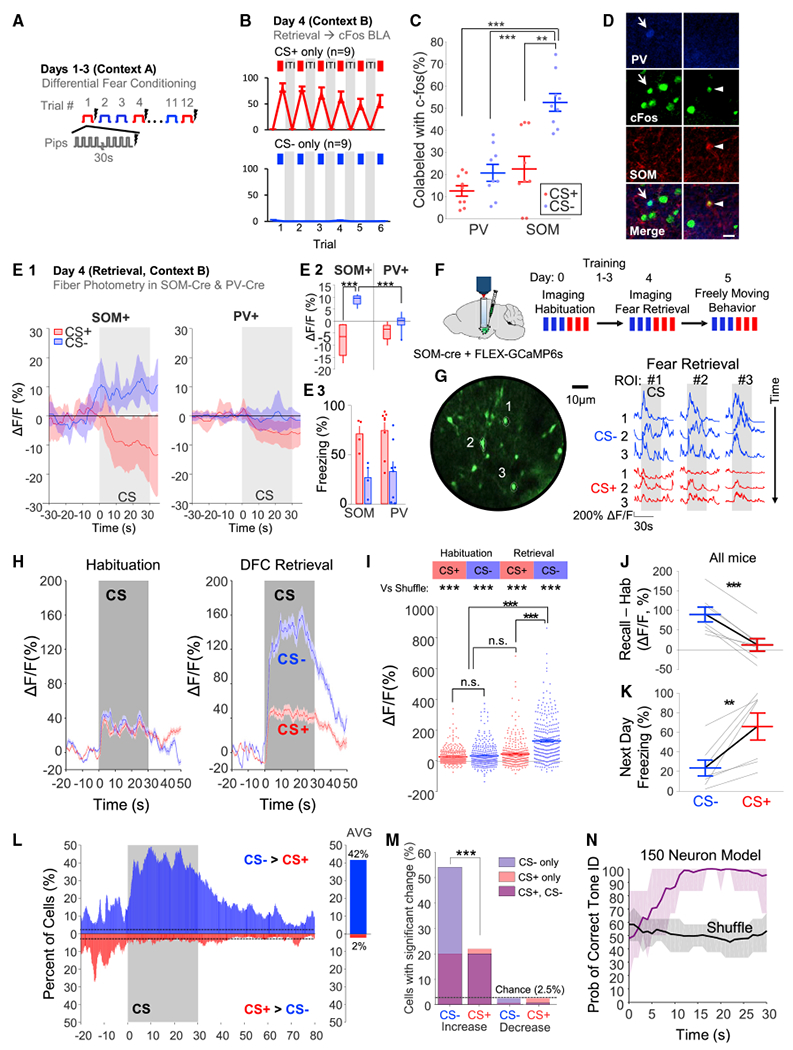
(A) Summary of 3-day differential fear conditioning paradigm.
(B) On day 4, mice were randomized to undergo CS+ (n = 9) or CS— (n = 9) retrieval. Mice froze significantly more to the CS+ (top, red) than the CS− (bottom, blue).
(C) PV and SOM co-labeling with c-fos revealed increased SOM IN activity during CS−.
(D) PV INs (blue, full arrow, left) and SOM INs (red, arrowhead, right) co-labeled with c-fos. Scale bars, 20 μm.
(E) Fiber photometry of SOM (n = 4) and PV INs (n = 8) during retrieval. (E1) Mean time course of CS response. (E2) Average CS response of PV and SOM INs. (E3) Average CS freezing.
(F) Schematic of calcium imaging experiments. Note that the mice were also exposed to another three CS− and three CS+ trials on day 4 in a subsequent experiment (Figure 3).
(G) Left, maximum projection of GCaMP6s fluorescence. Right, SOM INs exhibit reliable CS− responses.
(H) Average SOM IN activity during habituation and retrieval.
(I) Magnitude of SOM IN responses to the CSs; “vs shuffle” compares to a shift predictor.
(J) Per mouse change in average response from habituation to recall.
(K) The day after imaging, all mice behaviorally discriminated, despite some partial extinction.
(L) Left, percent of SOM INs with a significant CS− > CS+ response (blue) or CS+ > CS− (red). Right, 42% of cells exhibited a greater CS− response while only 2% of cells exhibited a greater CS+ response (chance: 2.5%).
(M) SOM INs with significantly increased (left) or decreased (right) activity during the CSs. Purple reflects response to both CSs.
(N) SVMs were trained for subsamples of 150 neurons from the full dataset to decode CS+ versus CS−. The probability of correct tone identification is plotted as the mean ±95% CI. Time delay to peak performance reflects the time constant of the fluorophore.
*p < 0.05, **p < 0.01, ***p < 0.001. n.s., non-significant. Unless specified, data plotted as mean ± SEM.
Fiber photometry in SOM-cre (n = 4) and PV-cre (n = 8) mice revealed that BLA SOM INs exhibited significantly increased activity during the CS−, whereas there was a weaker, non-significant trend toward a difference in PV INs (Figures 1E, S1B, and S1C). Individual SOM IN responses during DFC were further characterized with two-photon calcium imaging (Figures 1F, 1G, and S1D–S1F), first during stimulus habituation and then after DFC, during retrieval (n = 378 total cells from seven mice). SOM INs weakly responded to both stimuli during habituation (Figure 1H; n = 322). During retrieval, only the CS− induced a strong response (Figures 1H–1J; n = 306). The next day, all mice discriminated while freely moving (Figure 1K).
SOM INs responded preferentially to the CS− with short latency (Figures 1L and S1G). 54% of SOM INs (n = 306) were significantly activated by the CS− (with 20% also active to the CS+), compared with 22% of SOM INs activated by the CS+ (with 91% also responsive to the CS−; Figure 1M). We found that the CS− response was largely homogeneous (81% of variance explained by a single principal component; Figures S1H–S1K). The computational relevance of the SOM IN response was confirmed using a support vector machine (SVM) linear classifier, which demonstrated high decoding accuracy of stimulus identity, both in individual mice and across mice (Figures 1N and S1I–S1M).
BLA SOM INs mediate CS− discrimination by reducing BLA theta synchrony
Next, we tested BLA SOM and PV function during discrimination retrieval. SOM− Cre and PV-Cre mice were injected with cre-dependent viruses expressing the inhibitory opsin, eArch3.0, or eYFP, and optic fibers were implanted above the BLA (Figures 2A–2C and S2). During DFC retrieval, light was paired with half of the CS trials (Figures 2B, 2C, and S2A). SOM inhibition selectively enhanced freezing to the CS− in eArch mice (Figure 2D; n = 8) but not in controls (Figure 2A; n = 11). Inhibition decreased the discrimination score (see STAR Methods) by 62.1% ± 11.3% (Figure 2E). PV IN inhibition did not have a significant effect on discrimination (Figure 2E; n = 8), although there was variability between mice (Figure S2A).
Figure 2. BLA SOM mediate discrimination by desynchronizing inputs to the amygdala during CS− (see Table S2 for statistics).
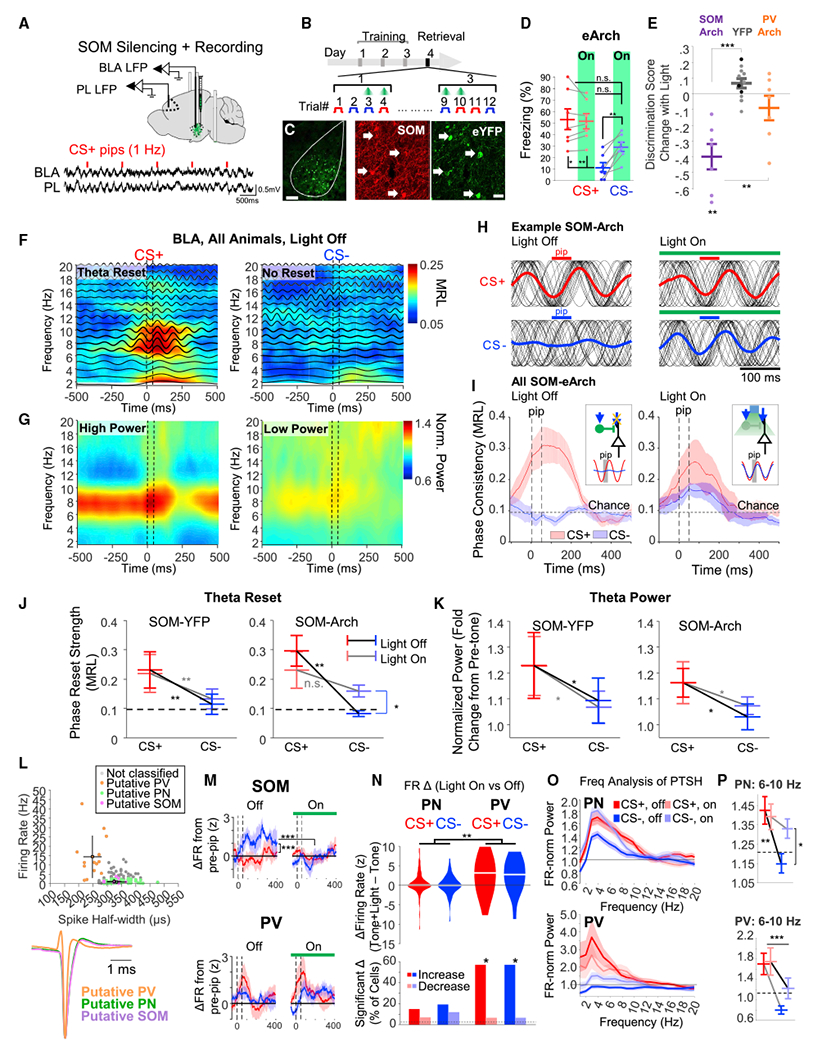
(A) Top, Cre-dependent adeno-associated viruses (AAVs) expressed eArch3.0 or eYFP in the BLA of SOM-cre mice. A subset of mice had electrodes implanted for recording LFPs and single cells. Bottom, example LFP recordings (CS+ pips, red lines).
(B) During fear retrieval, half of CS presentations were paired with light.
(C) Histology of SOM-cre mouse expressing eYFP. Scale bars, 200 μm.
(D) Freezing of eArch group (n = 7) during CSs in the presence or absence of light in the BLA.
(E) Change in discrimination score with light in SOM-Arch (purple, n = 7), control (n = 8 SOM-cre [gray], n = 3 PV-cre [black]), and PV-Arch (orange, n = 8) mice.
(F) Heat map depicts phase consistency at different frequencies of BLA LFP, averaged over all SOM-cre mice (n = 6, eArch; n = 7, eYFP) during CSs (light off). Average bandpass signals are overlaid (2-Hz bandwidth, centered at frequency on y axis). Consistency at 1–3 Hz may reflect delta oscillations or pip-evoked activity. Note that temporal smoothing from the Hamming window artificially blurs phase reset prior to the pip. Also see Figure S2.
(G) Average spectrogram for mice as in (F).
(H) CS pip-evoked theta-filtered (6–10 Hz) phase-only LFPs (black traces) for individual CS presentations are overlain from a SOM-Arch mouse during light off and on.
(I) Average theta phase consistency of Arch-expressing mice (n = 6) during CSs with and without light. Insets, schematic illustrating the effect: during the CS− (blue arrow), SOM INs are activated and block PN theta reset via dendritic inhibition. When SOM INs are less active (CS+ or light on), reset occurs. Sine waves are scaled to the magnitude of the average resets.
(J) Pip-evoked theta reset strength of SOM-YFP and SOM-Arch mice during CSs, with or without light. Asterisks indicate the main effect of CS or significant Bonferroni post hoc tests.
(K) As in (J), for theta power, which was not changed by light.
(L) Top, plot of single unit spike half-width versus FR for putative PN (green), PV (orange), SOM (purple), and non-classified (gray) neurons (see STAR Methods), with group average ± standard deviation, n = 114 PN, 14 PV, 11 SOM, 40 non-classified from n = 5 mice.
Bottom, average spike waveform for each neuronal group, normalized to the spike trough.
(M) Peri-pip FR changes for putative SOM (top) and PV (bottom) INs during light on and off. Dashed lines, pip.
(N) Top, light-induced FR changes during CSs for PN and PV. Bottom, percent of putative PN and PV that exhibited significant changes in firing with light during CSs.
(O) Power spectra of average pip-evoked single unit responses (FR normalized as fold change from 150–500 Hz) for putative PN (top, n = 95 with sufficient spikes) and PV neurons (bottom, n = 14), with and without light.
(P) Average of theta power in PN (top) and PV (bottom).
*p < 0.05, **p < 0.01, ***p < 0.001. Unless specified, data plotted as mean ± SEM.
Given that SOM INs mediate distal dendritic inhibition of BLA PNs (Muller et al., 2007), we tested whether SOM INs gate incoming sensory input, which reliably induces fear-related synchronous changes in the BLA-mPFC circuit (Ito et al., 2020; Krabbe et al., 2019). We therefore recorded local field potentials (LFPs) in the BLA and prelimbic cortex (PL) with and without BLA SOM silencing. As previously reported (Likhtik et al., 2014), during retrieval, the CS+ evoked higher power and phase reset of the ongoing theta oscillations in BLA than the CS− (Figures 2F–2I and S2; n = 13), indicating synchronized population neuronal activation during the CS+. In SOM-Arch mice (n = 6) but not in controls (n = 7), SOM inhibition induced a theta phase reset to the CS− with similar temporal dynamics to the CS+, without a significant effect during CS+ (Figures 2H–2J and S2). Notably, the effect of silencing on the theta reset was highly specific, as light did not alter BLA or PL theta power (Figure 2K), BLA-PL theta coherence, or the PL-to-BLA direction of information transfer during the CS− (Figure S2), which followed expected patterns of activity (Likhtik et al., 2014).
We then recorded BLA single units during fear retrieval in another set of SOM-Arch mice (n = 179 single units from n = 5 mice; Figure 2L). Putative SOM INs were optogenetically identified (n = 11), and we found that CS− pips evoked a time-locked response, while CS+ pips did not (Figure 2M; CS− versus CS+ average Z score difference of 2.90 ± 0.85, p = 0.0004, paired t test). Putative PV INs (n = 14), defined based on previously described electrophysiological characteristics (Wolff et al., 2014), exhibited time-locked firing after both CS+ and CS− pips (Figure 2M), with no difference in response magnitude (CS− versus CS+ Z score difference of −0.67 ± 0.82, p = 0.42, paired t test) but a non-significant trend for the response dynamics (time × CS interaction, p = 0.06; Figure 2L). Thus, PV INs are engaged in the discrimination process but likely in a more nuanced way than SOM INs.
SOM IN silencing did not change the pip-evoked firing pattern of putative PV INs (Figure 2M) but induced a significantly higher firing rate (FR) in over 50% (Figures 2N and S2). Putative PNs showed mixed changes in firing when SOM INs were silenced during the CSs (Figure 2N), such that there was no significant net change in population firing. These findings suggest that when SOM INs are suppressed, average PN firing is stabilized–likely by increased PV IN activity.
Lastly, we studied theta-frequency modulation of firing in putative PNs (Figure 2O; STAR Methods). We reasoned that if individual cells exhibit theta resets, this would be visible as a frequency component in the average pip-evoked firing. During light off, the average pip-evoked firing of PNs showed a stronger theta (6–10 Hz) component during the CS+ than CS− (Figure 2O and 2P), but when SOM INs were inhibited during the CS−, there was a drastic increase in the theta component, analogous to LFP theta reset (Figures 2H and 2I).
Putative PV INs exhibited a similar pattern, with a non-significant trend toward the same effect of light as PNs (Figures 2O and 2P). These data suggest that BLA SOM INs selectively gate incoming sensory input to PNs during the CS−, specifically preventing theta reset.
PL upregulates BLA SOM activity during the CS
Given that the PL partakes in discrimination learning (Lee and Choi, 2012; Meyer and Bucci, 2014) and PL-BLA communication contributes to DFC retrieval (Burgos-Robles et al., 2017; Klavir et al., 2013; Likhtik et al., 2014; Stujenske et al., 2014; Taub et al., 2018), we hypothesized that the PL modulates BLA SOM IN activity during retrieval.
We first verified that the PL is necessary for discrimination. Mice trained on DFC (n = 10) were infused in the PL with saline or the GABA-A receptor agonist muscimol on two days of retrieval (counterbalanced). Muscimol, but not saline, led to dramatic fear generalization to the CS−, without an effect on CS+ freezing (Figures 3A and 3B).
Figure 3. BLA SOM activity during the CS− depends on the prelimbic cortex (see Table S3 for statistics).
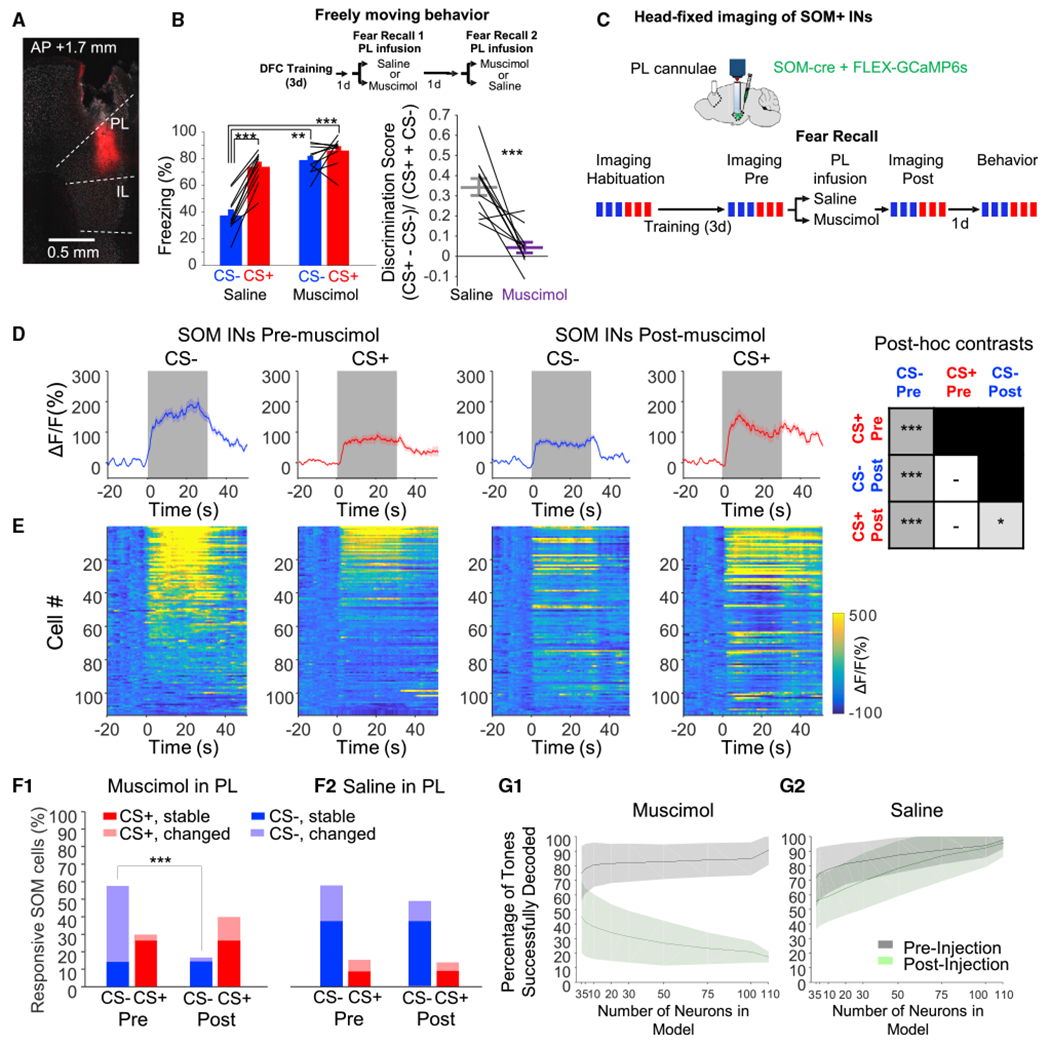
(A) Histology of Dil infusion through cannulae in the PL.
(B) Top, saline or muscimol was infused into the PL on subsequent retrieval days (order randomized between mice). Bottom, freezing and discrimination during both days.
(C) Experimental design for PL silencing during imaging of SOM INs. These mice are a subset of the mice shown in Figure 1.
(D) Average CS− evoked calcium signals across all cells in mice infused with muscimol in the PL (n = 117 cells from n = 3 mice) pre- and post-infusion. Box summarizes post hoc comparisons (*p < 0.05; **p < 0.01; ***p < 0.001; also see Figure S3).
(E) Heat map of individual cell responses, corresponding to (D), sorted by the average stimulus-evoked response (across all conditions).
(F) Percent of cells significantly upregulated during CSs pre- and post-muscimol (F1, n = 117 cells, n = 3 mice) or saline (F2, n = 127 cells, n = 3 mice). Some cells were active to a CS both pre- and post-infusion (“stable”) or only in one imaging epoch (“changed”).
(G) Accuracy decoding tone identity by SVMs trained on pre-infusion data, pre- (gray) and post- (green) muscimol (G1), or saline (G2). Plotted as mean ± 95% CI for models of different subsample sizes.
In the same mice as in Figure 1, we imaged SOM INs during DFC retrieval before and after muscimol or saline infusion in the PL (Figure 3C). PL silencing selectively impaired activation of BLA SOM INs during the CS− in all mice (Figures 3D, 3E, and S3, n = 117 neurons from n = 3 mice), whereas saline had no effect (Figure S3, n = 127 cells from n = 3 mice). Again, PL silencing did not significantly alter SOM IN CS+ responses (Figures 3D, 3E, and S3). The CS− activated 58% of SOM INs pre-muscimol but only 19% post-muscimol (Figures 3F1 and S3), whereas saline had no effect (Figure 3F2). An SVM classifier confirmed that cue encoding was stable post-saline but changed dramatically post-muscimol (Figure 3G).
Using rabies tracing, we confirmed that at least one pathway coordinating SOM IN activity consists of monosynaptic connections from mPFC (Figure S3E).
PL inputs to the BLA drive CS− discrimination
To investigate the functional relevance of the mPFC-driven activity in the BLA, we utilized 129S6/SvEvTac mice, which are pre-disposed to fear generalization (Figure 4A). These mice exhibit a bimodal distribution in their ability to discriminate, and they were classified as discriminators or generalizers (Figure 4B; see STAR Methods). Generalizing mice exhibit impaired safety-related directional mPFC (PL and IL)-to-BLA synchrony and inappropriately high theta resetting during safe stimuli (Likhtik et al., 2014) (summarized in Figure 4C).
Figure 4. Silencing mPFC inputs to the BLA permit synchronous cell-firing and theta reset during the CS− (see Table S4 for statistics).
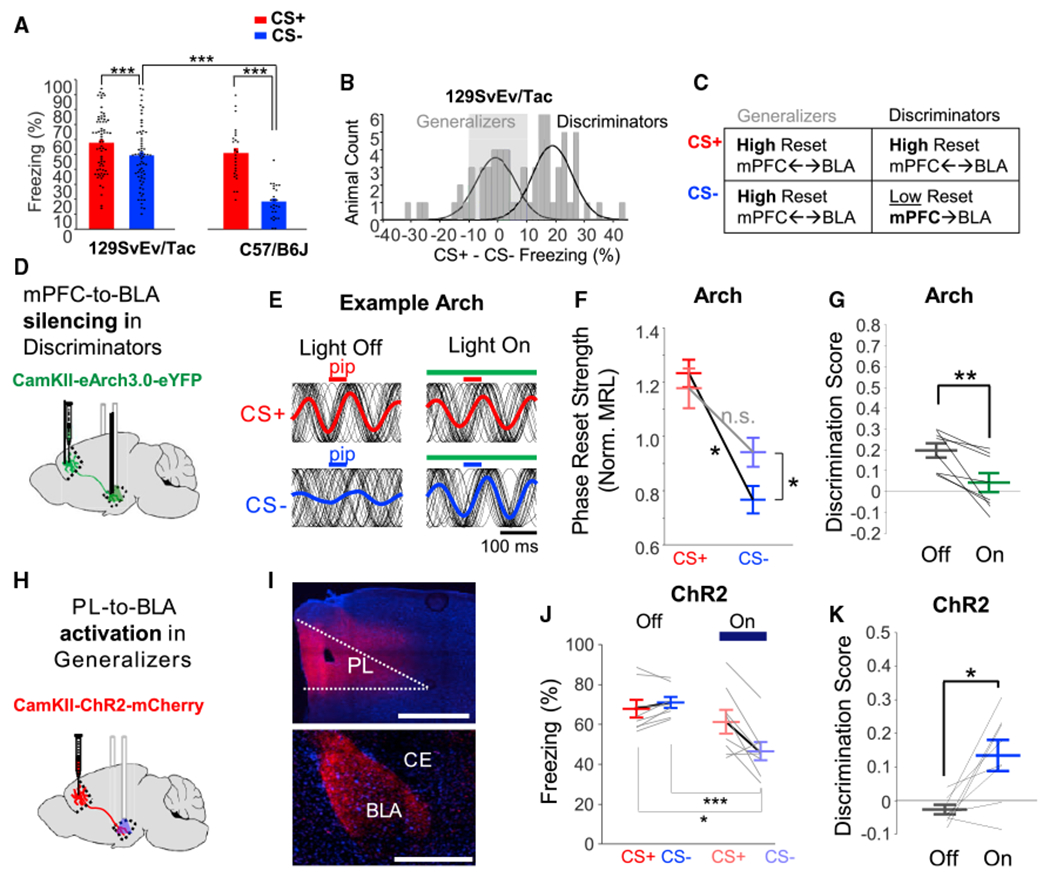
(A) Freezing of 129S6/SvEvTac mice (n = 67) and C57/B6J mice (n = 26) during fear retrieval.
(B) Difference between CS+ and CS− freezing for 129S6/SvEvTac mice exhibits a bimodal distribution.
(C) Summary of previous findings in the 129S6/SvEvTac model of fear generalization (Likhtik et al., 2014).
(D) CamKII-eArch3.0 or CamKII-eYFP was expressed in the mPFC of 129S6 mice; optical fibers and electrodes were implanted in the BLA.
(E) All pip-evoked theta (6–10 Hz) phase-only LFPs (black traces) for CS presentations from an Arch mouse with and without light.
(F) Average pip-evoked theta reset in the BLA of Arch mice with and without light in the BLA.
(G) Silencing mPFC-to-BLA terminals significantly decreased discrimination.
(H) Mice were injected with viruses expressing CamKII-ChR2 or CamKII-mCherry in the PL for activation of terminals in the BLA.
(I) Expression of ChR2 virus in PL bodies (top) and BLA terminals (bottom). Scale bars, 500 μm.
(J) Stimulating PL inputs to the BLA in ChR2-expressing generalizers decreased CS− evoked freezing.
(K) Activating PL-to-BLA terminals significantly increased discrimination.
*p < 0.05, **p < 0.01, ***p < 0.001. Unless specified, data plotted as mean ± SEM.
To confirm that mPFC input to the BLA was necessary for discrimination, we expressed the inhibitory opsin eArch3.0 or eYFP in the mPFC and placed optic fibers with microelectrodes in the BLA (Figure 4D). In mice that discriminated the two stimuli well during light-off trials, there was a lower BLA theta reset during the CS− than the CS+ (n = 9 LFPs from n = 7 mice; Figures 4E, 4F, and S4). Inhibition of mPFC input to the BLA resulted in increased theta reset in the BLA, specifically during the CS− (Figures 4E and 4F), mimicking effects of SOM IN silencing (Figure S4). Behaviorally, discrimination was impaired by mPFC terminal silencing (Figure 4G; n = 8 Arch, n = 5 eYFP), although this was not due to a specific effect on the CS− (Figure S4).
Last, we tested whether enhancing PL input to the BLA was sufficient to improve discrimination. We expressed either ChR2 or mCherry in the PL and trained 129S6/SvEvTac mice on DFC (Figure 4H). We then stimulated terminals in the BLA with 6 Flz oscillatory illumination on half of CS+ and CS− cues during retrieval (Figure 4K), simulating endogenous mPFC theta-frequency activity (Likhtik et al., 2014; Stujenske et al., 2014). In ChR2-expressing mice that generalized during light-off trials (n = 8), stimulation of PL terminals in the BLA selectively decreased CS− freezing, resulting in a significant increase in the discrimination score (Figures 4I–4K and S4), whereas controls exhibited no change (n = 6).
DISCUSSION
Our data support the view that SOM INs filter the synchronous drive of BLA pyramidal cells (Ito et al., 2020) by virtue of mediating dendritic inhibition at synapses in close proximity to excitatory inputs (Muller et al., 2007). We highlight the active role of the PL in preventing generalized fear via PL inputs to BLA, driving SOM IN-mediated suppression of fear to non-aversive cues (Figure S4I). Whereas previous work has shown the role of the PL in supporting fear expression (Cummings and Clem, 2020; Likhtik et al., 2014; Meyer and Bucci, 2014; Sierra-Mercado et al., 2011; Vieira et al., 2015), here we demonstrate a role for PL fear suppression during discrimination of non-threat, similar to the role of the anterior cingulate in non-human primates during reversal learning (Klavir et al., 2013).
Nevertheless, PL input to the BLA drives excitation of PN cells via AMPA receptor-mediated currents (Arruda-Carvalho and Clem, 2014; Arruda-Carvalho et al., 2017), supporting fear expression (Arruda-Carvalho and Clem, 2014; Likhtik et al., 2005). Thus, our data suggest that the PL serves opposing functions under different conditions. PL input can mediate direct feed-forward activation of both BLA PNs and INs and makes many indirect connections with both cell types (Likhtik et al., 2005; Marek et al., 2018; Rosenkranz and Grace, 2001). In vitro, inhibiting BLA SOM IN creates windows for enhanced plasticity of PL-to-BLA excitatory input (Ito et al., 2020). Thus, PL- dependent SOM IN activation may serve an autoregulatory function. It is likely that mPFC-dependent activation of BLA SOM INs is a critical circuit motif regulating opposing changes in defensive behavior.
BLA PV INs engage in upregulation and downregulation of fear during acquisition and extinction, respectively (Davis et al., 2017; Trouche et al., 2013; Wolff et al., 2014). Interestingly, we show that during retrieval, CS+ and CS− both activate putative BLA PV but only the CS+ induces time-locked theta-frequency firing (Figures 2K and 2M), consistent with their known role in CS+ processing. This suggests a complex, timing-dependent role for BLA PV INs in CS processing, which could explain why constant optogenetic inhibition of these cells did not affect discrimination. Given their known connectivity (Wolff et al., 2014), PV IN silencing would also likely disinhibit SOM INs, potentially masking their role in controlling PNs.
Disturbance of mPFC-to-BLA functional connectivity, with heightened theta phase resetting to the CS−, is associated with generalization. We demonstrate that the mPFC-to-BLA projection is necessary and sufficient for discrimination. Thus, it is likely that the presence of PL-dependent BLASOM IN activation underlies individual variation in the discrimination of mice. These findings are highly relevant to understanding the circuit basis of overgeneralization in individuals with a variety of psychiatric disorders.
STAR★METHODS
RESOURCE AVAILABILITY
Lead contact
Further information and requests for data or other materials should be directed to the lead contact, Ekaterina Likhtik (elikhtik@genectr.hunter.cuny.edu).
Materials availability
The study did not generate any unique reagents.
Data and code availability
All data reported in this paper will be shared by the lead contact upon request.
Original code utilized in this paper has been deposited at Zenodo and github and is publicly available as of the date of publication (see the key resources table).
Any additional information required to reanalyze the data reported in this paper is available from the lead contact upon request.
Key resources table
| REAGENT or RESOURCE | SOURCE | IDENTIFIER |
|---|---|---|
| Antibodies | ||
| Anti-c-fos (rabbit) | Abcam | Cat#ab190289; RRID:AB_2737414 |
| Anti-parvalbumin (guinea pig) | Synaptic Systems | Cat#195 004; RRID:AB_2156476 |
| Anti-SOM (goat) | Santa Cruz | Cat#sc-7819; RRID:AB_2302603 |
| Bacterial and virus strains | ||
| AAV5-CamKIIa-hChR2-H134R-mCherry-WPRE-pA | UNC Vector Core | N/A |
| AAV5-CamKIIa-H134R-mCherry-WPRE-pA | UNC Vector Core | N/A |
| AAV5-CamKIIa-eArchaerhodopsin-eYFP | UNC Vector Core | N/A |
| AAV5-CamKIIa-eYFP | UNC Vector Core | N/A |
| AAV5-Ef1a-DIO-eArch3.0-eYFP | UNC Vector Core | N/A |
| AAV5-Ef1a-DIO-eYFP | UNC Vector Core | N/A |
| AAV5-hsyn-FLEX-GCaMP6s | Penn Vector Core, Addgene | Cat#(Addgene):100845-AAV5; Plasmid RRID:Addgene_100845 |
| AAV1-Ef1a-FLEX-H2B-GFP-P2A-N2c[G] | Laboratory of Attila Losonczy, Reardon et al., 2016 | Plasmid RRID:Addgene_73476 |
| AAV1-FLEX-TVA-mCherry | Laboratory of Attila Losonczy, Reardon et al., 2016 | Plasmid RRID:Addgene_38044 |
| RabV CVS-N2cΔG-dsRed[EnvA] | Laboratory of Attila Losonczy, Reardon et al., 2016 | Plasmid RRID:Addgene_73460 |
| Chemicals, peptides, and recombinant proteins | ||
| Muscimol | Tocris | Cat#0289 |
| Experimental models: Organisms/strains | ||
| PV-IRES-cre transgenic mice | Jackson Laboratory | RRID:IMSR_JAX:017320 |
| SOM-IRES-cre transgenic mice | Jackson Laboratory | RRID:IMSR_JAX:018973 |
| Wildtype C57/B6J mice | Jackson Laboratory | RRID:IMSR_JAX:000664 |
| Wildtype 129S6/SvEvTac | Taconic Biosciences | RRID:IMSR_TAC:129sve |
| Software and algorithms | ||
| Kilosort2 | Github, retrieved on Sept 18, 2020 | https://github.com/MouseLand/Kilosort/releases/tag/v2.0 |
| Chronux2.12v03 | http://chronux.org/, retrieved on October 27, 2021 | http://chronux.org/ |
| Circular Statistics Toolbox (Matlab) | Mathworks | https://www.mathworks.com/matlabcentral/fileexchange/10676-circular-statistics-toolbox-directional-statistics |
| B-spline Grid, Image and Point based Registration Toolbox (Matlab) | Mathworks | https://www.mathworks.com/matlabcentral/fileexchange/20057-b-spline-grid-image-and-point-based-registration |
| deconvolution_standalone.m (Matlab) | Github, retrieved on April 26, 2019 | https://github.com/cortex-lab/Suite2P |
| Phy2 | Github, retrieved on Sept 18, 2020 | https://github.com/cortex-lab/phy |
| ImageJ | Research Services Branch, National Institute of Mental Health | https://imagej.nih.gov/ij/ |
| Matlab 2021a | Mathworks | https://www.mathworks.com/products/matlab.html |
| Spectral, single unit, fiber photometry analyses | This paper | DOI: 10.5281/zenodo.6347608 https://github.com/jmstujenske/PL_drives_nonaversion_via_SOM_IN |
| Other | ||
| 532nm DPSS laser (3% power stability) | OEM Laser Systems | GR-532-00100-CWM-SD-03-LED-0 |
| Optical commutator | Doric | FRJ_1x2i_FC-2FC |
| PlexBright Dual LED Commutator | Plexon | COM-Dual LED |
| PlexBright Compact LED Modules (465nm) | Plexon | LED_Blue_Compact_LC_magnetic |
| PlexBright One Channel LED Driver | Plexon | 1ch_LED_Driver |
| Fiber Photometry System | Neurophotometrics | FP3002 |
| Digital Acquisition System | Neuralynx | Digital Lynx 4SX |
| Digital Acquisition System | Blackrock Neurotech | Cerebrus Neural Signal Processor |
| Custom GRIN lens | GrinTech GmBH | NEM-085-50-00-920-S-1.0p |
| Two-photon microscope | Prairie Technologies | Ultima IV Model |
| Tunable mode-locked laser | Coherent | Chameleon Vision model |
| Tungsten Wire with Formvar coating (25 μm) | California Fine Wire | Material #100211, Coating NEMA MW 15, custom order |
| Tungsten Wire with Formvar coating (76.2 μm) | California Fine Wire | Material #100211, Coating NEMA MW 15, custom order |
| Electronic interface boards (8, 16, or 32 channel) | Neuralynx | EIB-8, EIB 16, EIB 32 narrow |
| Electronic interface boards (32 channel) | Gold Phoenix | Custom Design, http://likhtiklab.com/tools |
| Stainless steel binding screws (000-120 thread, 1/16” long) | Antrin Miniature Specialties | Part#B002SG89KW |
EXPERIMENTAL MODEL AND SUBJECT DETAILS
All experiments were performed on three to five-month-old male mice. All mice were C57/B6J mice (The Jackson Laboratory), except for mPFC terminal activation and inactivation experiments, which were in 129S6/SvEvTac (Taconic Biosciences). Wildtype mice were acquired directly from The Jackson Laboratory. PV-IRES-cre
(RRID:IMSR_JAX:017320) and SOM-IRES-cre (RRID:IMSR_JAX:018973) were maintained on a C57/B6J background and mice used for experiments were heterozygous, produced from a homozygous to wildtype cross. C57/B6J mice were group housed throughout all completed experiments. 129S6/SvEvTac were singly housed, with enrichment (nestlets), starting after surgical procedures. Littermates were randomly assigned to experimental and control groups. When group housed, they were maintained in the same cage. Sample sizes reported include only mice with verified, accurate placements and/or viral expression in the relevant brain regions; excluded mice are noted in each applicable section of the methods. All procedures were conducted in accordance with National Institutes of Health regulations and approved by the Columbia University and New York State Psychiatric Institute Institutional Animal Care and Use Committees, the Hunter College Institutional Animal Care and Use Committee, and the Weill Cornell Medical College Institutional Animal Care and Use Committee.
METHOD DETAILS
Differential fear conditioning
Mice were first habituated to handling, optical fiber and/or electronic interface board connection, and, where applicable, fiber optic light illumination in a small rectangular box (30 × 20 cm) in the dark for twenty minutes. 465 nm (activation experiments) or 532 nm (inactivation experiments) light was directed through their fiber optic for two minutes, followed by two minutes of no light, for twenty minutes. 532nm light was generated by DPSS lasers (3% power stability, OEM lasers) and 465nm light was generated by fiber-coupled LED modules (Plexon).
On a subsequent day, mice were habituated in dim light (30 lux) to the fear conditioning chamber (Med Associates, 15.24 × 13.34 × 12.7 cm) with a grid floor of stainless-steel bars for shock delivery, and exposed to two separate tones: 2kHz and 8 kHz pure tones (5 times each, pseudorandom order, presented as thirty 50 ms pips, amplitude modulated with 25ms linear increase followed by 25ms linear decrease, once per second). Mice were then trained as previously described (Likhtik et al., 2014; Stujenske et al., 2014) over the next three days to associate one tone (CS+) with a co-terminating shock (0.4 mA, 1s), whereas the other tone (CS−) was explicitly unpaired.
This shock intensity was specifically chosen to avoid ceiling effects in evaluation of freezing to the CS+ and CS−. We also tested 0.6 mA and 0.9 mA shock intensities, which induced CS+ freezing of approximately 90%. Thus, we utilized a higher shock intensity for our c-fos experiments to assure a robust response in our mice (see below), as a ceiling effect was not a problem in that experiment. CS identity was counterbalanced between mice, with variable inter-trial-intervals (ITI) of 60,80,100, 120 seconds.
On the fourth day, mice that would receive optogenetic manipulation were again habituated to optogenetic light by five 30 second light exposures, alternating with 30 seconds of no light. The mice were then placed in a new context (a wooden enclosure, 60 Lux) for testing how well they had learned the differential associations with the two stimuli. They were habituated to the new chamber for 3 minutes prior to the first tone presentation.
Stereotactic viral injections
Mice were anesthetized with isoflurane (0.5–1.5%) and head-fixed in a surgical stereotactic apparatus (Kopf). Viral injections were made with a pressure injector (Quintessential Stereotactic Injector, Stoetling) connected to a 10 μL Hamilton Syringe terminating in a glass pipette with fine tapered end (~30 gauge). Temperature was monitored and maintained at 36.6°C with a feedback-regulated heating pad. The skull was leveled using bregma and lambda landmarks and craniotomies were made using anterior-posterior (AP) coordinates from bregma, medo-lateral (ML) coordinates from the midline and dorso-ventral coordinates (DV) from brain surface.
For PL terminal excitation experiments, 3-4 month-old 129S6/SvEvTac mice were injected with 150 nL of adeno-associated virus (AAV) expressing either channelrhodopsin (AAV5-CamKIIa-hChR2-H134R-mCherry-WPRE-pA) or a control virus (AAV5-CamKIIa-H134R-mCherry-WPRE-pA; UNC Vector Core) at two locations bilaterally to drive expression in the PL: ML ±0.3mm; AP +1.75mm; DV −1.1 and −1.2 mm (relative to brain surface). All injections were made by first lowering to 0.05 mm deeper than the intended target, and then raising the needle to create a “pocket,” minimizing backflow up the pipette. The mice were then implanted with bilateral ferrule-coupled fiber optic implants (200 μm core, 0.39 NA) above the amygdala basal nuclei (ML: +/−3.5, AP: −1.6, DV: −3.8). To allow for viral expression at the PL axon terminals in the BLA, behavioral testing was performed 6-7 weeks after the initial viral injection. Mice in this experiment were all singly housed, with bedding for enrichment, to be consistent with our previous behavioral approach (Likhtik et al., 2014), yielding discriminating and generalizing mice. For mPFC terminal inactivation experiments, the preparation was the same, except 500 nL of either AAV5-CamKIIa-eArchaerhodopsin-eYFP or control virus (AAV5-CamKIIa-eYFP; UNC Vector Core) was injected at each ML ±0.3mm; AP +1.75mm; DV −1.6 and −2.0 mm (relative to brain surface). Behavioral testing was performed 12 weeks after the viral injection.
For silencing genetically defined interneuron populations, 3-5 month old male C57/B6 mice expressing cre-recombinase in either SOM+ cells (SOM-IRES-cre) (Taniguchi et al., 2011) or PV+ cells (PV-IRES-cre) (Hippenmeyer et al., 2005) were utilized. Mice were stereotactically injected in the BLA (ML 3.3, AP −1.7, DV, 4.3) with 0.5 mL of an AAV that expressed the gene for Arch in a cre-dependent manner (AAV5-Ef1a-DIO-eArch3.0-eYFP) or a control virus (AAV5-Ef1a-DIO-eYFP; UNC Vector Core). Mice were group housed, with cagemates divided equally into Arch and control groups. During the same surgery, bilateral ferrule-coupled fiber optic implants (200 umcore, 0.39 NA) were inserted over the basolateral nuclei (ML +/−3.3, AP −1.7, DV −3.9). A subset of mice had tungsten electrodes affixed to the fiber optic directed to the BLA (electrode tip at DV 4.3) and electrodes implanted in the PL (ML −0.3 mm; AP +1.8 mm; DV −1.6). Behavioral testing began 4 weeks post-surgery to allow for expression of virally-delivered proteins.
For imaging SOM+ interneurons in the basolateral nuclei, a midline incision was made in the scalp, and 1 μL of AAV5-hsyn-FLEX-GCaMP6s (Penn Vector Core, Addgene) was injected unilaterally in the left BLA (ML: −3.3, AP: −1.55, DV: −4.9 to −4.5) of SOM-cre mice. This volume of injection was used to assure robust expression and spread, and as a result, expression in the central amygdala could not be avoided and was tolerated as these cells were far from the subsequent field of imaging. The midline incision was subsequently closed with VetBond Adhesive (3M). For fiber photometry recordings, 500 nL of AAV2/5-hsyn-FLEX-GCaMP6s (Addgene) was injected into the left BLA(ML: 3.3, AP: −1.55, DV: −4.7) of SOM-cre or PV-cre mice, and they were implanted with a unilateral optic fiber (400 um core, 0.37 NA) at the same coordinate.
Note that there are differences in the PL and BLA coordinates between 129S6/SvEvTac and C57/B6 background mice due to slight anatomical differences. In all cases, the experimenters were blinded to viral identity at the time of viral injection (when relevant), and to mouse identity until after the experiments were complete. For mice with optical fibers, surgical screws were placed in the bone over the frontal cortex and cerebellum as anchors for implanted components, and the skull was covered with dental cement (Dentsply or Parkell). Perioperatively, mice were given analgesics (Carpofen, 5 mg/kg, s.c. or Meloxicam 2 mg/kg, s.c.) and monitored for comfort and weight gain.
Fiber photometry recordings
Fluorescence signals were recorded using the Neurophotometrics FP3002, which uses a high-resolution camera (FLIR) to capture fluorescence signal exiting the tip an optic fiber. Data acquisition consisted of alternating pulses of fiber-coupled ultraviolet (405 nm) and blue (470 nm) LEDs, acquired at an effective rate of 20 Hz for each channel, capturing an isosbestic (control) trace and a calcium-dependent trace. The calcium-dependent trace was corrected by the control channel as follows (function detrend_photometry.m). The isosbestic channel was fit with the sum of two exponentials to capture signal decay due to bleaching (Matlab curve fitting toolbox), yielding its overall trend and a detrended isosbestic trace. We then determined the best linear fit of the isosbestic trend to a running baseline of the calcium-dependent trace (determined by applying a median filter of length 5s followed by a minmax filter of 100s width). Light artifacts were removed by subtracting a zero-meaned and rescaled isosbestic trace. The corrected signal was then detrended by dividing by the isosbestic trend and multiplying by the trend’s initial value. We confirmed that light artifacts were small relative to the true signal and that similar results were obtained if the isosbestic trace was not utilized.
2-3 weeks after viral injection and fiber optic implantation, mice were connected to the recording equipment to confirm presence of fluorescence signals. Two SOM-cre mice were excluded from this experiment, one because of lack of signal and the other because of incorrect fiber placement. No PV-cre mice were excluded. Two wildtype mice were injected with the same cre-dependent virus to confirm that there was a lack of fluorescence signal in the absence of the calcium indicator.
After confirming expression, mice were habituated to the tones and trained on three days of DFC, as described above, with a few changes. The mice were fear conditioned in a rat-size chamber (Med Associates, 29.53 × 24.84 × 18.67 cm), with one wall transparent for camera recording of the mouse behavior. The chamber was within an enclosure covered on all walls with gray sound-dampening material, with the exception of a small hole where the camera was placed and a hole in the ceiling, around which a white LED ring was placed for illumination and through which the optic fiber was able to pass. Retrieval was performed in the same chamber, except the grid floor was covered with a white plastic sheet, a curved white insert was placed in the back of the chamber to change the context, and a black and white checkerboard pattern was placed on the wall of the enclosure visible to the mouse. Mice were re-exposed to the tones in the absence of any shock, while the fiber photometry signal was captured. The fiber photometry signal was then analyzed by calculating the percentage change for the signal during each 30-second tone relative to the preceding 30-seconds and averaging over 3 repetitions (which we called ΔF/F). For plotting, the traces were smoothed with a boxcar filter (width of 2s).
2-photon Imaging
One week after viral injections, mice were anesthetized with isoflurane, and a 0.85mm microendoscope probe (Grintech GmBH) was stereotactically implanted in the BLA positioned at the same coordinates as the BLA injection. Brain tissue was aspirated to a depth of ~2mm below skull surface to reduce intracranial pressure from the implant. We lowered the implant to above the amygdala basal nuceli (DV −4.75 mm, relative to skull surface at bregma) and fixed it in place using a small amount of VetBond adhesive (3M) followed by a layer of dental cement (Dentsply). A custom designed metal head post was attached with dental cement caudal to the microendoscope to be used for head fixation during imaging. 26-gauge dual barrel cannulae (PlasticsOne) were also implanted over the PL (AP: +1.65 ML: ±0.3 DV:−1.1, allowing for infusion at DV −1.6 after insertion of longer internal syringe) for bilateral drug delivery. The cannulae were secured to the skull using dental cement and small screws for stability. We then applied Kwik-cast (World Precision Instruments) to the GRIN lens to protect it from damage between imaging sessions. Mice recovered for two weeks and were habituated to the recording context and head fixation. After habituation we checked the level of GCaMP6s expression using the two-photon microscope. If expression was sufficiently bright we commenced experiments. All images were acquired using a multi-photon microscopy system (Prairie Technologies) with a 10x objective (0.3 NA, Nikon) and an ultra-fast pulsed laser beam (920-nm wavelength, Coherent). We continuously acquired GCaMP fluorescence with a photomultiplier tube (GaAsP PMT) operated by PrairieView software. Mice were habituated to the optical instrumentation for five days. In the first two days, mice were allowed to walk freely on a Styrofoam ball. On subsequent days, mice were securely head fixed on the ball setup with a pair of clamps designed to match the implanted metal head post. Each mouse received two imaging sessions, one prior to fear conditioning (Habituation) and one the day following three days of discriminative fear conditioning (Retrieval). Fear discrimination training occurred as in other experiments. On each day, about 1 hour after fear conditioning, mice also received a head-fixed habituation session on the Styrofoam ball for 15 minutes.
During habituation and testing imaging sessions, mice were head fixed and time series were collected at 128 × 256 pixels covering a 500 × 500um field of view, cropped to include only areas with active cells, yielding a recording rate between 6.8 and 8.8 Hz. Calcium imaging data was synchronized with tone presentation using an Arduino and custom-written Python software. Three CS− tones were followed by three CS+ tones, with variable inter-trial-intervals (ITIs) of 90, 110, 130, or 150 seconds. Then either muscimol or saline was infused bilaterally into the PL(1 μgm/μl, 0.5 μl per hemisphere, infused at a rate of 0.1 μl/min). Twenty minutes later, the mice were retested on another set of three CS− and CS+ trials (same variable ITI schedule). Movements of the styrofoam ball were simultaneously recorded with a rotary encoder (US Digital MA3-A10-125-B), which was sensitive enough to detect movements smaller than a single step of a mouse. The starts of bouts of movement were marked by deflections of the ball on the rotary encoder and stops were marked when no deflections were detected for at least 1 second. The amount of movement was calculated as the sum of the lengths of all movement bouts.
The day after the final imaging session, mice were placed in a behavioral chamber for retrieval in a freely moving condition (retrieval occurred in a different context from acquisition; for half the mice this was a wooden enclosure, for the other half this was a plastic enclosure of the same dimensions). Mice were habituated to the chamber for three minutes and then presented with three CS− tones and three CS+ tones, as during imaging. Subsequently, mice were infused with DiI in the PL to determine the affected area of infusion. Twenty minutes later, mice were deeply anesthetized and perfused to determine cannula and GRIN lens placement as well as level of viral expression. 1 mouse was included in habituation-recall analysis (Figure 1) but not in the infusion experiment due to localization of infusion cannulae over the IL, rather than the PL. Three mice were excluded from analysis due to GRIN lens misplacement (two placements over the lateral nuclei, one placement in endopiriform cortex). Two mice were excluded due to lack of GCaMP signal.
Calcium imaging time-series were motion corrected using a planar hidden Markov model (SIMA) (Kaifosh et al., 2014) and in the event of poor performance of SIMA, NoRMCorre (Pnevmatikakis and Giovannucci, 2017) was used as backup. Regions of interest (ROIs) were manually drawn over motion corrected time-series in ImageJ (NIH) with the aid of maximum, average, and standard deviation projections, as well as the full image stack. Data were then imported to MATLAB for further analysis. All calcium signals were investigated for the presence of calcium transients, and any signals without transients in any time epoch were excluded. First, calcium signals were denoised using an L0-constrained non-negative deconvolution with 1.8 second time constant implemented using deconvolution_standalone.m in the Suite2p analysis package (Pachitariu M., 2017) to reduce variability between mice prior to combining data, though findings were similar without denoising. To standardize across mice for the purpose of analyses at different time points, data was interpolated to generate a 10Hz signal using nearest neighbor interpolation (the main results were tested and confirmed without interpolation). While mice did not move for a majority of the time on testing day, there were occasionally sustained bouts of running, which induced substantial variability in the SOM IN activity, likely due to a relationship between their activity and movement. As we were specifically interested in the activity of these interneurons as they related to stimulus processing rather than movement, any tones in which mice exhibited more than 2 seconds of movement were excluded (with this criterion, this amounted to at most 1 of each tone excluded per mouse per recording session). Tone-evoked intracellular calcium signals were normalized to the pre-tone calcium signal by subtracting the average pre-tone calcium signal in the preceding 15 seconds and dividing by the average activity in the preceding 50 seconds of each tone presentation (to get a more robust baseline and account for any time-variant changes in fluorescence over the long recording session), excluding any periods of movement, leading to a ΔF/F output. Tone-evoked responses were quantified as the average area under the curve of each recorded cell for the 30s that the tone was on.
Acquired data from habituation and recall sessions were aligned using non-rigid image registration (Matlab function, image_registration, from publicly available matlab suite “B-spline Grid, Image and Point based Registration”). Some cells were only recorded during habituation or recall, while the majority (66%) of cells were detected on both days. Rather than excluding from analysis any cells that were not recorded on both days, we accounted for a mixture of paired and unpaired data in the construction of our rm-ANOVA test and post-hoc testing when analyzing changes from habituation to fear recall. The main results were confirmed by analyzing the subset of cells that were present on both days, with the same pattern of changes to the CS+ and CS− following fear conditioning.
For the majority of analyses presented in the main figures, cells were combined together across mice, but we separately confirmed that the main effects were reproduced in each individual mouse by analyzing each population of recorded cells separately (Figures 1H–1M and S1).
Analysis of significant tone responses
To determine which cells were significantly responsive to the CS− and CS+, a shift predictor was generated by repeating the same procedure for generating ΔF/F values, but using only time periods in which no tones were being presented and randomly defining three time points as tone onsets, defining the subsequent 30s as a pseudo-tone presentation and the prior 50s as a pseudo-pretone for normalization. The three results were averaged. This was repeated 2000 times to generate an expected distribution for every time point before and after tone onset. This method was chosen rather than a z-score approach, as the use of a defined period for ΔF/F normalization introduced a slight bias for the value to increase as time moves away for the zeroing period (into either the past or future), which was accounted for by this randomization procedure.
ΔF/F responses to the CS+ and CS− were averaged across tones for the 30s of tone presentation and compared to the distribution generated by averaging the 2000 iterations of the shift predictor. A cell was defined as significantly increased during a tone if its ΔF/F value exceeded the 97.5th percentile of the shift predictor or significantly decreased during a tone if the value was below the 2.5th percentile. As the percentage of cells with a significant decrease was at chance (Figures 1L and 1M), the possibility of inactivation responses to the tone was subsequently excluded and we focused exclusively on activated cells. To the contrary, during fear conditioning, it was previously found that BLA SOM IN predominantly exhibit a small decrease in FR in response to CSs when recorded electrophysiologically (Wolff et al., 2014). Consistent with this, we did see a trend for such an effect in our fiber photometry data, which is pooled data across many cells, though it was highly variable between mice. Our calcium imaging technique is likely more reliable at detecting cells with increased activity, as GCaMP6 indicators have been previously demonstrated to be unreliable at detecting drops in FR (Hara-Kuge et al., 2018), particularly in cells with low baseline firing and subtle drops in FR (Ali and Kwan, 2020). The ~20% of SOM IN that we found to be significantly activated to the CS+ (Figure 1m) is similar to the ~15% of cells that were found to be activated by CSs during fear conditioning electrophysiologically (Wolff et al., 2014).
For the analysis of significance at each time point (Figure 1L), a cell was considered significantly activated by a tone for each time point if its value at a time point exceeded the 97.5th percentile of the shift predictor distribution for that time point. This same procedure was used to evaluate when a unit was significantly more active to the CS+ vs the CS−, except that in the absence of enough CS data to generate a full distribution, we used the shift predictor 95% confidence interval as a proxy for the expected spread of data. A unit was considered to be significantly more active to the CS+ compared to the CS−, or vice versa, at a time point (or for the average of the 30s of tone presentation) if their values differed by greater than the 95% confidence interval of the shift predictor.
Investigating patterns of SOM IN responses
To investigate the diversity of patterns of SOM IN response to tone presentation, we utilized a principal component decomposition of the tone-evoked response (Figure S1). PCA1 accounted for the great majority of the variance of the response to the CS− and to a lesser extent for the CS+, owing to the fact that CS+ evoked responses were weaker. PCA of only units with significant responses to the CS+ yielded similar results as for the CS−. The first PCA component was highly correlated with the average DF/F tone responses, so we investigated whether other PCA components may be more revealing of diverse SOM responses. In investigating PCA2-5 (each of which accounted for >1% of the variance, at least for the CS−), we found patterns of activity that reflected some diversity at the level of individual cells. We saw that the PCA2 component looked like a faster latency response, so we reasoned that this may be a reasonable proxy for response latency. We thereby classified cells as type 1 if they had a negative PCA2 component (i.e., they looked dissimilar to PCA2) or as type 2 if they had a positive PCA2 component. We investigated the latency of response in type 1 and type 2 cells by using the time at which 95% of the maximum ΔF/F value was reached. Our findings indicated that overall, despite some minor heterogeneity, there was a largely homogenous response of SOM BLA cells to the CS+ and CS−, and for this reason, we treated the cells as a roughly homogenous population for our analysis rather than investigating differential responses in different cell populations.
Tone identity decoding by SOM+ interneurons
Tone-evoked calcium signals from all cells in each group of mice was calculated, as described. For most analyses, cells from the mice were combined into one cell population, but the decoding properties of cells from individual mice was also performed to confirm consistent results (Figure S1). Tone-evoked calcium responses were divided into 30 one second blocks, providing for 60-90 data points per tone per cell (depending on whether tones were excluded due to movement in an individual mouse). We iteratively subsampled our population of cells 1000 times for each of a variety of cell population size (2-150 cells). A support vector machine (Matlab function, fitcsvm) was trained for binary classification of CS+ vs CS− on a subset of the data from standardized inputs (centered and divided by standard deviation for each cell) with uniform prior (indicating equal likelihood of CS+ or CS−) and linear kernel function and then tested on the left-out data (Matlab function, predict). For the n=1 datapoint, we established the binary threshold that best separated an individual cell’s response to the CS+ and CS− on training data and used that to classify test data.
For investigating the coding properties of cells in the recall session before any infusion, all 30 one second samples from an individual tone were left out at a time, while the SVM was trained on the samples from remaining tones for each subsampled population. The accuracy of the decoding of each CS across the entire 30s, for each iteration, was calculated as the average number of correctly identified tones (defined as >50% of the 30 samples being defined correctly as CS+ or CS−; Figure S1). Alternatively, for the analysis of decoding accuracy over time, the accuracy of the decoding at each time point after tone onset (Figure 1N) was merely calculated as the percentage of tones correctly identified for that individual time sample. For both analyses, results were then averaged across all 1000 subsamples at each population size and presented as the mean and 95% confidence interval (calculated by the lower 2.5th and upper 2.5th percentile). For the time analysis, a shuffle was generated by repeating the above procedure but randomly labeling tones as CS+ and CS− in five unique simulations (none of which were the two permutations which would correspond to the correct binary classification).
For investigating the change in coding properties of cells before and after saline or muscimol infusion (Figure 3G), the SVM was trained on the samples from all tones before infusion and then tested on samples from each tone before and after infusion. Accuracy of decoding was defined separately for the before and after infusion sessions, as above. This approach likely over-estimates the decoding reliability of session 1, given that no session 1 data was excluded, but the decoding reliability within this session was already separately analyzed with cross-validation (see above; Figure S1), and this analysis was interrogating session 1 to session 2 changes between saline and muscimol mice, rather than determining the unbiased session 1 decoding accuracy.
Fear discrimination training and optogenetics
All optogenetic manipulations were performed only during fear retrieval in the absence of shock. For IN silencing experiments, C57B6 mice were exposed to six CS+ and six CS− tones (pseudorandom order), half with 532 nm (10 mW) optical illumination of the BLA and half with no illumination (n=3 trials each). For PFC and PL terminal inhibition and activation experiments, the structure was the same except, 129S6/SvEvTac mice were used and exposed to ten CS+ and ten CS− tones, half paired with 465nm (4-5mW, for ChR2) or 532nm (10mW, for Arch) illumination of the BLA (n=5 trials each).
All SOM-cre and PV-cre mice included for optogenetic experiments had expression in the basolateral amygdala, with a fiber optic placed over the BLA, and no expression of opsins in the central amygdala, which has a strong SOM presence (Li et al., 2013). One SOM-cre mouse was excluded from behavioral analysis due to beingageneralizer (CS+, CS− difference < 10%) prior to manipulation. All mice utilized for PFC terminal manipulation experiments exhibited expression within the injected part of the prefrontal cortex, had visualizable prefrontal terminal fields in the BLA, and had fiber optics placed over the BLA. Two mice were excluded due to lack of expression or incorrect fiber optic placements.
For the PL terminal activation experiments, we were interested in identifying a cohort of fear generalizing mice, and we therefore used 129S6/SvEvTac mice, a group that has a higher proportion of generalizers, instead of C57B6 mice, which has a higher proportion of discriminators (see Animals [above], Defining Generalization… [below], Figure 4A), due to the overall larger proportion of these mice that generalizer fear. We have previously found that on average, 129S6/SvEvTac mice extinguish fear to the CS+ and CS− slower than C57B6 mice, and therefore to decrease statistical variability from mouse to mouse, more CS+ (5 Light on and 5 Light Off), and CS− (5 Light On and 5 Light Off) presentations were used in the terminal manipulation experiments. For the experiments where we tested the role of BLA SOM or PVIN in discrimination retrieval, we used C57B6 mice, which extinguish faster, and thus we used fewer CS+ (3 Light on and 3 Light Off), and CS− (3 Light On and 3 Light Off) presentations. For Arch terminal inhibition experiments, despite our having run 10 CS+ and 10 CS− trials, we nevertheless only used the first 3 of each to calculate discrimination changes between Light On and Light Off trials, making them equivalent with the discrimination changes that we calculated in Figure 2 for the C57B6 mice. This is done for two reasons. First, we wanted to compare the same number of inactivation trials between mouse strains. Second, the mPFC terminal inactivation experiment was performed in Discriminators, which we found to extinguish faster as a group than when we average all the SvEv129s together, because generalizing mice extinguish slower. Thus, behaviorally, during tones 13-20, mice were no longer reacting differently to the CS+ and CS−, which was the difference that we intended to manipulate.
In the terminal activation experiments in generalizing mice (Figures 4H–4K), we used all 5 trials of each type to calculate discrimination Light On vs Light Off as mice continued to freeze and generalize throughout. In all experiments, illumination turned on five seconds before tone presentation, continued for the entire 30 sec tone presentation period, and turned off five seconds after the tone ended. This was done so as to prevent light artifact at the onset of tones, and prevent any effects from possible rebound excitation at light offset, rather than the end of the CS. Any light-induced changes were controlled for by light-only controls.
During input excitation experiments, the 465nm light was presented as a 6Hz sine wave,delivered by one PlexBright Compact LED Module per side (Plexon), mounted on a Plexon magnetic commutator, and controlled using a PlexBright LD-1 Single Channel LED driver. For inhibition experiments, 532nm coherent light was generated continuously by a laser (OEM lasers, 3% power stability) and divided bilaterally using a Doric optical commutator (FRJ_1x2i_FC-2FC). All light was delivered through 200 μm diameter patch cords terminated in ceramic ferrules (Thorlabs). The ITIs remained the same during retrieval as during training.
With our electrophysiological recording technique, we found that the sinusoidal fiber optic illumination induced a larger artifact in our LFP, even in non-opsin expressing mice, that prevented proper data collection. For this reason, electrophysiology was not performed during this experiment.
For behavioral analysis, freezing to the two tones was quantified offline by an observer blinded to the identity of the tones and the mice. Freezing was also quantified for the 30 seconds prior to each tone onset and averaged to calculate ITI freezing. Mice were considered to be freezing at times when there was complete immobility with the exception of breathing or a periodic, stereotyped shuttering movement (time-locked to the pips). We defined a priori that we would investigate the freezing of mice to the CS+ and CS−, with and without light, as well as discrimination between CS+ and CS−. To control for multiple comparisons, we first used repeated measure ANOVA to analyze the effect of CS (CS+ vs CS−), light (on vs off), and CS x light interaction for each experimental group. If a significant effect was found for CS x light interaction, we used Bonferroni-corrected paired t-tests for post-hoc testing for all four conditions.
Defining generalization in 129S6/SvEvTac mice
Mice were defined as generalizers if the absolute difference in freezing between CS+ and CS− was within ±10%, as in our previous studies (Likhtik et al., 2014; Stujenske et al., 2014). We also quantified the discrimination strength of each mouse by the discrimination score (Figures 4C and S2A4). For the input activation experiments, we used only mice that were deemed generalizers on the Light Off trials, in order to test whether we can improve their discrimination. The proportion of generalizer mice were not significantly different between the two groups (mCherry, 6 of 14 total mice (42.9%), ChR2, 8 of 15 total mice were generalizers (53.3%), z-score of proportions = −0.56, p=0.58).
To confirm the reliability of our previously defined generalization threshold in 129S6/SvEvTac mice, we fit a bimodal Gaussian distribution to the combined behavioral data based on least squares minimization (Matlab function fit, simulated using multiple random starting points to find best fit), assuming the same standard deviation for both generalizer and discriminator distributions and different means, allowing for different numbers of mice in each distribution. For the purpose of defining these distributions most robustly, data from mice implanted with microdrives but not injected with virus was combined with data from mice that received microdrives and viral injections. Based on best fit Gaussians, 129S6/SvEvTac mice that generalized were defined with 91% sensitivity and 95% specificity based on our previously established cutoff. The possibility of incorrect classification was accounted for by using control groups for all experiments. We confirmed that when we attempted to fit a bimodal distribution to data from C57B6 mice, the best fit was with a near 0 amplitude for one of the two Gaussian distributions, supporting the existence of a unimodal distribution in this data set, which shows higher discrimination for the C57B6 population of mice (Figure 4A).
Microdrive construction and implantation
Custom microdrives were constructed using interface boards (EIB-8, EIB-16, or EIB-32, Neuralynx, Bozeman, MT), or our custom-designed boards (Likhtik Lab), and implanted under isoflurane anesthesia. Briefly, craniotomies were made over the BLAand PL (coordinates defined above) with subsequent implantation of either 76.2 μm Formvar-coated tungsten electrodes (California Fine Wire, Grover Beach, CA) for LFP recordings or a stereotrode bundle (10-12 per mouse), constructed with 25 μm Formvar-coated tungsten micro wire (California Fine Wire, Grover Beach, CA), fastened to a cannula attached to the interface board. As explained above, electrodes directed to the BLA were affixed to fiber optics with super glue, with approximately 400μm distance between the end of the fiber optics and the electrode tips. In 129S6/SvEvTac mice, placements were made bilaterally; In C57/B6J mice, they were placed in the left hemisphere only. Surgical screws affixed to bone over the cerebellum and frontal pole, and in contact with cerebrospinal fluid, served as ground and reference, respectively.
Behavior and electrophysiological activity were compared for equal light on and light off periods during fear recall after fear conditioning.
Physiology data acquisition and analysis
LFP signals were recorded using Digital Lynx hardware (Neuralynx) or Cerebrus Neural Signal Processor (Blackrock Neurotech), high-pass filtered (0-1000 Hz), acquired at 2 kHz, and referenced against the frontal screw. Sounds were generated by a PC, and the sound output was split between a speaker and a DC input into the electrophysiology hardware. The time of pip presentations was determined from this digital recording, to account for audio latency. Data was imported into Matlab (Natick, MA) for analysis. Three SOM-cre mice (two eArch, one control) were excluded from LFP analyses due to poor signal quality that prevented analysis, likely due to damage to the board or electrode. No 129S6/SvEvTac mice were excluded from LFP analyses during the mPFC terminal silencing experiment.
Multitaper spectral power was calculated with a 250 ms moving window, 245ms overlap, a time-bandwidth product of 1.5 with 2 tapers, and 2048 FFTs. These parameters were chosen as they allowed for the use of multiple tapers and frequency resolution of +/− 3Hz, allowing the theta band to be distinguished from delta or beta.
The effect of light on pip-evoked power was quantified as the average power in the 6-10 Hz frequency range in the 250ms window, starting at the onset of the pips. This value was normalized for each mouse by dividing by the average power in the 6-10Hz range during the pre-tone period (the aggregate of 30s before each tone, amounting to a total of 360 seconds). For plotting of spectrograms, each frequency band was normalized by its respective pre-tone average, and results were averaged across mice. We found that, as previously shown (reviewed in (Buzsaki and Mizuseki, 2014)), power follows a log normal distribution, and therefore log(power) was used for parametric statistical testing.
To calculate the phase of ongoing theta oscillations, a bandpass filter was applied using a zero-phase-delay FIR filter with Hamming window (filter0, provided by K. Harris and G. Buzsáki, New York University, USA) and the Hilbert transform of the bandpass-filtered signal. Pip-evoked theta band activity was extracted with a 6-10 Hz bandpass. The first pip was excluded from the analysis given that it was the only pip that did not have expected timing for the mice. For SOM-cre mice, the strength of theta phase reset was calculated by quantifying the consistency of phases at each time 1-200 ms post-pip for each of the remaining 87 pips using the mean resultant length (MRL), which is a measure of the degree of unimodality of circularly distributed variables, ranging from 0 to 1. The lower bound of MRL value expected by change is dependent on sample size, and we calculated the MRL value that was expected by chance for 87 samples as .095, which was used for statistical testing of the significance of CS+ and CS− phase resetting. As expected for a bounded variable, we found that MRL exhibited a right-tailed distribution which was approximately normal after log transform, so log(phase consistency) was used for all parametric statistical testing. For 129 mice with virus expressed in mPFC, theta phase reset was calculated the same way as for SOM-cre mice, with two exceptions. First, due to increased variability in the strength of phase resetting in these mice compared to C57s, pips from two further CS presentations of each type were included for the analysis to increase robustness. Second, the phase reset was found to extend for a longer period of time in these mice, so phase consistency was averaged from 0-300 ms. For plotting of the data from 129 mice, the MRL value was normalized by dividing by the average of the CS+ and CS− light off conditions (since the log value was used, this is equivalent to subtracting by the log average), but this did not affect the statistical results of the performed ANOVA, as the repeated measures design is invariant to shifts in the mean across conditions. This normalization was performed for illustrative purposes due to the enhanced variability in the baseline MRL within 129 mice compared to C57 mice.
Phase coherence between PL and BLA was calculated using a multi-taper approach, except equalizing extracted amplitude between the two signals, and calculating the coherence exclusively accounted for by changes in phase (250 ms moving window, 245ms overlap, a time-bandwidth product of 1.5 with 2 tapers, and 2048 FFTs). Interestingly, in contrast to our prior findings of overall coherence, phase coherence was increased in a consistent way that was not time locked to the pip, so average coherence values in the 6-10Hz range were averaged across the entire 30s period of tone presentation. Coherence values were normalized by subtracting average 6-10Hz coherence in the pre-tone period. Normalized coherence was normally distributed.
Prefrontal cortex and basolateral amygdala theta lead probabilities were determined by iteratively performing PL-BLA power-power correlations, as previously described (Adhikari et al., 2010; Likhtik et al., 2014), using the average multitaper spectral power in the 6-10Hz range during tone presentation. This lead analysis consisted in analyzing the cross-correlation between the PL and BLA power in 1 second windows, stepping by 5 ms. The lag at which the cross-correlation was maximized was calculated in each time window, with possible values between −1s and 1s. The majority of time windows were maximized with lag = 0, suggesting no significant lead of either signal, but a substantial number of windows demonstrated either BLA lead or PL lead (negative or positive lag, respectively). PL lead probability was determined as the number of time windows which demonstrated a PL lead divided by the number of time windows with PL or BLA lead. As we expected no significant preponderance of PL or BLA lead during the CS+, while we expected a PL lead preponderance during the CS−, we defined a priori that we would test each distribution of lead probabilities using a one sample t-test vs 50%. As we did not anticipate a consistent change between CS+ and CS− in each mouse given our previous findings (Likhtik et al., 2014; Stujenske et al., 2014), we did not plan between condition testing and therefore did not perform it. As we intended to present the results of each separate t-test as our output statistic, no multiple comparison correction was applied for this analysis.
For single unit recordings in SOM-eArch mice, a bundle of 16 stereotrodes (pairs of tightly-wound microwire), attached to an optic fiber terminating 300 microns above the microwire tips, was implanted in the BLA of 7 SOM-cre mice along with viral injection (as above). 2 mice were excluded from analysis due to poor signal quality that prevented further analysis. Unfiltered activity was acquired at 30 kHz with Blackrock hardware and post-processed using Kilosort2 with bandpass filtering between 300 and 6000 Hz and then manually curated using Phy2 (see Key Resources). Given that the same units can be seen across some stereotrodes, data was clustered by inputting stereotrode wires as a linear probe, such that 16 channels were considered per each spike. Wires within a stereotrode were adjacent, but otherwise ordering was random. All 32 wires could not be considered simultaneously due to a lack of support for this functionality by Kilosort2. Noise artifacts were identified and removed from clusters by using k-means clustering and visual identification. Only well-isolated single units were utilized.
Cell responses were z-scored using the responses in non-overlapping 100ms bins in the 500ms before pip onset, averaged across pips. We averaged the standard deviation calculated across the four tone conditions (CS+ off, CS− off, CS+ on, CS− on) because we were interested in normalizing the size of responses between units and not within units. This improved interpretability of within-type comparisons, as it assured that differences in z-scored firing between conditions were not simply due to changes in spike variability. All aggregate tone-induced FRs changes reported are the average z-scored FR 0-400ms post-pip onset, relative to either the pre-tone mean (difference calculations reported in the text) or the pre-pip mean (as in Figure 2). For light off vs light on comparisons in the absence of tone, differences were compared between the 25 seconds before light onset and the 5 seconds after.
Putative somatostatin interneurons were identified as cells that exhibited decreases in z-scored FR during light on that were below −2 and had a significantly prolonged latency of spiking on at least half of light presentations. This was determined by calculating the distribution of interspike intervals (ISI) in the intertrial interval and then questioning whether the first spike after light on exhibited an ISI that exceeded the 99th percentile. This second criterion helped to distinguish Arch-expressing SOM IN from cells that were inhibited by the light due to polysynaptic effects.
Putative PV IN were identified by utilizing baseline FR and spike half-width, based on previously published data for optogenetically identified BLA PV IN (Wolff et al., 2014). Spike waveforms were isolated by taking the spike-triggered average recording in each channel, and the waveform from the recording channel with the highest spike amplitude was selected. Half-width was calculated as the width of the spike at half of the spike amplitude.
In comparing our distribution of spike half-width vs FR to that previously reported (Wolff et al., 2014), we found a very similar distribution, with the exception of lacking one cluster of cells: a portion of cells with long spike half-width and high FR, some of which were identified as PV+. Interestingly, we did observe this cluster when we liberalized our single unit criterion to include some multiunits, suggesting that this cluster may be due to multi-units comprised of synchronous cell pairs; alternatively, it is possible that we did not identify this cluster due to differences in how the data was acquired and filtered. Of note, we did observe that our recorded distribution was shifted by approximately 50 μs in half-width, which is likely due to a methodological differences. Our spike waveforms are from a non-filtered recording, as opposed to threshold-crossing spike acquisition which uses bandpass filtering, artificially widening spike shape. To define PV IN, we selected units that either had a half-width <240 μs or <280 μs with a spontaneous FR of >5 Hz.
Putative principal neurons were defined as non-putative SOM IN with a spike half-width >260 μs and spontaneous FR <3 Hz. As previously found using optogenetic cell identification (Wolff et al., 2014) we found that optogenetically identified SOM IN had spontaneous FRs and spike half-widths that were very similar to putative pyramidal cells. SOM IN had a FR of 1.35 +/− 1.23 Hz (mean +/− standard deviation) and spike half-width of 314.1 +/− 33.4 μs. Putative PN had a FR of 1.01 +/− .85 Hz and spike half-width of 325.4 +/− 44.8 μs. Non-SOM, non-PV IN had a FR of 2.1 +/− 2.5473 Hz and spike half-width of 325.5 +/− 46.1 μs. Individual single unit pip-evoked power spectra were calculated from pip-aligned spike times using the Chronux package (function coherencysegpt).
Histology
After behavioral testing, all mice were deeply anesthetized. In mice with implanted electrodes, electrothermal lesions were made to visualize electrode tip placements. Mice were trans-cardially perfused with 4% paraformaldehyde (PFA) in phosphate-buffered saline (PBS). Brains were extracted and post-fixed in 4% PFA for at least three days. After cryoprotection in 30% sucrose in PBS, 40-micron histological sections were prepared on a cryostat to localize viral expression and ferrule location. A subset of sections was utilized for immunohistochemistry to validate expression patterns of the cre-dependent viruses. Mice were excluded from behavioral or electrophysiological analyses based on two criteria: 1. expression in an improper location, especially the central amygdala, which is strongly SOM+(Li et al., 2013); 2. electrode placements outside the BLA or ferrule locations that would not properly illuminate the BLA.
Quantifying IN activity immunohistochemically
12-week-old, male, wild type C57/B6 mice (Jackson Laboratory) were used in this experiment, no mice were excluded from analysis. The activity of PV and SOM populations was probed using expression of the immediate-early gene c-fos, which is upregulated 1-3 hours after activation of neurons (Kovacs, 1998). All mice were trained on the differential fear conditioning paradigm, as described above, with three differences to encourage robust freezing and discrimination: 1. Mice were exposed to 6 trials of the CS+ and 6 trials of the CS−, interspersed, during training, 2. The mice were pre-exposed to context B for 20 minutes on the day of habituation, 3. On day 4, mice were exposed to either the CS+ or CS− for six trials. Animals were trained with 0.6 mA shocks for the CS+. Freezing during the tone presentations was scored offline by a researcher that was blind to group. Ninety minutes after the last tone presentation, mice were deeply anesthetized with a mixture of ketamine (100mg/kg), and xylazine (7mg/kg), and trans-cardially perfused (4% paraformaldehyde). The brains were then removed, fixed overnight, and then cryoprotected (30% sucrose in PBS). Slices were subsequently washed in PBS, blocked with 10% Normal Donkey Serum and 1% Triton, and incubated with primary antibodies for c-fos (Rabbit, Abcam, 1:2000), PV (Guinea Pig, Synaptic Systems, 1:1000), and SOM (Goat, Santa Cruz, 1:500) overnight at 4°C. The next day, slices were washed in PBS, incubated with secondary antibodies (Donkey, Jackson Immunoresearch) for 1 hour at room temperature and again washed with PBS before being mounted onto slides and coverslipped (ProLong® Gold liquid mount). Slides were imaged on a confocal microscope (Nikon A1) at 20X and positive cells counted, blinded with respect to group. C-fos co-labeling with either PV or SOM was quantified as the percentage of total PV or total SOM IN also labeling with c-fos.
Muscimol infusions
Male 3-5 mo C57/B6 mice were anesthetized with isofurane and stereotactically implanted with 26-gauge dual barrel cannulae (PlasticsOne) over the PL bilaterally (AP: +1.65, ML: ±0.3, DV: −1.1, allowing for infusion at DV −1.6), as already described. One week after implantation, mice were trained on the differential fear conditioning paradigm as previously described. On day four, the mice were exposed to 3 CS− and 3 CS+ tones to confirm that they were appropriately discriminating. Mice were then briefly sedated with isofurane to allow for infusion with either saline or muscimol in the PL, as already described. 30 minutes later, mice were re-exposed to 3 CS− and 3 CS+ tones and freezing to these tones was scored post-hoc. This procedure was then repeated on day 5, but infusing the opposite substance to the day prior. Mice were counterbalanced for which order they received saline and muscimol. There was no discernible change in pre-infusion discrimination between day 4 and 5. Paired analyses were performed to compare freezing of mice to the CS+ and CS− after saline and muscimol infusions. The main effect is presented as only the freezing rates after infusion, such that the effect of handling and isofurane were controlled, while the order of infusion was controlled by equally counterbalancing mice receiving saline (n=5) or muscimol (n=5) first. It is notable that no extinction was observed from day 4 to day 5 in either group. This was possibly due to the amnesiac effects of isoflurane, which was shown to affect the consolidation of learning when administered after Pavlovian fear conditioning (Dutton et al., 2002).
After testing, the mice were deeply anesthetized, infused with DiI, and their brains fixed to make histological sections. Only mice with cannulae terminating in the PL were included in the analysis (n=7 mice for retrieval data in Figure 1, whereas only n=6 mice for infusion mice due to one mouse with a misplaced infusion).
Monosynaptic rabies tracing
Viral tracing was done using viral constructs for rabies tracing experiments that dramatically increase trans-synaptic efficacy (Reardon et al., 2016). Viruses (0.4 nL of an AAV helper virus expressing GFP and glycoprotein in a cre-dependent manner) was stereotaxically injected in the BLA (ML: −3.3, AP: −1.7, DV: −4.3) of SOM-cre mice, such that helper virus only expressed in cre expressing cells. Two weeks later, the same mice were injected with 1 μL of Glycoprotein (G)-deleted rabies expressing mCherry. Thus, starter cells were labeled with both GFP and mCherry, while presynaptically connected cells were labeled only with mCherry. GFP-expressing cells not expressing mCherry were not traced. We observed a very sparse population of starter cells (at most 2 / coronal BLA slice), but this was sufficient to label presynaptic targets to conclusively demonstrate the existence of monosynaptic prefrontal inputs to amygdala SOM interneurons. To estimate the amount of connectivity, we counted the number of starter cells in coronal slices of the BLA, each collected every 200 microns of A-P distance. We then counted the number of presynaptic cells in medial prefrontal cortex subregions by the same methodology. From these counts, we estimated the total number of cells each the brain structure based on it’s A-P extent, and then we divided to estimate the number of upstream cells per starter cell.
QUANTIFICATION AND STATISTICAL ANALYSIS
Statistical details are found in supplementary tables associated with each figure and supplementary figure legends, including sample sizes, test statistics, and p-values. As most experiments consisted of CS+ and CS− responses as repeated measures in the presence or absence of manipulation (e.g. light or drug infusion), two-way repeated measures ANOVA was used throughout with explanatory variables of CS, manipulation (e.g. light on vs off, pre vs post infusion), and interaction term. Statistical testing was performed in Matlab using the built-in function anovan, with the repeated measure (mouse identity) identified as a hidden random variable. In experiments with only one explanatory variable (e.g. group), one-way ANOVA was utilized (built-in function, anova1), including hidden variables to account for any paired data collection when appropriate (as in Figure 1C; using the Matlab Statistics and Machine Learning toolbox functions fitrm and ranova). Post-hoc testing was only performed if an interaction term was found to be significant, to interpret the nature of the interaction. For one-way anova, the multcompare function was used in Matlab to perform Bonferroni post hoc test, and for two-way repeated measures anova, Bonferroni-corrected paired t-tests were performed (six comparisons). For post-hoc testing with mixed paired and unpaired data (e.g., comparing calcium imaging between habituation and retrieval), the optimal pooled t-test, T0pool, was used as an alternative (Guo and Yuan, 2017).
For comparing paired proportions, McNemar’s test was used, with Bonferroni correction when appropriate. For comparing unpaired proportions, a chi-square test was performed. For the evaluation of effects in individual mice, we used Bonferroni-corrected paired t-tests. For analysis of theta power directionality, we used uncorrected paired t-tests as explained above. For calcium imaging, we used uncorrected paired t-tests to compare calcium responses to the shift predictor (as in 1i, “vs shuffle”), while for LFP data, we used uncorrected one-sample t-tests compared to empirically known chance values (as in Figure S2). Uncorrected paired t-tests were also used to test for significant changes in discrimination score within individual groups of mice.
All statistical tests and p-values were two-sided throughout this study. Correlation strength was calculated using Pearson’s R, where applicable.
Error is reported in figures as mean ± standard error of the mean (± SEM), unless otherwise noted. One notable exception is that decoding data were presented as mean ± 95% confidence interval, as stated above.
Supplementary Material
Highlights.
BLA SOM interneurons are selectively activated by learned non-aversive stimuli
SOM interneurons filter out inputs that synchronize BLA, supporting discrimination
Prelimbic cortex is necessary for BLA SOM interneuron activation and discrimination
Prelimbic input to the BLA drives discrimination
ACKNOWLEDGMENTS
We thank Phebe Warren and Estelle Hofgaertner for technical assistance. Funding – J.M.S., P.-K.O., C.D.S., J.A.G., C.L., and E.L. J.M.S. is supported by NIMH K08MH127383. P.-K.O. is supported by NIMH K01MH123783. C.D.S. is supported by 5R01MH082017, 1R21MH116348, and the Simons Foundation. E.L. is supported by NIMH R01MH118441, BBRF, and PSC-CUNY.
This article was partially prepared while J.A.G. was employed at Columbia University. The opinions expressed in this article are the author’s own and do not reflect the view of the National Institutes of Health, the Department of Health and Human Services, or the United States government.
Footnotes
SUPPLEMENTAL INFORMATION
Supplemental information can be found online at https://doi.Org/10.1016/j.neuron.2022.03.020.
DECLARATION OF INTERESTS
The authors declare no competing interests.
REFERENCES
- Adhikari A, Sigurdsson T, Topiwala MA, and Gordon JA (2010). Crosscorrelation of instantaneous amplitudes of field potential oscillations: a straightforward method to estimate the directionality and lag between brain areas. J. Neurosci. Methods 191, 191–200. [DOI] [PMC free article] [PubMed] [Google Scholar]
- Ali F, and Kwan AC (2020). Interpreting in vivo calcium signals from neuronal cell bodies, axons, and dendrites: a review. Neurophotonics 7, 011402. [DOI] [PMC free article] [PubMed] [Google Scholar]
- Arruda-Carvalho M, and Clem RL (2014). Pathway-selective adjustment of prefrontal-amygdala transmission during fear encoding. J. Neurosci 34, 15601–15609. [DOI] [PMC free article] [PubMed] [Google Scholar]
- Arruda-Carvalho M, Wu WC, Cummings KA, and Clem RL (2017). Optogenetic examination of prefrontal-amygdala synaptic development. J. Neurosci 37, 2976–2985. [DOI] [PMC free article] [PubMed] [Google Scholar]
- Bergado-Acosta JR, Sangha S, Narayanan RT, Obata K, Pape HC, and Stork O (2008). Critical role of the 65-kDa isoform of glutamic acid decarboxylase in consolidation and generalization of Pavlovian fear memory. Learn. Mem 15, 163–171. [DOI] [PMC free article] [PubMed] [Google Scholar]
- Burgos-Robies A, Kimchi EY, Izadmehr EM, Porzenheim MJ, Ramos-Guasp WA, Nieh EH, Felix-Ortiz AC, Namburi P, Leppla CA, Presbrey KN, et al. (2017). Amygdala inputs to prefrontal cortex guide behavior amid conflicting cues of reward and punishment. Nat. Neurosci 20, 824–835. [DOI] [PMC free article] [PubMed] [Google Scholar]
- Buzsáki G, and Mizuseki K (2014). The log-dynamic brain: how skewed distributions affect network operations. Nat. Rev. Neurosci 15, 264–278. [DOI] [PMC free article] [PubMed] [Google Scholar]
- Cummings KA, and Clem RL (2020). Prefrontal somatostatin interneurons encode fear memory. Nat. Neurosci 23, 61–74. [DOI] [PMC free article] [PubMed] [Google Scholar]
- Davis P, Zaki Y, Maguire J, and Reijmers LG (2017). Cellular and oscillatory substrates of fear extinction learning. Nat. Neurosci 20, 1624–1633. [DOI] [PMC free article] [PubMed] [Google Scholar]
- Dutton RC, Maurer AJ, Sonner JM, Fanseiow MS, Laster MJ, and Eger EI 2nd (2002). Isoflurane causes anterograde but not retrograde amnesia for Pavlovian fear conditioning. Anesth. 96, 1223–1229. [DOI] [PubMed] [Google Scholar]
- Ghosh S, and Chattarji S (2015). Neuronal encoding of the switch from specific to generalized fear. Nat. Neurosci 18, 112–120. [DOI] [PubMed] [Google Scholar]
- Grewe BF, Gründemann J, Kitch LJ, Lecoq JA, Parker JG, Marshall JD, Larkin MC, Jercog PE, Grenier F, Li JZ, et al. (2017). Neural ensemble dynamics underlying a long-term associative memory. Nature 543, 670–675. [DOI] [PMC free article] [PubMed] [Google Scholar]
- Grosso A, Santoni G, Manassero E, Renna A, and Sacchetti B (2018). A neuronal basis for fear discrimination in the lateral amygdala. Nat. Commun 9, 1214. [DOI] [PMC free article] [PubMed] [Google Scholar]
- Guo B, and Yuan Y (2017). A comparative review of methods for comparing means using partially paired data. Stat. Methods Med. Res 26, 1323–1340. [DOI] [PubMed] [Google Scholar]
- Hara-Kuge S, Nishihara T, Matsuda T, Kitazono T, Teramoto T, Nagai T, and Ishihara T (2018). An improved inverse-type Ca2+ indicator can detect putative neuronal inhibition in Caenorhabditis elegans by increasing signal intensity upon Ca2+ decrease. PLoS One 13, e0194707. [DOI] [PMC free article] [PubMed] [Google Scholar]
- Hayes JP, Hayes SM, and Mikedis AM (2012). Quantitative meta-analysis of neural activity in posttraumatic stress disorder. Biol. Mood Anxiety Disord 2, 9. [DOI] [PMC free article] [PubMed] [Google Scholar]
- Hippenmeyer S, Vrieseling E, Sigrist M, Portmann T, Laengle C, Ladle DR, and Arber S (2005). A developmental switch in the response of DRG neurons to ETS transcription factor signaling. PLoS Biol. 3, e159. [DOI] [PMC free article] [PubMed] [Google Scholar]
- Ito W, Fusco B, and Morozov A (2020). Disinhibition-assisted long-term potentiation in the prefrontal-amygdala pathway via suppression of somatostatin-expressing interneurons. Neurophotonics 7, 015007. [DOI] [PMC free article] [PubMed] [Google Scholar]
- Kaifosh P, Zaremba JD, Danielson NB, and Losonczy A (2014). SIMA: Python software for analysis of dynamic fluorescence imaging data. Front. Neuroinform 8, 80. [DOI] [PMC free article] [PubMed] [Google Scholar]
- Klavir O, Genud-Gabai R, and Paz R (2013). Functional connectivity between amygdala and cingulate cortex for adaptive aversive learning. Neuron 80, 1290–1300. [DOI] [PubMed] [Google Scholar]
- Kovács KJ (1998). c-Fos as a transcription factor: a stressful (re)view from a functional map. Neurochem. Int 33, 287–297. [DOI] [PubMed] [Google Scholar]
- Krabbe S, Paradiso E, d’Aquin S, Bitterman Y, Courtin J, Xu C, Yonehara K, Markovic M, Müller C, Eichlisberger T, et al. (2019). Adaptive disinhibitory gating by VIP interneurons permits associative learning. Nat. Neurosci 22, 1834–1843. [DOI] [PubMed] [Google Scholar]
- Lee YK, and Choi JS (2012). Inactivation of the medial prefrontal cortex interferes with the expression but not the acquisition of differential fear conditioning in rats. Exp. Neurobiol 21, 23–29. [DOI] [PMC free article] [PubMed] [Google Scholar]
- Li H, Penzo MA, Taniguchi H, Kopec CD, Huang ZJ, and Li B (2013). Experience-dependent modification of a central amygdala fear circuit. Nat. Neurosci 16, 332–339. [DOI] [PMC free article] [PubMed] [Google Scholar]
- Likhtik E, Pelletier JG, Paz R, and Paré D (2005). Prefrontal control of the amygdala. J. Neurosci 25, 7429–7437. [DOI] [PMC free article] [PubMed] [Google Scholar]
- Likhtik E, Stujenske JM, Topiwala MA, Harris AZ, and Gordon JA (2014). Prefrontal entrainment of amygdala activity signals safety in learned fear and innate anxiety. Nat. Neurosci 17, 106–113. [DOI] [PMC free article] [PubMed] [Google Scholar]
- Marek R, Xu L, Sullivan RKP, and Sah P (2018). Excitatory connections between the prelimbic and infralimbic medial prefrontal cortex show a role for the prelimbic cortex in fear extinction. Nat. Neurosci 21, 654–658. [DOI] [PubMed] [Google Scholar]
- Meyer HC, and Bucci DJ (2014). The contribution of medial prefrontal cortical regions to conditioned inhibition. Behav. Neurosci 128, 644–653. [DOI] [PMC free article] [PubMed] [Google Scholar]
- Pachitariu M, Stringer C, Dipoppa M, Schröder S, Rossi LF, Dalgleish H, Carandini M, and Harris KD (2017). Suite2p: beyond 10,000 neurons with standard two-photon microscopy. Preprint at BioArxiv. 10.1101/061507. [DOI] [Google Scholar]
- Pnevmatikakis EA, and Giovannucci A (2017). NoRMCorre: an online algorithm for piecewise rigid motion correction of calcium imaging data. J. Neurosci. Methods 291, 83–94. [DOI] [PubMed] [Google Scholar]
- Reardon TR, Murray AJ, Turi GF, Wirbiich C, Croce KR, Schneii MJ, Jessell TM, and Losonczy A (2016). Rabies virus CVS-N2c(ΔG) strain enhances retrograde synaptic transfer and neuronal viability. Neuron 89, 711–724. [DOI] [PMC free article] [PubMed] [Google Scholar]
- Rosenkranz JA, and Grace AA (2001). Dopamine attenuates prefrontal cortical suppression of sensory inputs to the basolateral amygdala of rats. J. Neurosci 21, 4090–4103. [DOI] [PMC free article] [PubMed] [Google Scholar]
- Sangha S, Chadick JZ, and Janak PH (2013). Safety encoding in the basal amygdala. J. Neurosci 33, 3744–3751. [DOI] [PMC free article] [PubMed] [Google Scholar]
- Shaban H, Humeau Y, Herry C, Cassasus G, Shigemoto R, Ciocchi S, Barbieri S, van der Putten H, Kaupmann K, Bettler B, and Lüthi A (2006). Generalization of amygdala LTP and conditioned fear in the absence of presynaptic inhibition. Nat. Neurosci 9, 1028–1035. [DOI] [PubMed] [Google Scholar]
- Sierra-Mercado D, Padiiia-Coreano N, and Quirk GJ (2011). Dissociable roles of prelimbic and infralimbic cortices, ventral hippocampus, and basolateral amygdala in the expression and extinction of conditioned fear. Neuropsychopharmacology 36, 529–538. [DOI] [PMC free article] [PubMed] [Google Scholar]
- Stujenske JM, Likhtik E, Topiwala MA, and Gordon JA (2014). Fear and safety engage competing patterns of theta-gamma coupling in the basolateral amygdala. Neuron 83, 919–933. [DOI] [PMC free article] [PubMed] [Google Scholar]
- Taniguchi H, He M, Wu P, Kim S, Paik R, Sugino K, Kvitsiani D, Fu Y, Lu J, Lin Y, et al. (2011).A resource of Cre driver lines for genetic targeting of GABAergic neurons in cerebral cortex. Neuron 71, 995–1013. [DOI] [PMC free article] [PubMed] [Google Scholar]
- Taub AH, Perets R, Kahana E, and Paz R (2018). Oscillations synchronize amygdala-to-prefrontal primate circuits during aversive learning. Neuron 97, 291–298.e3. [DOI] [PubMed] [Google Scholar]
- Vieira PA, Corches A, Lovelace JW, Westbrook KB, Mendoza M, and Korzus E (2015). Prefrontal NMDA receptors expressed in excitatory neurons control fear discrimination and fear extinction. Neurobiol. Learn. Mem 119, 52–62. [DOI] [PMC free article] [PubMed] [Google Scholar]
- Wolff SB, Gründemann J, Tovote P, Krabbe S, Jacobson GA, Müller C, Herry C, Ehrlich I, Friedrich RW, Letzkus JJ, and Lüthi A (2014). Amygdala interneuron subtypes control fear learning through disinhibition. Nature 509, 453–458. [DOI] [PubMed] [Google Scholar]
Associated Data
This section collects any data citations, data availability statements, or supplementary materials included in this article.
Supplementary Materials
Data Availability Statement
All data reported in this paper will be shared by the lead contact upon request.
Original code utilized in this paper has been deposited at Zenodo and github and is publicly available as of the date of publication (see the key resources table).
Any additional information required to reanalyze the data reported in this paper is available from the lead contact upon request.
Key resources table
| REAGENT or RESOURCE | SOURCE | IDENTIFIER |
|---|---|---|
| Antibodies | ||
| Anti-c-fos (rabbit) | Abcam | Cat#ab190289; RRID:AB_2737414 |
| Anti-parvalbumin (guinea pig) | Synaptic Systems | Cat#195 004; RRID:AB_2156476 |
| Anti-SOM (goat) | Santa Cruz | Cat#sc-7819; RRID:AB_2302603 |
| Bacterial and virus strains | ||
| AAV5-CamKIIa-hChR2-H134R-mCherry-WPRE-pA | UNC Vector Core | N/A |
| AAV5-CamKIIa-H134R-mCherry-WPRE-pA | UNC Vector Core | N/A |
| AAV5-CamKIIa-eArchaerhodopsin-eYFP | UNC Vector Core | N/A |
| AAV5-CamKIIa-eYFP | UNC Vector Core | N/A |
| AAV5-Ef1a-DIO-eArch3.0-eYFP | UNC Vector Core | N/A |
| AAV5-Ef1a-DIO-eYFP | UNC Vector Core | N/A |
| AAV5-hsyn-FLEX-GCaMP6s | Penn Vector Core, Addgene | Cat#(Addgene):100845-AAV5; Plasmid RRID:Addgene_100845 |
| AAV1-Ef1a-FLEX-H2B-GFP-P2A-N2c[G] | Laboratory of Attila Losonczy, Reardon et al., 2016 | Plasmid RRID:Addgene_73476 |
| AAV1-FLEX-TVA-mCherry | Laboratory of Attila Losonczy, Reardon et al., 2016 | Plasmid RRID:Addgene_38044 |
| RabV CVS-N2cΔG-dsRed[EnvA] | Laboratory of Attila Losonczy, Reardon et al., 2016 | Plasmid RRID:Addgene_73460 |
| Chemicals, peptides, and recombinant proteins | ||
| Muscimol | Tocris | Cat#0289 |
| Experimental models: Organisms/strains | ||
| PV-IRES-cre transgenic mice | Jackson Laboratory | RRID:IMSR_JAX:017320 |
| SOM-IRES-cre transgenic mice | Jackson Laboratory | RRID:IMSR_JAX:018973 |
| Wildtype C57/B6J mice | Jackson Laboratory | RRID:IMSR_JAX:000664 |
| Wildtype 129S6/SvEvTac | Taconic Biosciences | RRID:IMSR_TAC:129sve |
| Software and algorithms | ||
| Kilosort2 | Github, retrieved on Sept 18, 2020 | https://github.com/MouseLand/Kilosort/releases/tag/v2.0 |
| Chronux2.12v03 | http://chronux.org/, retrieved on October 27, 2021 | http://chronux.org/ |
| Circular Statistics Toolbox (Matlab) | Mathworks | https://www.mathworks.com/matlabcentral/fileexchange/10676-circular-statistics-toolbox-directional-statistics |
| B-spline Grid, Image and Point based Registration Toolbox (Matlab) | Mathworks | https://www.mathworks.com/matlabcentral/fileexchange/20057-b-spline-grid-image-and-point-based-registration |
| deconvolution_standalone.m (Matlab) | Github, retrieved on April 26, 2019 | https://github.com/cortex-lab/Suite2P |
| Phy2 | Github, retrieved on Sept 18, 2020 | https://github.com/cortex-lab/phy |
| ImageJ | Research Services Branch, National Institute of Mental Health | https://imagej.nih.gov/ij/ |
| Matlab 2021a | Mathworks | https://www.mathworks.com/products/matlab.html |
| Spectral, single unit, fiber photometry analyses | This paper | DOI: 10.5281/zenodo.6347608 https://github.com/jmstujenske/PL_drives_nonaversion_via_SOM_IN |
| Other | ||
| 532nm DPSS laser (3% power stability) | OEM Laser Systems | GR-532-00100-CWM-SD-03-LED-0 |
| Optical commutator | Doric | FRJ_1x2i_FC-2FC |
| PlexBright Dual LED Commutator | Plexon | COM-Dual LED |
| PlexBright Compact LED Modules (465nm) | Plexon | LED_Blue_Compact_LC_magnetic |
| PlexBright One Channel LED Driver | Plexon | 1ch_LED_Driver |
| Fiber Photometry System | Neurophotometrics | FP3002 |
| Digital Acquisition System | Neuralynx | Digital Lynx 4SX |
| Digital Acquisition System | Blackrock Neurotech | Cerebrus Neural Signal Processor |
| Custom GRIN lens | GrinTech GmBH | NEM-085-50-00-920-S-1.0p |
| Two-photon microscope | Prairie Technologies | Ultima IV Model |
| Tunable mode-locked laser | Coherent | Chameleon Vision model |
| Tungsten Wire with Formvar coating (25 μm) | California Fine Wire | Material #100211, Coating NEMA MW 15, custom order |
| Tungsten Wire with Formvar coating (76.2 μm) | California Fine Wire | Material #100211, Coating NEMA MW 15, custom order |
| Electronic interface boards (8, 16, or 32 channel) | Neuralynx | EIB-8, EIB 16, EIB 32 narrow |
| Electronic interface boards (32 channel) | Gold Phoenix | Custom Design, http://likhtiklab.com/tools |
| Stainless steel binding screws (000-120 thread, 1/16” long) | Antrin Miniature Specialties | Part#B002SG89KW |