

Abstract
Objective:
Reliable change methods can aid in determining whether changes in cognitive performance over time are meaningful. The current study sought to develop and cross-validate 12-month standardized regression-based (SRB) equations for the neuropsychological measures commonly administered in the Alzheimer’s Disease Neuroimaging Initiative (ADNI) longitudinal study.
Method:
Prediction algorithms were developed using baseline score, retest interval, the presence/absence of a 6-month evaluation, age, education, sex, and ethnicity in two different samples (n = 192 each) of robustly cognitively intact community-dwelling older adults from ADNI – matched for demographic and testing factors. The developed formulae for each sample were then applied to one of the samples to determine Goodness-of-fit and appropriateness of combining samples for a single set of SRB equations.
Results:
Minimal differences were seen between Observed 12-month and Predicted 12-month scores on most neuropsychological tests from ADNI, and when compared across samples the resultant Predicted 12-month scores were highly correlated. As a result, samples were combined and SRB prediction equations were successfully developed for each of the measures.
Conclusions:
Establishing cross-validation for these SRB prediction equations provides initial support of their use to detect meaningful change in the ADNI sample, and provides the basis for future research with clinical samples to evaluation potential clinical utility. While some caution should be considered for measuring true cognitive change over time – particularly in clinical samples – when using these prediction equations given the relatively lower coefficients of stability observed, use of these SRBs reflects an improvement over current practice in ADNI.
Keywords: Reliable Change, Assessment, Neuropsychology, Practice Effects, Memory, ADNI
INTRODUCTION
Neuropsychologists and cognitive neurologists are often attempting to ascertain cognitive change over time in clinical and research settings using repeated assessment of an older patient’s cognition – frequently over an interval of one year (Barth et al., 2003; G. Chelune & Duff, 2012; Heilbronner et al., 2010). This serial assessment can commonly lead to practice effects – or the benefit from repeated exposure to test materials (Bartels, Wegrzyn, Wiedl, Ackermann, & Ehrenreich, 2010; Beglinger et al., 2005; Duff et al., 2010; Duff, Beglinger, et al., 2007) – that may result in increases in test scores, which may or may not be associated with improved cognitive abilities. As such, if not properly accounted for, practice effects can lead to faulty interpretations about improvements in cognition over time (Marley et al., 2017).
A family of statistical procedures has been developed – known as reliable change methods (Hinton-Bayre, 2016; Lezak, Howieson, Bigler, & Tranel, 2012) – in an effort to assist neuropsychologists and cognitive neurologists in distinguishing meaningful change from artifact during repeated cognitive assessments. One approach that has gained broad acceptance has been the predicted difference method (Attix et al., 2009; Crockford et al., 2018; Duff et al., 2010; Duff et al., 2004; Gavett, Ashendorf, & Gurnani, 2015; Hammers, Suhrie, Dixon, Porter, & Duff, 2020; Rinehardt et al., 2010; Sanchez-Benavides et al., 2016; Stein, Luppa, Brahler, Konig, & Riedel-Heller, 2010), which uses linear regression to consider differences between observed and predicted scores from a reference population such as a standardization sample (McSweeny, Naugle, Chelune, & Luders, 1993). Although other reliable change methods exist (e.g., simple difference approaches (Chelune, Naugle, Lüders, Sedlak, & Awad, 1993; Iverson, 2001; Jacobson & Truax, 1991), McSweeny and colleagues’ standardized regression-based (SRB) approach has been endorsed in head-to-head comparisons (Hinton-Bayre, 2016). This is due to its ability to incorporate multiple predictors of the retest score, ranging from statistical parameters (e.g., mean practice, differential practice, and test–retest reliability) to participant characteristics (demographic information) and testing features (e.g., retest interval; Crawford & Garthwaite, 2007).
In essence, McSweeny’s SRB approach uses linear regression to predict an individual’s scores at Time 2 (T2) based on his/her Time 1 (T1) performance, along with relevant clinical and testing information (e.g., demographics, diagnosis, retest interval, etc.). A discrepancy change score – or z score – can then be calculated by the equation z = (T2 – T2’)/ SEest, where T2 is an individual’s Time 2 score, T2’ is the predicted T2 score, and SEest is the standard error of the estimate of the regression model. When using 90% confidence intervals of stability and an α value of .10, discrepancy change scores (z scores) above 1.645 frequently represent “improvement beyond expectation” when using reliable change methods, whereas z scores below −1.645 reflect “decline beyond expectation” and z scores between +/− 1.645 indicate “stability within expectation” (McSweeny et al., 1993).
SRB prediction equations exist for a host of different cognitive measures (Calamia, Markon, & Tranel, 2012; Duff et al., 2004), test batteries (Duff, 2014), and diagnostic conditions – such as amyotrophic lateral sclerosis (Crockford et al., 2018), Parkinson’s disease (Rinehart et al, 2010), Mild Cognitive Impairment (MCI; Duff et al., 2010), breast cancer (Ouimet, Stewart, Collins, Schindler, & Bielajew, 2009), and epilepsy (Sawrie, Chelune, Naugle, & Luders, 1996). The creation and use of SRB prediction equations has also increased for large-scale longitudinal research in recent years, including for the National Alzheimer’s Coordinating Center’s Uniform Data Set 2.0 (Gavett et al., 2015) and 3.0 (Kiselica, Kaser, Webber, Small, & Benge, 2020). Somewhat surprisingly, however, no SRB prediction equations are available in the literature for predicting serial performance for the neuropsychological battery used in the Alzheimer’s Disease Neuroimaging Initiative (ADNI; Weiner et al., 2017) multi-center study. Although one study reports creating regression-based prediction equations from ADNI composites for the prediction of brain atrophy on structural magnetic resonance imaging (Lin, Fletcher, Gavett, & Alzheimer’s Disease Neuroimaging, 2021), the prediction equations themselves are not included in the manuscript. Relatedly, the commonly-administered list-learning task that is included in ADNI – the Rey Auditory Verbal Memory Test (RAVLT; Schmidt, 1996) – additionally does not appear to have SRBs available for use in the literature. For example, though Frerichs and Tuokko (2005) compared regression-based reliable change methods with other change-score approaches across five-year test-retest data for the RAVLT, like the Lin et al. study, the authors did not include the prediction equations in their manuscript. The only manuscript that appears to include reliable change data for the RAVLT on older adults (Knight, McMahon, Skeaff, & Green, 2007) did not use SRB methods in their manuscript. Therefore, there is a need for demographically-appropriate prediction formulae to apply to participants’ performance when being administered the neuropsychological battery from ADNI – in general – and the RAVLT – in particular.
Consequently, the primary aim of the current study was to develop 12-month regression-based prediction equations for the neuropsychological measures in the ADNI battery using a sample of ADNI participants that possessed intact and stable cognition over 24 months. Given the common usage of many of these measures in the greater neuropsychological community, the prediction of 12-month retest performances appears to be the most salient retest interval. To do so, we sought to cross-validate these prediction formulae from two different samples of cognitively normal ADNI participants – what we are calling the development and validation samples – and examine their goodness-of-fit for predicting 12-month performance. It was first hypothesized that SRB prediction equations incorporating baseline performance, test-schedule characteristics, and relevant demographics could account for a significant amount of variance in Predicted 12-month performance for each of the measures in the ADNI cognitive battery. Second, it was anticipated that the application of these newly created SRBs would generalize across samples, resulting in a high correspondence between Predicted scores developed from each sample. Such a result would permit the combination of these two samples, and the creation of prediction equations across the entire set of robustly cognitively intact participants in ADNI. Overall, establishing cross-validation for these SRB prediction equations would provide initial support of their use to detect meaningful change in the ADNI sample, and provide the basis for future research with clinical samples to evaluate potential clinical utility.
METHOD
Participants
All current participant data was obtained from ADNI’s multi-center longitudinal study. Please see the ADNI website (http://adni.loni.usc.edu) for a thorough review of the study resources and data publicly available. ADNI was launched in 2003 by Principal Investigator Michael W. Weiner, MD, as a public-private partnership, with extensions and renewals over time (i.e., ADNI-GO, ADNI-2, ADNI-3). The primary goal of ADNI has been to test whether serial magnetic resonance imaging (MRI), positron emission tomography (PET), other biological markers, and clinical and neuropsychological assessment can be combined to measure the progression of MCI and early Alzheimer’s disease (AD). For up-to-date information, see www.adni-info.org. Institutional Review Board approval has been obtained for each of the multi-center sites, and informed consent was obtained in written form from study participants or their authorized representatives.
As of April 26th, 2021, cognitive data were available for 2,366 ADNI participants across ADNI protocols, with enrolled participants being followed cognitively for up to 15 years. Inclusion for ADNI involved being between the ages of 55 to 90 at baseline; having at least 6 years of education and having a reliable study partner; being free of significant head trauma, depression, or neurologic disease; being stable on permitted medications; and being fluent in either English or Spanish (ADNI1, 2004; ADNI2, 2011; ADNI3, 2016; ADNIGO, 2009). Please see Figure 1 for a schematic of the current study’s participant utilization from ADNI. For example, 1,888 participants were excluded for having a consensus diagnostic classification at baseline of something other than Normal Cognition; specifically, 1,176 participants were classified as either MCI or AD, and 712 participants had a missing diagnostic classification (associated with missing data). An additional 94 participants were excluded for not having a consensus diagnostic classification of Normal Cognition at the 24-month assessment; specifically, 27 participants were classified as having MCI or AD at that time, and 67 participants had a missing diagnostic classification (associated with missing data). As a result, the current sample reflected 384 robustly cognitively intact participants over 24-months. The reader is referred to documentation of ADNI’s classification of participants into diagnostic categories (ADNI1, 2004; ADNI2, 2011; ADNI3, 2016; ADNIGO, 2009), though briefly Logical Memory from the Wechsler Memory Scale – Revised (WMS-R; Wechsler, 1987) the Mini-Mental State Examination (MMSE; Folstein, Folstein, & McHugh, 1975) and the Clinical Dementia Rating (CDR) scale (Morris, 1993) were used to determine diagnostic classifications. To classify as Cognitively Normal, participants generally scored ≥9 on Logical Memory II for 16 or more years of education, ≥5 for 8–15 years of education, and ≥3 for 0–7 years of education; 24 – 30 on the MMSE, and had a CDR score of 0 (ADNI1, 2004; ADNI2, 2011; ADNI3, 2016; ADNIGO, 2009). However, on occasion participants with mild endorsements on the CDR were included at the discretion of the ADNI site as Cognitively Normal. These 384 participants were subsequently separated evenly into development (n = 192) and validation (n = 192) samples using SPSS v.28 software, matched for age, education, diagnosis, sex, race, premorbid intellect, and presence of a 6-month evaluation (as will be described later in the Methods).
Figure 1.
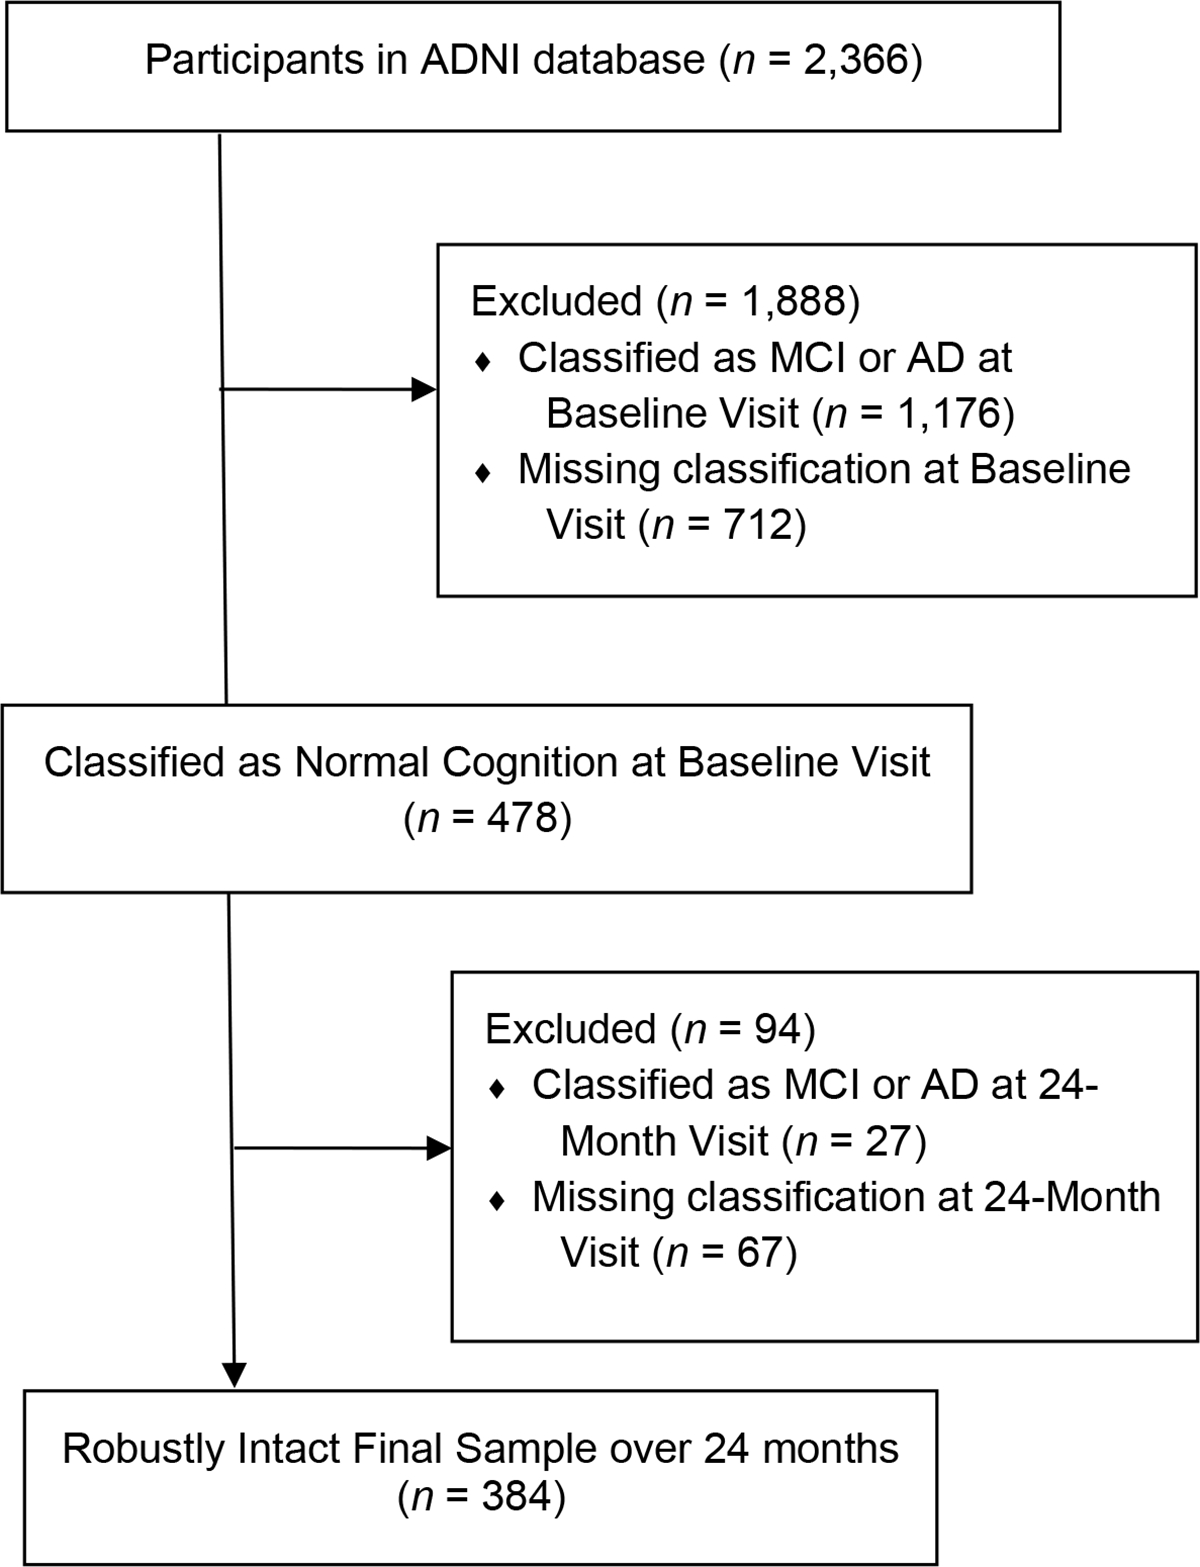
Flow diagram of participants recruited into the current study from the total sample of ADNI participants.
Procedure
All participants underwent a standard neuropsychological battery at a baseline visit. Readers are referred to ADNI protocols (2004; 2011; 2016; 2009) for neuropsychological test descriptions and psychometric properties. As these tests are common to most dementia clinicians and researchers, they will not be described here. The neuropsychological measures used in the current study were as follows: RAVLT Total Recall and Delayed Recall (Schmidt, 1996), Logical Memory I and II (Immediate and Delayed Recall for “Story A” only; Wechsler, 1987), Trail Making Test Parts A and B (TMT-A and TMT-B; Reitan, 1992), Category Fluency – Animal Fluency and Category Fluency – Vegetable Fluency (listed as Animal Fluency and Vegetable Fluency from this point forward; Morris et al., 1989), Digit Symbol from the Wechsler Adult Intelligence Scale - Revised (WAIS-R; Wechsler, 1981), Digit Span (Forward, Backward) from the WMS-R (Wechsler, 1987), Clock Drawing Test (CDT) and Clock Copy Test (CCT; Goodglass & Kaplan, 1983), American National Adult Reading Test (AMNART; Grober & Sliwinski, 1991), Alzheimer’s Disease Assessment Scale – Cognitive Subscale (ADAS-Cog; Mohs et al., 1997), 30-item Boston Naming Test (odd-numbers only; Kaplan, Goodglass, & Weintraub, 1983), Mini-Mental State Examination (MMSE; Folstein et al., 1975), Montreal Cognitive Assessment (MoCA; Nasreddine et al., 2005), and the 15-item Geriatric Depression Scale (GDS; Sheikh & Yesavage, 1986). Higher scores indicated better performance for RAVLT Total Recall and Delayed Recall, Logical Memory I and II, Digit Symbol Test, Digit Span Forward and Backward, Animal Fluency and Vegetable Fluency, CDT and CCT, Boston Naming Test, AMNART, MMSE, and MOCA. Lower scores indicated better performance for TMT-A and TMT-B, and ADAS-Cog.
After approximately 12 months (M = 370.8 days, SD = 21.4), RAVLT, Logical Memory, TMT-A, TMT-B, Animal Fluency and Vegetable Fluency, Digit Symbol Test, Digit Span, CDT and CCT, ADAS-Cog, Boston Naming Test, MMSE, and MOCA (hereafter referred to as the “repeated cognitive battery”) were repeated. The same version of each measure was administered for all tasks across test administrations in ADNI with the exception of a word-list from the ADAS-Cog according to ADNI protocols (ADNI1, 2004; ADNI2, 2011; ADNI3, 2016; ADNIGO, 2009). Digit Span, Digit Symbol, and Vegetable Fluency were only administered during the first ADNI protocol (ADNI-1), MOCA was administered in ADNI-GO, ADNI-2, and ADNI-3, and Boston Naming Test was only administered in ADNI-GO and ADNI-2; all other measures in the repeated cognitive battery were administered across ADNI protocols.
Of note, protocols for ADNI-1, ADNI-GO, and ADNI-2 utilized an additional 6-month test administration that was discontinued with the initiation of ADNI-3. We have recently shown that the presence of the 6-month cognitive assessment in ADNI did not influence performance over one year for any of the measures administered in the repeated cognitive battery (Hammers, Duff, & Apostolova, 2022). Specifically, using mixed between-within subjects repeated measures ANOVA, no significant interaction effects were observed between cognitive performance over time and whether someone had a 6-month assessment. Comparable results were seen in analyses examining these effects within subpopulations of cognitively normal, MCI, and AD participants. Additionally, the calculation of Δ change scores between baseline and 12-months similarly indicated no difference between 6-month assessment status, and the interaction between 6-month assessment status and diagnostic subsample was also non-significant. Finally, when entered into a regression model with baseline performance and demographic variables, 6-month assessment status only accounted for an additional 0 to 0.5% of the variance in the prediction of 12-month performance across cognitive measures in the ADNI battery. As a result of these findings, we argued for the collapsing of longitudinal participant data across ADNI protocols. However, it is possible that the focus on examination of “mean differences” between the two cohorts overlooks potential differences in explained variance by having a 6-month assessment. In the current sample, 36 of the 384 participants did not have a 6-month evaluation (18 in each of the development and validation samples). When examining differences in explained variance for 12-month performance between individuals that did and did not receive a 6-month cognitive evaluation, all differences in R2 values for the final models were negligible. For example, for RAVLT Total Recall, the amount of variance accounted for by the model was R2 = .500 for the total sample and R2 = .508 when participants without a 6-month assessment were removed from the analyses. For RAVLT Delayed Recall, the variance was R2 = .384 for the total sample and R2 = .376 after removing those without the 6-month assessment. Similarly, the variance explained for the model for ADAS-Cog was R2 = .412 for the total sample and R2 = .388 after removal of participants without a 6-month assessment. This suggests that the presence of the additional 6-month assessment did not increase the amount of variance explained, and in some circumstances slightly reduced it. This finding, along with (1) our previous results and (2) our matching of development and validation samples across participants with and without a 6-month evaluation, led us to include 12-month data for all eligible ADNI participants.
Analyses
Comparisons Between Development and Validation Samples
To consider equivalence between development and validation samples, independent samples t tests were used to compare continuous demographic variables (e.g., age, education, premorbid intellect, depression), testing (i.e., retest interval, presence/absence of a 6-month evaluation), and both Baseline (BL) and 12-month (M12) cognitive performances between participants in each sample. Similarly, chi-square analyses were conducted between the development and validation samples to compare categorical demographic variables (e.g., sex, ethnicity, 6-month assessment). Also, bivariate correlations between Observed Baseline and 12-month scores (r12) were run within each sample, to assess stability over time of each variable and differences in stability between samples. Further, simple difference change scores (M12 – BL Δ) were calculated for each variable, and then paired-samples t tests were conducted to compare the level of simple change in the development and validation samples.
Simple Difference Change Over Time Within Each Sample
To compare the simple difference between Observed Baseline and Observed 12-month cognitive scores – without accounting for practice effects – within each of the development and validation samples, paired-samples t tests were conducted on Observed Baseline Observed 12-month scores (i.e., comparison of T1 versus T2 scores) for each of the measures in the repeated cognitive battery. Please note, while the authors acknowledge that the 12-month administration of the repeated cognitive battery represented the third test administration for some of these participants (not their second), they maintained the nomenclature of T2 for the follow-up timepoint of interest for consistency with the remainder of the SRB literature.
Calculation of Development and Validation Sample SRBs
Linear multivariable regression analyses were used to derive prediction equations for 12-month cognitive performances from both the development and validation samples of robustly cognitively intact participants (n = 192, each) based on McSweeny et al. (1993), though the current study used multiple regression analyses via forced entry instead of step-wise for better statistical rigor (Millis, 2003). In this first step, a separate prediction equation was generated for each of the measures in the repeated cognitive battery for each of the development and validation samples. Similar to the methodology used by Duff (Duff et al., 2004; Duff et al., 2005) and others (Gavett et al., 2015; Kiselica et al., 2020), Baseline (T1) score, 12-month retest interval, the presence/absence of a 6-month assessment, and demographic variables (age, education, sex, and ethnicity) were regressed in a single step on the respective 12-month (T2) score. No interaction terms were included as predictors. For example, T1 RAVLT Total Recall, retest interval, the presence/absence of a 6-month RAVLT Total Recall assessment, and demographic variables were regressed on T2 RAVLT Total Recall performance. The retest interval was represented as days from T1 to T2. Age was represented as years old at T1, and education as the number of years of formal education. Sex was coded as male = 1 and female = 2, and ethnicity was coded as Caucasian/Non-Hispanic = 1 and Non-Caucasian/Hispanic = 2. The absence of a 6-month assessment was coded as = 0, and the presence of a 6-month assessment was coded as = 1. All scores in the repeated cognitive battery were represented as raw scores, based on findings from Durant et al (2019).
Predicted Difference Method Examination
To examine change using reliable change methods, SRBs created from the development sample were subsequently applied to the current validation sample’s Observed Baseline and Observed 12-month scores, and relevant demographic and testing characteristics. This resulted in a Predicted 12-month score (T2’) being created for each measure in the repeated cognitive battery. While the Predicted 12-month scores can be subtracted from the respective Observed 12-month scores (T2) and divided by the SEest to reflect a discrepancy z score that represents a normalized deviation of change for an individual participant (e.g., z = ((T2 – T2’)/ SEest)), the focus of this manuscript will be on the resultant Predicted 12-month scores. Next, Goodness-of-fit of the Predicted 12-month scores and the Observed 12-month scores were conducted using paired-samples t tests (e.g.., comparison of T2 versus T2’ scores) for each of the measures in the repeated cognitive battery. Also, bivariate correlations between Observed 12-month and Predicted 12-month scores were run. As a reminder, when an Observed score was significantly greater than the Predicted score, this suggested that the SRB equations “under-predicted” performance over 12-months for all measures in the repeated cognitive battery except TMT-A, TMT-B, and ADAS-Cog (which required reverse scoring because higher scores denote greater impairment in these measures). Conversely, Observed scores being smaller than the Predicted scores suggest “over-prediction” over time (except in TMT-A, TMT-B, and ADAS-Cog, which is reversed).
Cross-Validation of the SRB Equations and Creation of Combined SRBs
To cross-validate the SRB prediction equations from both the development and validation samples – with the intention of creating SRBs from a combined development-validation sample – both sets of SRBs were subsequently applied to the current validation sample’s Observed Baseline and Observed 12-month scores, and relevant demographic and testing characteristics. Goodness-of-fit assessment was conducted on the resultant Predicted 12-month scores from each sample using bivariate correlations and Bland Altman plots.
Finally, SRB equations for 12-month performance were again created for all measures in the repeated cognitive battery using linear multivariable regression analyses after combining the development and validation samples together (n = 384 robustly cognitively intact participants). Specifically, Baseline (T1), 12-month retest interval, presence/absence of a 6-month assessment, and demographic variables (age, education, sex, ethnicity, premorbid intellect) were regressed in a single step to generate a Predicted 12-month score.
Measures of effect size were expressed throughout as Cohen’s d values for continuous data, and Phi coefficients for categorical data. Effect sizes of Fishers r to z transformations were provided as Fishers z values. Given the number of comparisons in the current study, a two-tailed alpha level was set at .01 for all statistical analyses.
RESULTS
Comparisons Between Development and Validation Samples
Table 1 reflects demographic characteristics of participants from the current study’s development and validation samples of robustly cognitively intact individuals. Consistent with their demographic matching, no differences were observed between participants in the development and validation samples for age, t(382) = −0.28, p = .78, d = −0.03, education, t(382) = 0.17, p = .86, d = 0.02, AMNART premorbid verbal intellect, t(382) = 1.04, p = .30, d = 0.11, 12-month retest interval, t(382) = 0.19, p = .85, d = 0.02, self-reported depression, t(382) = 1.32, p = .19, d = 0.14, sex, χ2 (1) = 0.38, p = .61, Phi = .03, ethnicity, χ2 (1) = 0.79, p = .48, Phi = .05, or the presence of a 6-month assessment, χ2 (1) = 0.00, p = .99, Phi = .00.
Table 1.
Demographic characteristics of the development and validation samples.
| Development Sample | Validation Sample | p value | Effect Size | |||
|---|---|---|---|---|---|---|
| Variable | Mean (SD) or n | Range | Mean (SD) or n | Range | ||
| n | 192 | 192 | ||||
| Age (years) | 73.8 (5.7) | 59 – 89 | 74.0 (5.8) | 56 – 87 | .78 | −.03 |
| Education (years) | 16.4 (2.6) | 6 – 20 | 16.4 (2.7) | 7 – 20 | .86 | .02 |
| Sex (n) | .61 | .03 | ||||
| Males | 101 | 95 | ||||
| Females | 91 | 97 | ||||
| Ethnicity (n) | .48 | .05 | ||||
| Non-Caucasian / Hispanic | 15 | 20 | ||||
| Caucasian / Non-Hispanic | 177 | 172 | ||||
| Test Interval (days): 12-month assessment | 371.0 (25.0) | 304 – 581 | 370.5 (17.1) | 315 – 460 | .85 | .01 |
| AMNART Premorbid Intellect (SS) | 121.3 (6.9) | 86 – 131 | 120.5 (8.0) | 86 – 131 | .30 | .11 |
| CDR-SB | 0.03 (0.1) | 0 – 0.5 | 0.04 (0.2) | 0 – 1.0 | .18 | −.14 |
| FAQ | 0.2 (0.7) | 0 – 6 | 0.2 (0.7) | 0 – 6 | .94 | .01 |
| MMSE | 29.1 (1.1) | 24 – 30 | 29.2 (1.0) | 25 – 30 | .40 | −.09 |
| GDS | 0.8 (1.1) | 0 – 6 | 0.7 (1.0) | 0 – 5 | .19 | .14 |
Note: AMNART Premorbid Intellect = American National Adult Reading Test, SS = Standard Score, CDR-SB = Clinical Dementia Rating scale – Sum of Boxes, FAQ = Functional Activity Questionnaire, MMSE = Mini-Mental State Examination, and GDS = Geriatric Depression Scale. p value = significance of comparisons between development and validation samples using independent samples t tests and chi-square analyses for continuous and categorical variables, respectively. Effect Size = Cohen’s d and Phi values for continuous and categorical (sex and ethnicity) variables, respectively.
Additionally, Tables 2 – 4 show that the cognitive performances, simple difference change over time, and coefficients of stability were comparable between development and validation samples. As seen when comparing respective columns in Tables 2 and 3, baseline and 12-month cognitive performances from the measures in the repeated cognitive battery were not different between the samples (ps = .16 to .98, ds = 0.00 to 0.15). Tables 2 and 3 also show that bivariate correlations between Observed Baseline and Observed 12-month scores revealed highly variable coefficients of stability between measures. Specifically, the stability coefficients ranged from r12 = .17 to .87 at 12-months across samples. For the development sample, only Digit Span Backward, Digit Symbol, Vegetable Fluency, and Boston Naming Test exceeded r12 ≥ .70, and only Digit Span Forward and Digit Symbol did so for the validation sample. Despite this variability across measures, the coefficients of stability were comparable between development and validation samples for each measure in the repeated cognitive battery (see respective column in Tables 2 and 3). Relatedly, Table 4 reveals that no differences existed for simple difference change scores (M12 – BL Δ) between development and validation samples (ps ≥ .15, ds ≤ | 0.15 |). Regarding skewness of the measures (Tables 2 and 3), CDT, CDT, TMT-A, TMT-B, Boston Naming Test, and MMSE were skewed for both Observed Baseline and Observed 12-month values, for both development and validation samples. Specifically, CDT, CCT, Boston Naming Test, and MMSE values were skewed to the left (skew ≤ −1) and TMT-A and TMT-B were skewed to the right (skew ≥ 1).
Table 2.
Observed Baseline, Observed 12-month cognitive scores and skewness, p values and Effect Sizes, and r values for the development sample of robustly cognitively intact participants.
| Observed Baseline Mean (SD) | Observed Baseline Skew | Observed 12-month Mean (SD) | Observed 12-month Skew | p value | Effect Size | r12 | |
|---|---|---|---|---|---|---|---|
| RAVLT | |||||||
| Total Recall | 45.30 (9.8) | 0.04 | 45.54 (10.3) | 0.35 | .68 | −.03 | .69 |
| Delayed Recall | 7.82 (3.8) | −0.15 | 7.98 (3.9) | −0.20 | .52 | −.05 | .59 |
| Logical Memory | |||||||
| Immediate Recall | 14.09 (3.3) | −0.02 | 15.11 (3.5) | −0.31 | <.001 | −.31 | .54 |
| Delayed Recall | 13.24 (3.3) | 0.38 | 13.73 (4.1) | −0.40 | .05 | −.15 | .60 |
| ADAS-Cog | 9.32 (4.2) | 0.44 | 8.94 (4.6) | 0.38 | .19 | .10 | .59 |
| Clock Drawing | 4.71 (0.5) | −1.65 | 4.68 (0.6) | −2.23 | .62 | .04 | .23 |
| Clock Copy | 4.85 (0.5) | −5.83 | 4.85 (0.4) | −2.34 | .99 | .00 | .20 |
| DS Forward | 8.99 (2.0) | −0.34 | 9.06 (2.1) | −0.13 | .72 | −.04 | .65 |
| DS Backward | 7.27 (2.1) | 0.06 | 7.27 (2.3) | 0.23 | .99 | .00 | .73 |
| Digit Symbol | 45.92 (9.3) | 0.28 | 46.91 (10.0) | 0.04 | .06 | −.20 | .87 |
| Animal Fluency | 20.87 (5.5) | 0.37 | 21.56 (5.4) | 0.42 | .04 | −.15 | .66 |
| Vegetable Fluency | 14.86 (4.1) | 0.20 | 14.99 (4.5) | 0.26 | .71 | −.04 | .70 |
| TMT-A | 34.01 (11.6) | 1.03 | 32.61 (10.0) | 1.20 | .03 | .16 | .69 |
| TMT-B | 82.65 (42.4) | 2.40 | 76.93 (36.9) | 2.31 | .05 | .15 | .51 |
| BNT | 28.40 (1.9) | −1.97 | 28.82 (1.6) | −1.75 | <.001 | −.31 | .70 |
| MMSE | 29.08 (1.1) | −1.73 | 28.97 (1.3) | −1.25 | .27 | .08 | .35 |
| MOCA | 25.79 (2.4) | −0.24 | 26.35 (2.5) | −0.23 | .02 | −.23 | .50 |
Note: RAVLT = Rey Auditory Verbal Learning Test, ADAS-Cog = Alzheimer’s Disease Assessment Scale – Cognition subscale, DS = Digit Span, TMT-A = Trail Making Test Part A, TMT-B = Trail Making Test Part B, BNT = Boston Naming Test, MMSE = Mini-Mental State Examination, MOCA = Montreal Cognitive Assessment. p value = significance of paired-samples t tests examining the difference between Observed Baseline and Observed 12-month performances. Effect Size = Cohen’s d values for paired samples t tests. r12 = bivariate correlation between Observed Baseline and Observed 12-month performances for each measure. All correlations greater than r = .23 were significant at p < .001.
Table 4.
Change from Observed Baseline and Observed 12-months for the validation and development samples of robustly cognitively intact participants.
| Development Sample M12 – BL Δ | Validation Sample M12 – BL Δ | p value | Effect Size | |
|---|---|---|---|---|
| RAVLT | ||||
| Total Recall | 0.24 (7.9) | 0.46 (8.3) | .79 | −0.03 |
| Delayed Recall | 0.16 (3.5) | 0.44 (3.5) | .43 | −0.08 |
| Logical Memory | ||||
| Immediate Recall | 1.02 (3.3) | 0.86 (3.0) | .64 | 0.05 |
| Delayed Recall | 0.50 (3.4) | 0.32 (3.4) | .62 | 0.05 |
| ADAS-Cog | −0.38 (4.0) | −0.70 (3.5) | .41 | 0.09 |
| Clock Drawing | −0.03 (0.7) | −0.03 (0.7) | .49 | −0.07 |
| Clock Copy | 0.00 (0.6) | −0.01 (0.5) | .92 | 0.01 |
| DS Forward | 0.07 (1.7) | −0.02 (1.4) | .71 | 0.06 |
| DS Backward | 0.00 (1.7) | 0.11 (2.0) | .70 | −0.06 |
| Digit Symbol | 0.99 (5.0) | 1.60 (7.6) | .52 | −0.09 |
| Animal Fluency | 0.69 (4.5) | 0.20 (4.4) | .28 | 0.11 |
| Vegetable Fluency | 0.13 (3.4) | −0.27 (3.6) | .42 | 0.12 |
| TMT-A | −1.39 (8.6) | −1.78 (10.4) | .69 | 0.04 |
| TMT-B | −5.71 (39.4) | −0.28 (35.9) | .15 | −0.15 |
| BNT | 0.42 (1.4) | 0.53 (1.7) | .51 | −0.07 |
| MMSE | −0.11 (1.4) | −0.07 (1.5 | .83 | −0.02 |
| MOCA | 0.56 (2.4) | 0.19 (2.2) | .27 | 0.16 |
Note: M12 = Observed 12-month score, BL = Observed Baseline score, Δ = Delta or change score, RAVLT = Rey Auditory Verbal Learning Test, ADAS-Cog = Alzheimer’s Disease Assessment Scale – Cognition subscale, DS = Digit Span, TMT-A = Trail Making Test Part A, TMT-B = Trail Making Test Part B, BNT = Boston Naming Test, MMSE = Mini-Mental State Examination, MOCA = Montreal Cognitive Assessment. p value = significance of independent samples t tests examining the difference between the M12 – BL Δ performances between groups. Effect Size = Cohen’s d values for independent samples t tests.
Table 3.
Observed Baseline, Observed 12-month cognitive scores and skewness, p values and Effect Sizes, and r values for the validation sample of robustly cognitively intact participants.
| Observed Baseline Mean (SD) |
Observed Baseline Skew |
Observed 12-month Mean (SD) |
Observed 12-month Skew |
p value | Effect Size | r 12 | |
|---|---|---|---|---|---|---|---|
| RAVLT | |||||||
| Total Recall | 44.94 (9.8) | 0.23 | 45.41 (10.6) | 0.14 | .44 | −.06 | .68 |
| Delayed Recall | 7.91 (3.8) | −0.08 | 8.35 (4.1) | −0.30 | .08 | −.13 | .61 |
| Logical Memory | |||||||
| Immediate Recall | 14.30 (3.0) | −0.03 | 15.16 (3.2) | −0.25 | <.001 | −.29 | .54 |
| Delayed Recall | 13.51 (3.3) | −0.08 | 13.83 (3.7) | −0.25 | .19 | −.10 | .53 |
| ADAS-Cog | 8.96 (4.2) | 0.46 | 8.26 (4.3) | 0.73 | .005 | .21 | .67 |
| Clock Drawing | 4.68 (0.7) | −2.72 | 4.71 (0.6) | −2.35 | .63 | −.04 | .29 |
| Clock Copy | 4.88 (0.4) | −3.23 | 4.87 (0.4) | −3.14 | .87 | .01 | .27 |
| DS Forward | 8.80 (1.9) | 0.15 | 8.78 (1.8) | 0.13 | .89 | .01 | .70 |
| DS Backward | 7.39 (2.2) | 0.18 | 7.50 (2.2) | 0.20 | .59 | −.05 | .58 |
| Digit Symbol | 46.80 (10.7) | 0.01 | 48.40 (11.3) | 0.09 | .04 | −.21 | .76 |
| Animal Fluency | 20.89 (5.4) | 0.23 | 21.08 (5.1) | 0.53 | .54 | −.05 | .65 |
| Vegetable Fluency | 14.90 (3.8) | 0.87 | 14.63 (3.8) | 0.62 | .44 | .08 | .57 |
| TMT-A | 33.68 (11.3) | 2.15 | 31.90 (9.7) | 0.95 | .02 | .17 | .52 |
| TMT-B | 80.38 (36.3) | 2.02 | 80.10 (41.8) | 3.05 | .91 | .01 | .61 |
| BNT | 28.10 (2.2) | −1.57 | 28.63 (1.9) | −1.61 | <.001 | −.31 | .68 |
| MMSE | 29.18 (1.0) | −1.34 | 29.10 (1.4) | −2.82 | .47 | .05 | .17 |
| MOCA | 25.71 (2.4) | −0.10 | 25.90 (2.6) | −0.12 | .41 | −.09 | .62 |
Note: RAVLT = Rey Auditory Verbal Learning Test, ADAS-Cog = Alzheimer’s Disease Assessment Scale – Cognition subscale, DS = Digit Span, TMT-A = Trail Making Test Part A, TMT-B = Trail Making Test Part B, BNT = Boston Naming Test, MMSE = Mini-Mental State Examination, MOCA = Montreal Cognitive Assessment. p value = significance of paired-samples t tests examining the difference between Observed Baseline and Observed 12-month performances. Effect Size = Cohen’s d values for paired samples t tests. r12 = bivariate correlation between Observed Baseline and Observed 12-month performances for each measure. All correlations greater than r = .29 were significant at p < .001.
Simple Difference Change Over Time Within Each Sample
Change over time within each sample was first assessed using a traditional simple difference method of comparing Observed Baseline and Observed 12-month Follow-up scores for each of the repeated measures in the cognitive battery in both the development and validation samples. As seen in Table 2, for the development sample at 12-months, significant differences were observed for Logical Memory Immediate Recall, t(191) = −4.31, p < .001, d = −0.31, and Boston Naming Test, t(176) = −4.06, p < .001, d = −0.31, after accounting for multiple comparisons. Table 3 shows that for the validation sample significant differences were observed for Logical Memory Immediate Recall, t(191) = −4.01, p < .001, d = −0.29, ADAS-Cog, t(189) = 2.82, p = .005, d = 0.21, and Boston Naming Test, t(176) = −4.24, p < .001, d = −0.32. In each circumstance, performance was stronger at 12-months than at Baseline. No significant differences were observed for any of the other measures for either sample, including RAVLT Total Recall and Delayed Recall, Logical Memory Delayed Recall, CDT and CCT, Digit Span Forward and Backward, Digit Symbol Test, Animal Fluency and Vegetable Fluency, TMT-A and TMT-B, MMSE, and MOCA (see Tables 2 and 3 for p and d values).
Predicted Difference Method Examination
Change over time was then assessed after applying reliable change methods. SRB prediction equations from the development sample for each of the repeated measures in the cognitive battery were applied to the validation sample, resulting in the creation of 12-month Predicted scores for each measure in the repeated battery. When using paired-sample t tests to compare the Predicted scores to their respective Observed scores for each measure, significant differences between 12-month Observed and 12-month Predicted scores were observed for measures of RAVLT Delayed Recall, t(191) = −4.12, p < .001, d = −0.30, Logical Memory Delayed Recall, t(191) = −4.64, p < .001, d = −0.34, CCT, t(190) = −6.98, p < .001, d = −0.51, Animal Fluency, t(191) = −2.76, p = .006, d = −0.20, and MOCA, t(88) = −3.77, p < .001, d = −0.40, after accounting for multiple comparisons. As seen in Table 5, observed 12-month performances were lower than predicted for each significant cognitive variable. No significant differences were observed for any of the other measures (see Table 5 for p and d values). Additionally, bivariate correlations between observed and predicted 12-month scores fell in the range of r = .53 to .76 for most variables (with the exception of CDT, CCT, and MMSE; see Table 5).
Table 5.
Comparison of Observed 12-month cognitive scores from the validation sample and Predicted 12-month scores based on SRBs from the development sample.
| Observed 12-month | Predicted 12-month | r | R2 | p value | Effect Size | |
|---|---|---|---|---|---|---|
| RAVLT | ||||||
| Total Recall | 45.41 (10.6) | 44.68 (7.5) | .68 | .46 | .20 | 0.09 |
| Delayed Recall | 8.35 (4.1) | 9.30 (2.3) | .62 | .38 | <.001 | −0.30 |
| Logical Memory | ||||||
| Immediate Recall | 15.16 (3.2) | 14.85 (1.8) | .54 | .29 | .12 | 0.11 |
| Delayed Recall | 13.83 (3.7) | 14.90 (2.6) | .53 | .28 | <.001 | −0.34 |
| ADAS-Cog | 8.26 (4.2) | 8.37 (3.0) | .68 | .46 | .53 | −0.05 |
| Clock Drawing | 4.71 (0.6) | 4.72 (0.3) | .24 | .06 | .80 | −0.02 |
| Clock Copy | 4.87 (0.4) | 5.06 (0.1) | .25 | .06 | <.001 | −0.51 |
| DS Forward | 8.78 (1.8) | 8.62 (1.3) | .68 | .46 | .25 | 0.12 |
| DS Backward | 7.50 (2.2) | 7.06 (1.7) | .55 | .30 | .03 | 0.23 |
| Digit Symbol | 48.40 (11.3) | 48.96 (9.9) | .76 | .58 | .46 | −0.07 |
| Animal Fluency | 21.08 (5.1) | 21.89 (3.7) | .63 | .39 | .006 | −0.20 |
| Vegetable Fluency | 14.63 (3.8) | 14.82 (3.3) | .54 | .29 | .58 | −0.05 |
| TMT-A | 31.90 (9.7) | 33.05 (6.8) | .55 | .30 | .06 | −0.14 |
| TMT-B | 80.10 (41.8) | 77.50 (18.5) | .57 | .32 | .31 | 0.07 |
| BNT | 28.63 (1.9) | 28.58 (1.3) | .68 | .46 | .67 | 0.03 |
| MMSE | 29.10 (1.3) | 29.24 (0.4) | .18 | .03 | .06 | −0.11 |
| MOCA | 25.90 (2.6) | 26.75 (1.4) | .58 | .33 | <.001 | −0.40 |
Note: RAVLT = Rey Auditory Verbal Learning Test, ADAS-Cog = Alzheimer’s Disease Assessment Scale – Cognition subscale, DS = Digit Span, TMT-A = Trail Making Test Part A, TMT-B = Trail Making Test Part B, BNT = Boston Naming Test, MMSE = Mini-Mental State Examination, MOCA = Montreal Cognitive Assessment. r = bivariate correlation between Observed 12-month and Predicted 12-month performances for each measure. R2 = proportion of variability accounted for by correlation between Observed 12-month and Predicted 12-month cognitive scores. p value = significance of paired sample t tests Observed 12-month and Predicted 12-month cognitive scores. Effect Size = Cohen’s d value for paired sample t tests. All correlations greater than r = .25 were significant at p < .001.
Cross-Validation of the SRB Equations and Creation of Combined SRBs
In order to potentially combine the development and validation samples and create a larger and more robust sample for the purposes of creating SRB prediction equations, establishment of equivalence between SRB prediction equations created from the development and validation samples are necessary. To do so, bivariate correlations between 12-month Predicted scores derived from the development sample and the validation sample were compared as a test of Goodness-of-fit. As can be seen in Table 6, 12-month Predicted scores were highly correlated with each other, with 14 of the 17 comparisons resulting in an r value ≥ .88 (R2 ≥ .77). Bland Altman plots for RAVLT Total Recall and RAVLT Delayed Recall suggest that only a handful of differences in Predicted values between the development and validation samples were beyond 95% confidence intervals (Figure 2).
Table 6.
Predicted 12-month cognitive scores for each measure derived from SRBs created from the development and validation samples, and applied to the validation sample.
| SRBs created from Development Sample | SRBs created from Validation Sample | r | R2 | |
|---|---|---|---|---|
| RAVLT | ||||
| Total Recall | 44.68 (7.5) | 44.49 (7.4) | .98 | .96 |
| Delayed Recall | 9.30 (2.3) | 7.92 (2.6) | .98 | .96 |
| Logical Memory | ||||
| Immediate Recall | 14.85 (1.8) | 13.78 (1.9) | .94 | .88 |
| Delayed Recall | 14.90 (2.6) | 15.55 (1.9) | .76 | .58 |
| ADAS-Cog | 8.37 (3.0) | 8.62 (3.1) | .98 | .96 |
| Clock Drawing | 4.72 (0.3) | 5.00 (0.2) | .69 | .48 |
| Clock Copy | 5.06 (0.1) | 5.08 (0.1) | .77 | .59 |
| DS Forward | 8.62 (1.3) | 8.97 (1.3) | .96 | .92 |
| DS Backward | 7.06 (1.7) | 7.16 (1.4) | .89 | .79 |
| Digit Symbol | 48.96 (9.9) | 49.34 (8.8) | .98 | .96 |
| Animal Fluency | 21.89 (3.7) | 21.19 (3.5) | .92 | .85 |
| Vegetable Fluency | 14.82 (3.3) | 12.77 (2.3) | .88 | .77 |
| TMT-A | 33.05 (6.8) | 32.78 (5.5) | .98 | .96 |
| TMT-B | 77.50 (18.5) | 78.50 (27.1) | .88 | .77 |
| BNT | 28.58 (1.3) | 26.39 (1.3) | .93 | .86 |
| MMSE | 29.24 (0.4) | 28.87 (0.4) | .68 | .46 |
| MOCA | 26.75 (1.4) | 26.50 (1.7) | .88 | .77 |
Note: All values in the second and third columns are Predicted 12-month scores for the respective cognitive measures. SRBs = Standardized Regression-Based prediction equations, RAVLT = Rey Auditory Verbal Learning Test, ADAS-Cog = Alzheimer’s Disease Assessment Scale – Cognition subscale, DS = Digit Span, TMT-A = Trail Making Test Part A, TMT-B = Trail Making Test Part B, BNT = Boston Naming Test, MMSE = Mini-Mental State Examination, MOCA = Montreal Cognitive Assessment. r = bivariate correlation between Predicted 12-month performances for each measure derived from development- and validation-sample based SRB prediction equations. All correlations were significant at p < .001.
Figure 2.
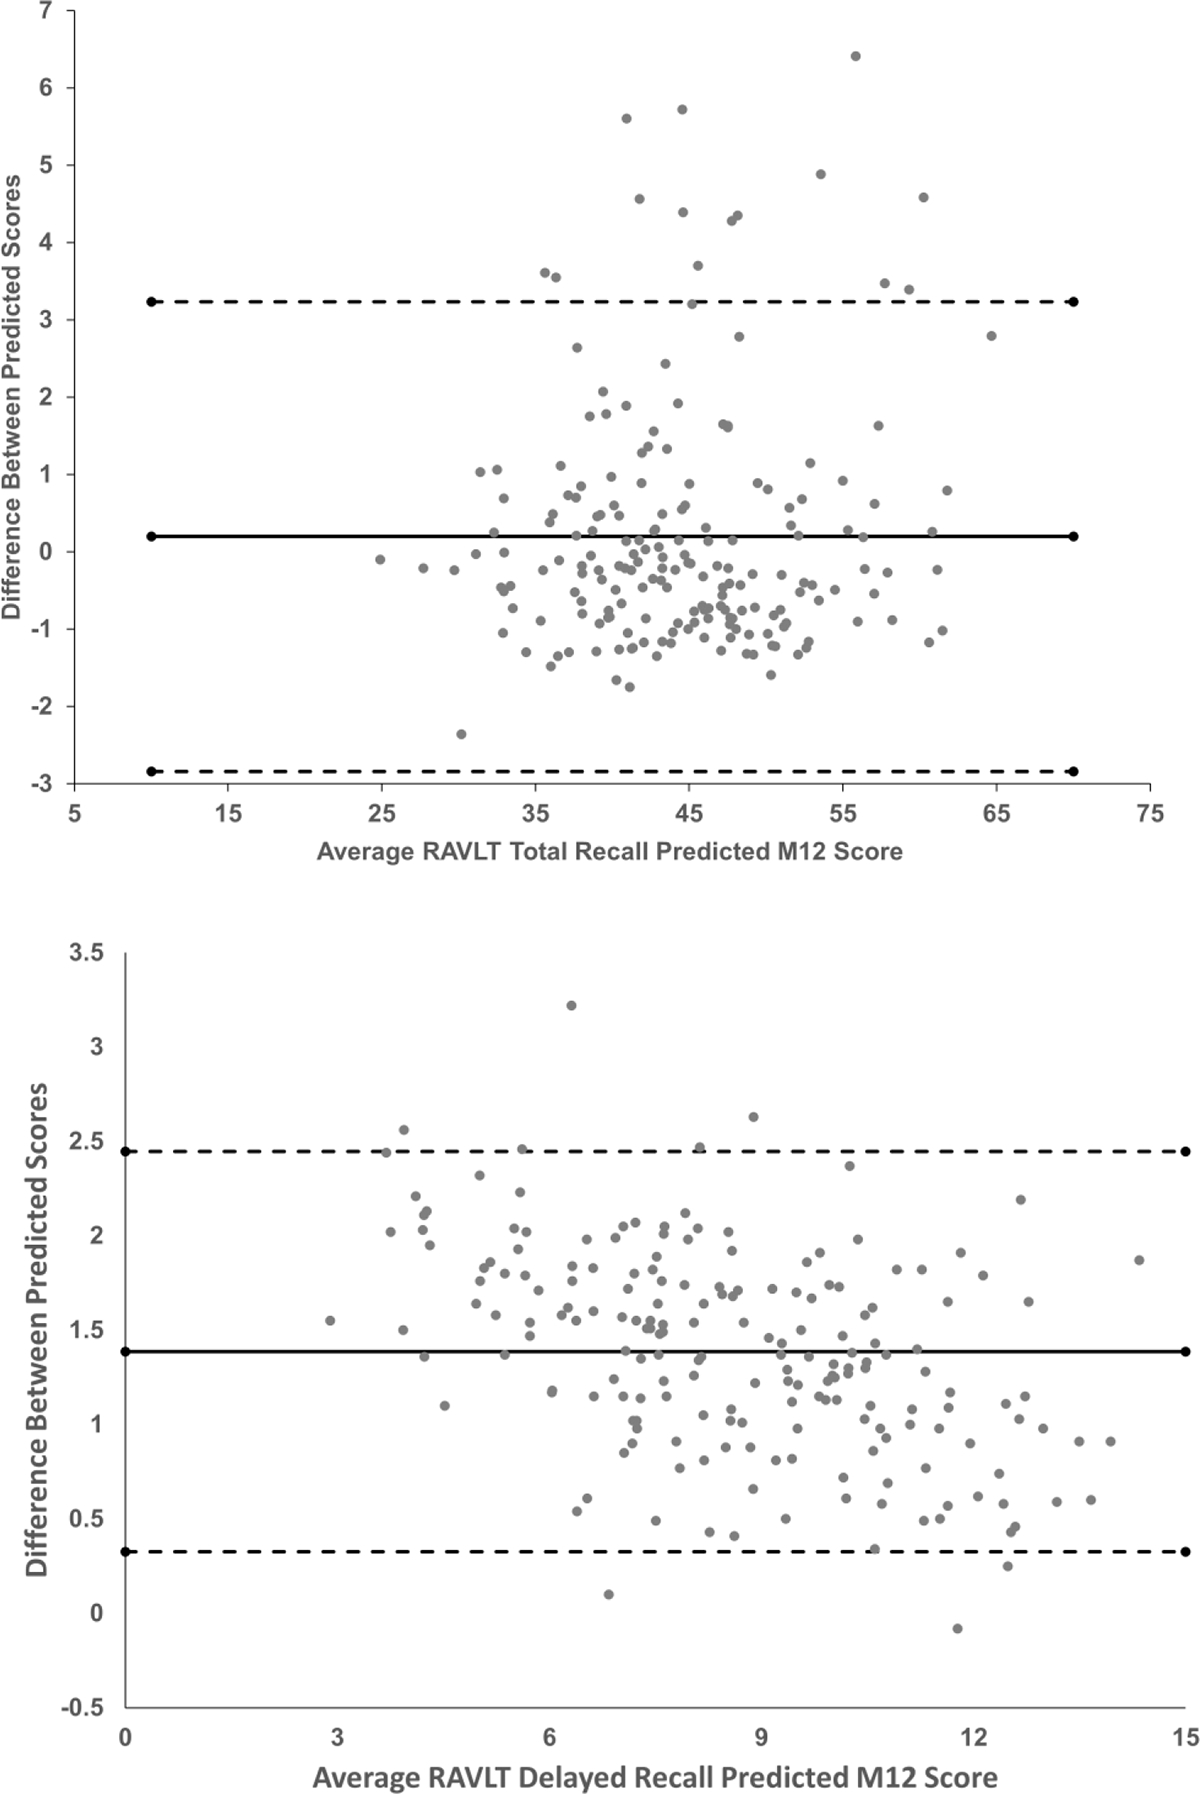
Bland Altman plots measuring the difference between Predicted M12 scores derived from standardized regression-based prediction equations from the development and validation samples. The top frame represents differences between M12 Predicted scores for RAVLT Total Recall, and the bottom frame represents differences between M12 Predicted scores for RAVLT Delayed Recall. The solid lines represent the mean difference between predicted scores, and the dashed lines represent 95% confidence intervals.
The results of the cross-validation analyses appear to suggest that the development and validation samples could be combined into a single sample. Consequently, the results of the prediction of T2 scores for each of the measures in the repeated cognitive battery are presented in Table 7 – based on the combined sample of 384 robustly cognitively intact participants. For each measure, the final model’s F(df), p value, R2, prediction equation, and SEest are listed. As can be observed, the final model predicting T2 (or 12-month) score accounted for a significant amount of variance for every measure in the repeated cognitive battery (p < .001 for all comparisons).
Table 7.
Regression equations for predicting 12-month Follow-up scores from the combined development and validation samples (n = 384).
| F(df), p | Predicted M12 | R 2 | SEest | ||
|---|---|---|---|---|---|
| RAVLT | Total Recall | F(7, 376) = 52.74, p < .001 | 22.19 + (BL*0.67) – (retest interval*0.04) – (M06 assessment*0.04) – (age*0.10) + (education*0.43) + (sex*2.56) + (ethnicity*2.84) | .50 | 7.48 |
| Delayed Recall | F(7, 376) = 34.14, p < .001 | 6.10 + (BL*0.58) – (retest interval*0.008) – (M06 assessment *0.98) – (age*0.04) + (education*0.15) + (sex*0.86) + (ethnicity*0.80) | .39 | 3.14 | |
| Logical Memory | Imm. Recall | F(7, 376) = 24.93, p < .001 | 8.51 + (BL*0.55) – (retest interval*0.01) – (M06 assessment *0.32) – (age*0.01) + (education*0.07) + (sex*1.02) + (ethnicity*0.58) | .32 | 2.80 |
| Delayed Recall | F(7, 376) = 28.46, p < .001 | 11.40 + (BL*0.65) – (retest interval*0.02) – (M06 assessment *0.61) – (age*0.03) + (education*0.08) + (sex*0.93) + (ethnicity*0.28) | .35 | 3.20 | |
| ADAS-Cog | F(7, 370) = 43.94, p < .001 | 1.42 + (BL*0.57) + (retest interval*0.01) – (M06 assessment *3.38) + (age*0.08) – (education*0.16) – (sex*1.01) – (ethnicity*0.39) | .45 | 3.32 | |
| Clock Drawing | F(7, 376) = 5.10, p < .001 | 4.11 + (BL*0.22) + (retest interval*0.001) – (M06 assessment *0.07) – (age*0.01) + (education*0.01) + (sex*0.04) – (ethnicity*0.03) | .09 | 0.59 | |
| Clock Copy | F(7, 375) = 4.73, p < .001 | 3.79 + (BL*0.18) + (retest interval*0.001) – (M06 assessment *0.02) – (age*0.005) + (education*0.01) + (sex*0.09) – (ethnicity*0.08) | .08 | 0.36 | |
| DS Forward | F(7, 185) = 22.78, p < .001 | 3.24 + (BL*0.67) + (retest interval*0.0081) – (M06 assessment *1.07) – (age*0.03) + (education*0.01) + (sex*0.01) – (ethnicity*0.17) | .46 | 1.47 | |
| DS Backward | F(7, 185) = 22.11, p < .001 | 0.65 + (BL*0.66) + (retest interval*0.006) + (M06 assessment *2.56) – (age*0.04) + (education*0.06) + (sex*0.19) – (ethnicity*0.61) | .46 | 1.71 | |
| Digit Symbol | F(7, 184) = 50.62, p < .001 | 17.46 + (BL*0.84) – (retest interval*0.005) – (M06 assessment *0.75) – (age*0.11) – (education*0.04) + (sex*1.79) + (ethnicity*0.47) | .66 | 6.38 | |
| Animal Fluency | F(7, 376) = 43.22, p < .001 | 19.39 + (BL*0.57) – (retest interval*0.004) + (M06 assessment *0.26) – (age*0.13) + (education*0.12) – (sex*0.44) – (ethnicity*0.60) | .45 | 3.95 | |
| Veg. Fluency | F(7, 185) = 20.99, p < .001 | 10.58 + (BL*0.58) – (retest interval*0.005) + (M06 assessment *0.91) – (age*0.11) + (education*0.17) + (sex*1.52) – (ethnicity*0.14) | .44 | 3.14 | |
| TMT-A | F(7, 374) = 36.46, p < .001 | 17.92 + (BL*0.48) – (retest interval*0.04) – (M06 assessment *1.33) + (age*0.27) – (education*0.27) – (sex*1.04) + (ethnicity*0.05) | .41 | 7.67 | |
| TMT-B | F(7, 374) = 28.21, p < .001 | −16.84 + (BL*0.47) – (retest interval*0.07) – (M06 assessment *9.44) + (age*1.23) – (education*0.83) – (sex*1.86) + (ethnicity*15.25) | .35 | 32.17 | |
| BNT | F(7, 346) = 47.36, p < .001 | 15.98 + (BL*0.56) – (retest interval*0.003) – (M06 assessment *0.02) – (age*0.04) + (education*0.04) – (sex*0.07) + (ethnicity*0.16) | .49 | 1.26 | |
| MMSE | F(7, 376) = 5.76, p < .001 | 22.25 + (BL*0.30) + (retest interval*0.001) – (M06 assessment *0.19) – (age*0.03) + (education*0.001) + (sex*0.12) + (ethnicity*0.007) | .10 | 1.23 | |
| MOCA | F(7, 183) = 15.00, p < .001 | 17.66 + (BL*0.47) – (retest interval*0.003) – (M06 assessment *0.30) – (age*0.08) + (education*0.17) + (sex*0.40) + (ethnicity*0.06) | .37 | 2.06 | |
Note: All scores are raw scores. RAVLT = Rey Auditory Verbal Learning Test, Imm. Recall = Immediate Recall, ADAS-Cog = Alzheimer’s Disease Assessment Scale – Cognition subscale, DS = Digit Span, Veg. Fluency = Vegetable Fluency, TMT-A = Trail Making Test Part A, TMT-B = Trail Making Test Part B, BNT = Boston Naming Test, MMSE = Mini-Mental State Examination, MOCA = Montreal Cognitive Assessment. Test interval is in days, age and education are in years, M06 assessment (6-month assessment) is coded as absent = 0 and present = 1, sex is coded as male = 1 and female = 2, and ethnicity is coded as Caucasian/Non-Hispanic = 1 and Non-Caucasian/Hispanic = 2. R2 = squared value of Pearson’s correlation coefficient for Baseline and 12-month scores, SEest = Standard error of the estimate.
DISCUSSION
The current study presents regression-based prediction equations designed to predict 12-month performance on the neuropsychological measures administered in ADNI, developed from a sample of participants enrolled in ADNI that remained cognitively intact and stable over 24 months. To our knowledge, this is the first study to develop such algorithms for ADNI, and permits the opportunity to discern meaningful change over 12 months from statistical artifact when applied to the remainder of ADNI participants.
Consistent with previous research (Duff et al., 2005; Gavett et al., 2015; Kiselica et al., 2020), baseline test performance, retest interval and the presence of previous evaluations, and demographic factors related to age, education, sex, and ethnicity were able to successfully predict 12-month test performance across all measures. When examining the amount of variance accounted for by the prediction equations for the combined sample, Table 7 shows that our 12-month SRB equations captured 8% to 66% of the variance (R2 = .08 – .66). This is comparable to the values of 14% to 62% observed in Kiselica et al. (2020) for the measures in the UDS 3.0 battery over 6 – 24 months, but is not quite as large as the values of 25% to 75% observed in Duff et al. (2005) for the Repeatable Battery for the Assessment of Neuropsychological Status (Randolph, 2012) over 12 months. Differences exist between Duff et al.’s development sample and the current combined sample that could account for these differential findings. For example, Duff et al.’s sample was not as well-characterized regarding their cognition at baseline or over time, and a review of their data (group means and SDs) suggests that a portion of that sample may have been mildly cognitively impaired. This would not necessarily be surprising, as Duff et al.’s developmental sample was selected from patients in primary care settings, and there is a known relationship between cognitive impairment and medical comorbidity in those settings (Duff, Mold, Roberts, & McKay, 2007). Conversely, our combined sample was selected for being robustly cognitively intact, which may have inadvertently restricted the range of baseline and follow-up performances on the neuropsychological measures. This restricted range may have diminished our ability to predict 12-month performance (Bland & Altman, 2011) relative to Duff et al., and subsequently account for the difference in findings.
Table 7 additionally shows that performance on baseline measures of processing speed, memory, and confrontation naming appear to consistently predict 12-month performance the most strongly of those measures in the ADNI battery (R2s of .66, .50, and .49 for Digit Symbol Test, RAVLT Total Recall, and Boston Naming Test, respectively). Conversely, performance on a set of primarily visuospatial tasks possessed the lowest predictive capacity (R2s of .08 and .09 for CCT and CDT, respectively). These performances correspond to the high R2 value for the naming test used in the UDS 3.0 (R2 = .62), and the low R2 value for the figure copy measure in the UDS 3.0 (R2 = .14; Kiselica et al., 2020). This result is also similar to the lowest R2 value from Duff et al. being for the figure copy subtest from the RBANS (R2 = .25). These consistently low predictive capacities for visuospatial measures are associated with their low 12-month test-retest reliability coefficients (rs of .20 to .29 in the current study, and r of .31 for Kiselica et al.’s figure copy measure). Such findings are also consistent with meta-analytic work from Calamia and colleagues (Calamia, Markon, & Tranel, 2013) indicating that across a broad set of neuropsychological domains assessed, a visual copying task (Rey Complex Figure Copy) displayed the second lowest test-retest reliability on average across a wide range of domains considered. Previous findings have also been made that performance on visual copy paradigms tends to result in the highest degree of inconsistency relative to other cognitive domains (Duff, Leber, et al., 2007), and our results suggest that both CDT and CCT were additionally highly skewed. This is important because with skewed data, the tail region may act as an outlier for regression-based statistical models, resulting in reduced predictive capacity and increased data mis-matching (Larasati, Hajji, & Dwiastuti, 2019). It has been suggested (Kiselica et al., 2020) that the subjectivity of the scoring criteria and the small range of possible scores for visual copy/drawing tasks may contribute to their relatively low test-retest reliability consistently observed across the literature, though further research is recommended to consider this phenomenon in greater detail.
In addition to developing prediction equations, the current study also assessed the utility of these regression-based formulae by cross-validating them in two sets of robustly cognitively intact participants from ADNI. No differences were observed for any demographic or testing variables between the development and validation samples, including for retest interval, age, education, sex, and ethnicity. Additionally, no differences between samples for baseline performance or 12-month performance were evident across tasks, nor for simple difference change over time, and coefficients of stability (Tables 2 – 4).
When considering improvement over time using the simple difference method of comparing observed test scores at baseline and follow-up for our current samples, no change in performance was observed over 12 months across most of the measures administered in the repeated cognitive battery. Specifically, of the two sets of analyses conducted for each of the 17 measures in the repeated cognitive battery at both 6 months and 12 months, only ADAS-Cog, Logical Memory Immediate Recall, and Boston Naming Test reflected significantly stronger performances at follow-up than at baseline – and the effect sizes for these analyses were relatively small (ds = | .21 to .32 |). To ensure that the 6-month evaluation for some participants was not introducing methodological bias into the study, examination of change between baseline and 6-months (for those relevant participants) and between 6-months and 12-months revealed no meaningful gains (analyses available upon request). Overall, this suggested that the current sample displayed minimal improvements over time across multiple cognitive assessments. These results are supported by our values for M12 – BL Δ being consistently close to zero in Table 4. These findings are consistent with several studies that have suggested minimal or no practice effects being evident in cognitively normal samples when reassessed 6 to 24 months after baseline (Duff et al., 2010; Gavett et al., 2015; Kiselica et al., 2020). Additionally, Calamia and colleagues’ (Calamia et al., 2012) meta-analysis of 349 studies similarly suggested that practice effects over time across a variety of neuropsychological tests are likely relatively minimal in populations fitting our validation sample’s age, retest interval, and diagnosis category (i.e., normal cognition) – from 0.040, 0.041, 0.044, to 0.055 of a SD from baseline performance for measures of executive functioning, verbal memory, naming, and processing speed, respectively. It is likely that the length of the follow-up in the current study – approximately 12 months – contributed to this generally null finding, as other studies of short-term practice effects have tended to observe rather large benefit from repeated exposure across a variety of commonly administered cognitive measures, including for same-day repeat assessments (Pereira, Costa, & Cerqueira, 2015), and repetition within one week (Duff, 2014; Duff et al., 2010) or two weeks (Duff, Beglinger, et al., 2007).
Similarly, when applying SRB prediction equations to baseline performance and demographic factors/retest factors on these measures, our validation sample’s level of observed performance was within expectation of predictions across most measures administered. First, significant differences were only observed between predicted 12-month scores and observed 12-month scores in our validation sample for 4 of the 17 measures administered. No real consistency was observed among these significant variables in whether our prediction equations over- or under-predicted 12-month performance in our validation sample; observed 12-month performances were lower than predicted for Logical Memory Delayed Recall, Animal Fluency, and MOCA, and higher than predicted for RAVLT Delayed Recall. When examining the difference between observed and predicted 12-month scores for each of these significant cognitive measures, Table 5 shows that the mean differences ranged from | 0.81 to 1.07 | points, and likely would have been missed by studies with smaller sample sizes. Second, when the Goodness-of-fit was examined between 12-month Predicted scores derived from the development sample and the validation sample, it can be observed in Table 6 that the resultant 12-month Predicted scores were highly correlated with each other. Specifically, only 4 of 17 comparisons correlated below .87, and the average r across all measures was .89 (accounting for 79% of the variance). For example, as seen in the Bland Altman plots in Figure 2, few differences in RAVLT Total Recall and Delayed Recall Predicted M12 values between the development and validation samples exceeded 95% confidence intervals. Of these four measures with lower cross-validation correlations, as was indicated previously the test-retest reliability coefficients for CCT and CDT were appreciably low (e.g., r12 values of .20 to .29) and skewness was high, likely produced by ceiling/floor effects known to be associated with the measures. These low reliabilities suggest a heightened degree of instability in these measures, which likely explains their failure to perform within expectation in this study.
These findings support that the SRB equations for the ADNI battery provide a means of predicting the presence or absence of meaningful change over one year. Although both the simple difference method (M12 – BL Δ) and the predicted difference method (SRBs) resulted in similar findings, this is not unexpected when using matched samples that did not display practice effects over time. That said, the coefficients of stability for the measures in this battery tended to be lower than desired (Slick, 2006; Strauss, Sherman, & Spreen, 2006), suggesting overall lower re-test reliability. Specifically, only Digit Span Backward, Digit Symbol, Vegetable Fluency, and Boston Naming Test exceeded r12 ≥ .70 for the development sample, and only Digit Span Forward and Digit Symbol did so for the validation sample. While these findings raise concern for the suitability of the remainder of the ADNI battery to make judgements about change over time, it is important to emphasize that 1) many of the measures in question are already commonly used in both research and clinical practice (e.g., RAVLT, Logical Memory, TMT-B, Animal Fluency Test, etc.) despite this low reliability, and 2) at present decisions about change in ADNI are being made without any systematic attempts to clarify meaningful change. As such, while some caution should be considered for measuring true cognitive change over time – particularly in clinical samples – these SRBs reflect an improvement over current practice in ADNI.
Finally, a case example may be beneficial to highlight the potential impact of using these SRB prediction equations for participants administered neuropsychological testing in ADNI. Let’s suppose that a 69-year-old woman with 16 years of education was tested three times over a 12-month period, and her Observed Baseline and 12-month Follow-up scores on RAVLT Total Recall and Delayed Recall are presented in Table 8. Her scores decline by 13 points at Follow-up for Total Recall, and by 4 points for Delayed Recall. Although these lower scores at follow-up may seem like apparent declines over 12 months, when considering normative expectations based on published norms, her 12-month performances remain in the low-average range (T = 40) for Total Recall and the average range (T = 44) for Delayed Recall. However, when comparing her Observed 12-month performance to her Predicted 12-month performance based on the SRB prediction equations generated from this development sample of robustly intact older adults, her RAVLT Total Recall score reflects a statistically significant decline beyond expectation (z = −1.69). Upon closer inspection of the predicted 12-month Follow-up score, stability in performance was expected at T3 for Total Recall; instead, our example’s performance declined by 13. While a similar trend was observed for RAVLT Delayed Recall, it failed to reach the significance threshold of z = −1.645; as a result, a deviation of 4 points given our participant’s demographics and baseline performance is not beyond expectation. As applied to the ADNI cohort, the application of these SRB prediction formulae permit the calculation of meaningful thresholds or cut-points for change over time at the level of the individual – which allows for the determination of whether change occurred for an individual participant. As such, the use of these prediction equations permits for more accurate categorization of those who improved/decline over time versus those who remained stable in ADNI.
Table 8.
Case Example
| Observed Baseline | Observed 12-month Follow-up | Observed Difference | Predicted 12-month Follow-up from combined SRBs | Predicted Difference from current SRBs | z score from current SRBs | |
|---|---|---|---|---|---|---|
| RAVLT | ||||||
| Total Recall | 48 | 35 | −13 | 47.65 | −12.65 | −1.69* |
| Delayed Recall | 11 | 7 | −4 | 10.74 | −3.74 | −1.19 |
Note: Observed Difference = Observed 12-month Follow-up – Observed Baseline. Predicted 12-month Follow-up scores are derived from the regression formula from Predicted Difference = Observed 12-month Follow-up – Predicted 12-month Follow-up. z = Predicted Difference/ SEest. RAVLT = Rey Auditory Verbal Learning Test.
p < .05.
Note: Observed Difference = Observed Follow-up – Observed Baseline. Predicted Follow-up scores are derived from the regression formula from Duff et al. Predicted Difference = Observed Follow-up – Predicted Follow-up. z = Predicted Difference/ SEest. * p < .05.
The current study is not without limitations. First, these findings are specific to the cognitive measures administered in this battery over a retest interval of 12-months. As a result, it cannot be assumed that these results are generalizable to other measures of the same cognitive domains, different retest intervals, or use of alternative forms (Calamia et al., 2012). Of particular relevance, ADNI-specific modifications have been made to the test administration of several measures used in the battery (e.g., Logical Memory only includes “Story A”; Boston Naming Test only includes the odd-items), and many common ADNI measures have not been updated reflect test advancement over time (e.g., Digit Span and Digit Symbol are both from the WAIS-R developed in 1987). These modifications/test selections have led to different score outputs for the respective measures than what is typically obtained in clinical and research settings at the present time, therefore our SRB equations are only appropriate for use with complimentary test administration rules and matching versions of the measures. Second, these results do not apply to all measures used across ADNI protocols. Specifically, given the recency of the addition of the Multilingual Naming Test (MINT; Gollan, Weissberger, Runnqvist, Montoya, & Cera, 2012) to ADNI-3, sample sizes of robustly intact participants were too small (n = 28) to generate prediction equations for this variable. Third, the nature of ADNI recruitment resulted in our sample being primarily Caucasian, highly educated, and possessing a strong premorbid intellect. Therefore, the generalizability of these findings in samples with greater ethnic and educational/intellectual heterogeneity is unknown. In particular, only approximately 10% of either the development or validation samples was non-Caucasian, therefore it is not fully clear how these SRB equations predict 12-month cognitive performance in ethnic minority populations. Fourth, ADNI uses rigorous exclusion criteria typical of clinical trials, therefore our study cohort might not be representative of the general population in terms of medical comorbidity or levels of self-reported depression. Fifth, the current SRB formulae were developed and cross-validated within robustly intact older adults, therefore they do not provide information on cognitive prediction in other disease states (e.g., MCI, AD, or Fronto-Temporal Dementia). As such, future work is recommended to examine the validity of these prediction equations across a variety of neurodegenerative conditions. Sixth, although we chose to use raw scores in our SRB models, it is possible that SRB models stratified by different demographic variables (e.g., sex-based stratification in O’Connell, Gould, Ursenbach, Enright, & Morgan, 2018) may result in more accurate predictions. This will be an important investigation for future research. Seventh, ADNI protocols (ADNI1, 2004; ADNI2, 2011; ADNI3, 2016; ADNIGO, 2009) used the same test forms for all measures, with the exception of using different versions of the word list on the ADAS-Cog subtests of Word Recall and Delayed Recall at different test administrations. However, it was not felt that this significantly contributed to the test results for ADAS-Cog, as the subtests that incorporate the word list account for only 20 points out of a possible 85, and it has previously been shown that the use of alternate forms does not attenuate all benefits of practice effects (Beglinger et al., 2005; Calamia et al., 2012). Eighth, the fact that ADNI protocols administer three separate word-list tasks in their standard battery during a single assessment may have led to possible interference effects for some ADNI participants. Lastly, of the 384 participants in the study, only 36 did not receive a 6-month evaluation. Consequently, extensive investigation into the possibility of methodological bias was undertaken, which demonstrated that there was no meaningful difference between those who were evaluated three times and those evaluated twice over 12 months. Analysis of variance indicated that there was no coherent pattern of improvement from baseline to 6 months, or from 6 months to 12 months, nor were there differences in 12-month performance between participants evaluated three times versus twice. However, we acknowledge that it is possible that the presence of a 6-month evaluation may have influenced the results for select individual participants. Despite these limitations, however, our results – including both the creation and cross-validation of standardized regression-based prediction equations – will permit greater confidence than current practice when predicting cognitive performance in ADNI on these measures over one year.
Funding and Acknowledgements:
Data collection and sharing for this project was funded by the Alzheimer’s Disease Neuroimaging Initiative (ADNI) (National Institutes of Health Grant U01 AG024904) and DOD ADNI (Department of Defense award number W81XWH-12-2-0012). ADNI is funded by the National Institute on Aging, the National Institute of Biomedical Imaging and Bioengineering, and through generous contributions from the following: AbbVie, Alzheimer’s Association; Alzheimer’s Drug Discovery Foundation; Araclon Biotech; BioClinica, Inc.; Biogen; Bristol-Myers Squibb Company; CereSpir, Inc.; Cogstate; Eisai Inc.; Elan Pharmaceuticals, Inc.; Eli Lilly and Company; EuroImmun; F. Hoffmann-La Roche Ltd and its affiliated company Genentech, Inc.; Fujirebio; GE Healthcare; IXICO Ltd.; Janssen Alzheimer Immunotherapy Research & Development, LLC.; Johnson & Johnson Pharmaceutical Research & Development LLC.; Lumosity; Lundbeck; Merck & Co., Inc.; Meso Scale Diagnostics, LLC.; NeuroRx Research; Neurotrack Technologies; Novartis Pharmaceuticals Corporation; Pfizer Inc.; Piramal Imaging; Servier; Takeda Pharmaceutical Company; and Transition Therapeutics. The Canadian Institutes of Health Research is providing funds to support ADNI clinical sites in Canada. Private sector contributions are facilitated by the Foundation for the National Institutes of Health (www.fnih.org). The grantee organization is the Northern California Institute for Research and Education, and the study is coordinated by the Alzheimer’s Therapeutic Research Institute at the University of Southern California. ADNI data are disseminated by the Laboratory for Neuro Imaging at the University of Southern California.
Footnotes
Data used in preparation of this article were obtained from the Alzheimer’s Disease Neuroimaging Initiative (ADNI) database (adni.loni.usc.edu). As such, the investigators within the ADNI contributed to the design and implementation of ADNI and/or provided data but did not participate in analysis or writing of this report. A complete listing of ADNI investigators can be found at: http://adni.loni.usc.edu/wp-content/uploads/how_to_apply/ADNI_Acknowledgement_List.pdf
REFERENCES
- ADNI1. (2004). Alzheimer’s Disease Neuroimaging Initiative: ADNI Procedures Manual. Retrieved from http://adni.loni.usc.edu/wp-content/uploads/2010/09/ADNI_GeneralProceduresManual.pdf
- ADNI2. (2011). Alzheimer’s Disease Neuroimaging Initiative: ADNI2 Procedures Manual. Retrieved from https://adni.loni.usc.edu/wp-content/uploads/2008/07/adni2-procedures-manual.pdf
- ADNI3. (2016). Alzheimer’s Disease Neuroimaging Initiative: ADNI3 Procedures Manual. Retrieved from https://adni.loni.usc.edu/wp-content/uploads/2012/10/ADNI3-Procedures-Manual_v3.0_20170627.pdf
- ADNIGO. (2009). Alzheimer’s Disease Neuroimaging Initiative: ADNI Grand Opportunities Procedures Manual. Retrieved from http://adni.loni.usc.edu/wp-content/uploads/2008/07/ADNI_GO_Procedures_Manual_06102011.pdf
- Attix DK, Story TJ, Chelune GJ, Ball JD, Stutts ML, Hart RP, & Barth JT (2009). The prediction of change: normative neuropsychological trajectories. Clin Neuropsychol, 23(1), 21–38. doi: 10.1080/13854040801945078 [DOI] [PubMed] [Google Scholar]
- Bartels C, Wegrzyn M, Wiedl A, Ackermann V, & Ehrenreich H (2010). Practice effects in healthy adults: a longitudinal study on frequent repetitive cognitive testing. BMC Neurosci, 11, 118. Retrieved from http://www.ncbi.nlm.nih.gov/pubmed/20846444 [DOI] [PMC free article] [PubMed] [Google Scholar]
- Barth JT, Pliskin N, Axelrod B, Faust D, Fisher J, Harley JP, . . . Silver C. (2003). Introduction to the NAN 2001 Definition of a Clinical Neuropsychologist. NAN Policy and Planning Committee. Arch Clin Neuropsychol, 18(5), 551–555. Retrieved from https://www.ncbi.nlm.nih.gov/pubmed/14591449 [PubMed] [Google Scholar]
- Beglinger LJ, Gaydos B, Tangphao-Daniels O, Duff K, Kareken DA, Crawford J, . . . Siemers ER. (2005). Practice effects and the use of alternate forms in serial neuropsychological testing. Arch Clin Neuropsychol, 20(4), 517–529. doi: 10.1016/j.acn.2004.12.003 [DOI] [PubMed] [Google Scholar]
- Bland JM, & Altman DG (2011). Correlation in restricted ranges of data. BMJ, 342, d556. doi: 10.1136/bmj.d556 [DOI] [PubMed] [Google Scholar]
- Calamia M, Markon K, & Tranel D (2012). Scoring higher the second time around: meta-analyses of practice effects in neuropsychological assessment. Clin Neuropsychol, 26(4), 543–570. Retrieved from http://www.ncbi.nlm.nih.gov/pubmed/22540222 [DOI] [PubMed] [Google Scholar]
- Calamia M, Markon K, & Tranel D (2013). The robust reliability of neuropsychological measures: meta-analyses of test-retest correlations. Clin Neuropsychol, 27(7), 1077–1105. doi: 10.1080/13854046.2013.809795 [DOI] [PubMed] [Google Scholar]
- Chelune G, & Duff K (2012). The assessment of change: Serial assessments in dementia evaluation New York, NY: Springer. [Google Scholar]
- Chelune G, Naugle R, Lüders H, Sedlak J, & Awad I (1993). Individual change following epilepsy surgery: Practice effects and base-rate information. Neuropscyhology, 1, 41–52. [Google Scholar]
- Crawford JR, & Garthwaite PH (2007). Using regression equations built from summary data in the neuropsychological assessment of the individual case. Neuropsychology, 21(5), 611–620. doi: 10.1037/0894-4105.21.5.611 [DOI] [PubMed] [Google Scholar]
- Crockford C, Newton J, Lonergan K, Madden C, Mays I, O’Sullivan M, . . . Abrahams S. (2018). Measuring reliable change in cognition using the Edinburgh Cognitive and Behavioural ALS Screen (ECAS). Amyotroph Lateral Scler Frontotemporal Degener, 19(1–2), 65–73. doi: 10.1080/21678421.2017.1407794 [DOI] [PMC free article] [PubMed] [Google Scholar]
- Duff K (2014). One-week practice effects in older adults: tools for assessing cognitive change. Clin Neuropsychol, 28(5), 714–725. doi: 10.1080/13854046.2014.920923 [DOI] [PMC free article] [PubMed] [Google Scholar]
- Duff K, Beglinger LJ, Moser DJ, Paulsen JS, Schultz SK, & Arndt S (2010). Predicting cognitive change in older adults: the relative contribution of practice effects. Arch Clin Neuropsychol, 25(2), 81–88. Retrieved from http://www.ncbi.nlm.nih.gov/pubmed/20064816 [DOI] [PMC free article] [PubMed] [Google Scholar]
- Duff K, Beglinger LJ, Schultz SK, Moser DJ, McCaffrey RJ, Haase RF, . . . Huntington’s Study, G. (2007). Practice effects in the prediction of long-term cognitive outcome in three patient samples: a novel prognostic index. Arch Clin Neuropsychol, 22(1), 15–24. doi: 10.1016/j.acn.2006.08.013 [DOI] [PMC free article] [PubMed] [Google Scholar]
- Duff K, Leber WR, Patton DE, Schoenberg MR, Mold JW, Scott JG, & Adams RL (2007). Modified scoring criteria for the RBANS figures. Appl Neuropsychol, 14(2), 73–83. doi: 10.1080/09084280701319805 [DOI] [PubMed] [Google Scholar]
- Duff K, Mold JW, Roberts MM, & McKay SL (2007). Medical burden and cognition in older patients in primary care: selective deficits in attention. Arch Clin Neuropsychol, 22(5), 569–575. doi: 10.1016/j.acn.2007.03.007 [DOI] [PubMed] [Google Scholar]
- Duff K, Schoenberg MR, Patton D, Mold J, Scott JG, & Adams RL (2004). Predicting change with the RBANS in a community dwelling elderly sample. J Int Neuropsychol Soc, 10(6), 828–834. Retrieved from https://www.ncbi.nlm.nih.gov/pubmed/15637773 [DOI] [PubMed] [Google Scholar]
- Duff K, Schoenberg MR, Patton D, Paulsen JS, Bayless JD, Mold J, . . . Adams RL. (2005). Regression-based formulas for predicting change in RBANS subtests with older adults. Arch Clin Neuropsychol, 20(3), 281–290. doi: 10.1016/j.acn.2004.07.007 [DOI] [PubMed] [Google Scholar]
- Durant J, Duff K, & Miller JB (2019). Regression-based formulas for predicting change in memory test scores in healthy older adults: Comparing use of raw versus standardized scores. J Clin Exp Neuropsychol, 41(5), 460–468. doi: 10.1080/13803395.2019.1571169 [DOI] [PMC free article] [PubMed] [Google Scholar]
- Folstein MF, Folstein SE, & McHugh PR (1975). “Mini-mental state”. A practical method for grading the cognitive state of patients for the clinician. J Psychiatr Res, 12(3), 189–198. doi: 10.1016/0022-3956(75)90026-6 [DOI] [PubMed] [Google Scholar]
- Frerichs RJ, & Tuokko HA (2005). A comparison of methods for measuring cognitive change in older adults. Arch Clin Neuropsychol, 20(3), 321–333. doi: 10.1016/j.acn.2004.08.002 [DOI] [PubMed] [Google Scholar]
- Gavett BE, Ashendorf L, & Gurnani AS (2015). Reliable Change on Neuropsychological Tests in the Uniform Data Set. J Int Neuropsychol Soc, 21(7), 558–567. doi: 10.1017/S1355617715000582 [DOI] [PMC free article] [PubMed] [Google Scholar]
- Gollan TH, Weissberger GH, Runnqvist E, Montoya RI, & Cera CM (2012). Self-ratings of Spoken Language Dominance: A Multi-Lingual Naming Test (MINT) and Preliminary Norms for Young and Aging Spanish-English Bilinguals. Biling (Camb Engl), 15(3), 594–615. doi: 10.1017/s1366728911000332 [DOI] [PMC free article] [PubMed] [Google Scholar]
- Goodglass H, & Kaplan E (1983). The assessment of aphasia and related disorders. Philadelphia: Lea & Febiger. [Google Scholar]
- Grober E, & Sliwinski M (1991). Development and validation of a model for estimating premorbid verbal intelligence in the elderly. J Clin Exp Neuropsychol, 13(6), 933–949. doi: 10.1080/01688639108405109 [DOI] [PubMed] [Google Scholar]
- Hammers DB, Duff K, & Apostolova LG (2022). Examining the role of repeated test exposure over 12 months across ADNI protocols. Alzheimers Dement (Amst), 14(1), e12289. doi: 10.1002/dad2.12289 [DOI] [PMC free article] [PubMed] [Google Scholar]
- Hammers DB, Suhrie KR, Dixon A, Porter S, & Duff K (2020). Reliable change in cognition over 1 week in community-dwelling older adults: a validation and extension study. Arch Clin Neuropsychol. doi: 10.1093/arclin/acz076 [DOI] [PMC free article] [PubMed] [Google Scholar]
- Heilbronner RL, Sweet JJ, Attix DK, Krull KR, Henry GK, & Hart RP (2010). Official position of the American Academy of Clinical Neuropsychology on serial neuropsychological assessments: the utility and challenges of repeat test administrations in clinical and forensic contexts. Clin Neuropsychol, 24(8), 1267–1278. doi: 10.1080/13854046.2010.526785 [DOI] [PubMed] [Google Scholar]
- Hinton-Bayre AD (2016). Clarifying Discrepancies in Responsiveness Between Reliable Change Indices. Arch Clin Neuropsychol, 31(7), 754–768. doi: 10.1093/arclin/acw064 [DOI] [PubMed] [Google Scholar]
- Iverson GL (2001). Interpreting change on the WAIS-III/WMS-III in clinical samples. Arch Clin Neuropsychol, 16(2), 183–191. Retrieved from http://www.ncbi.nlm.nih.gov/pubmed/14590186 [PubMed] [Google Scholar]
- Jacobson NS, & Truax P (1991). Clinical significance: a statistical approach to defining meaningful change in psychotherapy research. J Consult Clin Psychol, 59(1), 12–19. Retrieved from http://www.ncbi.nlm.nih.gov/pubmed/2002127 [DOI] [PubMed] [Google Scholar]
- Kaplan E, Goodglass H, & Weintraub S (1983). The Boston Naming Test. Philadelphia: Lea & Febiger. [Google Scholar]
- Kiselica AM, Kaser AN, Webber TA, Small BJ, & Benge JF (2020). Development and Preliminary Validation of Standardized Regression-Based Change Scores as Measures of Transitional Cognitive Decline. Arch Clin Neuropsychol. doi: 10.1093/arclin/acaa042 [DOI] [PMC free article] [PubMed] [Google Scholar] [Retracted]
- Knight RG, McMahon J, Skeaff CM, & Green TJ (2007). Reliable Change Index scores for persons over the age of 65 tested on alternate forms of the Rey AVLT. Arch Clin Neuropsychol, 22(4), 513–518. doi: 10.1016/j.acn.2007.03.005 [DOI] [PubMed] [Google Scholar]
- Larasati A, Hajji A, & Dwiastuti A (2019). The relationship between data skewness and accuracy of Artificial Neural Network predictive model. IOP Conference Series: Materials Science and Engineering, 523, 012070. doi: 10.1088/1757-899X/523/1/012070 [DOI] [Google Scholar]
- Lezak M, Howieson D, Bigler E, & Tranel D (2012). Neuropsychological Assessment (5th. ed.). New York: Oxford University Press. [Google Scholar]
- Lin SS, Fletcher E, Gavett BE, & Alzheimer’s Disease Neuroimaging I (2021). Reliable change in neuropsychological test scores is associated with brain atrophy in older adults. J Neuropsychol, 15(2), 274–299. doi: 10.1111/jnp.12226 [DOI] [PubMed] [Google Scholar]
- Marley CJ, Sinnott A, Hall JE, Morris-Stiff G, Woodsford PV, Lewis MH, & Bailey DM (2017). Failure to account for practice effects leads to clinical misinterpretation of cognitive outcome following carotid endarterectomy. Physiol Rep, 5(11). doi: 10.14814/phy2.13264 [DOI] [PMC free article] [PubMed] [Google Scholar]
- McSweeny A, Naugle RI, Chelune GJ, & Luders H (1993). “T-scores for change:” An illustration of a regression approach to depicting change in clinical neuropsychology. The Clinical Neuropsychologist 7, 300–312. [Google Scholar]
- Millis S (2003). Statistical practices: the seven deadly sins. Child Neuropsychol, 9(3), 221–233. doi: 10.1076/chin.9.3.221.16455 [DOI] [PubMed] [Google Scholar]
- Mohs RC, Knopman D, Petersen RC, Ferris SH, Ernesto C, Grundman M, . . . Thal LJ. (1997). Development of cognitive instruments for use in clinical trials of antidementia drugs: additions to the Alzheimer’s Disease Assessment Scale that broaden its scope. The Alzheimer’s Disease Cooperative Study. Alzheimer Dis Assoc Disord, 11 Suppl 2, S13–21. Retrieved from https://www.ncbi.nlm.nih.gov/pubmed/9236948 [PubMed] [Google Scholar]
- Morris JC (1993). The Clinical Dementia Rating (CDR): current version and scoring rules. Neurology, 43(11), 2412–2414. doi: 10.1212/wnl.43.11.2412-a [DOI] [PubMed] [Google Scholar]
- Morris JC, Heyman A, Mohs RC, Hughes JP, van Belle G, Fillenbaum G, . . . Clark C. (1989). The Consortium to Establish a Registry for Alzheimer’s Disease (CERAD). Part I. Clinical and neuropsychological assessment of Alzheimer’s disease. Neurology, 39(9), 1159–1165. doi: 10.1212/wnl.39.9.1159 [DOI] [PubMed] [Google Scholar]
- Nasreddine ZS, Phillips NA, Bedirian V, Charbonneau S, Whitehead V, Collin I, . . . Chertkow H. (2005). The Montreal Cognitive Assessment, MoCA: a brief screening tool for mild cognitive impairment. J Am Geriatr Soc, 53(4), 695–699. doi: 10.1111/j.1532-5415.2005.53221.x [DOI] [PubMed] [Google Scholar]
- O’Connell ME, Gould B, Ursenbach J, Enright J, & Morgan DG (2018). Reliable change and minimum clinically important difference (MCID) of the Repeatable Battery for the Assessment of Neuropsychology Status (RBANS) in a heterogeneous dementia sample: Support for reliable change methods but not the MCID. Appl Neuropsychol Adult, 1–7. doi: 10.1080/23279095.2017.1413575 [DOI] [PubMed] [Google Scholar]
- Ouimet LA, Stewart A, Collins B, Schindler D, & Bielajew C (2009). Measuring neuropsychological change following breast cancer treatment: an analysis of statistical models. J Clin Exp Neuropsychol, 31(1), 73–89. doi: 10.1080/13803390801992725 [DOI] [PubMed] [Google Scholar]
- Pereira DR, Costa P, & Cerqueira JJ (2015). Repeated Assessment and Practice Effects of the Written Symbol Digit Modalities Test Using a Short Inter-Test Interval. Arch Clin Neuropsychol, 30(5), 424–434. doi: 10.1093/arclin/acv028 [DOI] [PubMed] [Google Scholar]
- Randolph C (2012). Repeatable Battery for the Assessment of Neuropsychological Status. Bloomington, MN: The Psychological Corporation. [Google Scholar]
- Reitan R (1992). Trail Making Test: Manual for administration and scoring. Tucson, AZ: Reitan Neuropsychology Laboratory. [Google Scholar]
- Rinehardt E, Duff K, Schoenberg M, Mattingly M, Bharucha K, & Scott J (2010). Cognitive change on the repeatable battery of neuropsychological status (RBANS) in Parkinson’s disease with and without bilateral subthalamic nucleus deep brain stimulation surgery. Clin Neuropsychol, 24(8), 1339–1354. doi: 10.1080/13854046.2010.521770 [DOI] [PubMed] [Google Scholar]
- Sanchez-Benavides G, Pena-Casanova J, Casals-Coll M, Gramunt N, Manero RM, Puig-Pijoan A, . . . Team, N. S. (2016). One-Year Reference Norms of Cognitive Change in Spanish Old Adults: Data from the NEURONORMA Sample. Arch Clin Neuropsychol, 31(4), 378–388. doi: 10.1093/arclin/acw018 [DOI] [PubMed] [Google Scholar]
- Sawrie SM, Chelune GJ, Naugle RI, & Luders HO (1996). Empirical methods for assessing meaningful neuropsychological change following epilepsy surgery. J Int Neuropsychol Soc, 2(6), 556–564. doi: 10.1017/s1355617700001739 [DOI] [PubMed] [Google Scholar]
- Schmidt M (1996). Rey Auditory Verbal Learning Test : RAVLT : a handbook. Los Angeles, CA: Western Psychological Services. [Google Scholar]
- Sheikh JI, & Yesavage J (1986). Geriatric Depression Scale (GDS): Recent evidence and development of a shorter version. Clinical Gerontologist, 5, 165–172. [Google Scholar]
- Slick D (2006). Psychometrics in Neuropsychological Assessment. In Strauss E, Sherman E, & Spreen O (Eds.), A Compendium of Neuropsychological Tests (pp. 1–43). New York: Oxford University Press. [Google Scholar]
- Stein J, Luppa M, Brahler E, Konig HH, & Riedel-Heller SG (2010). The assessment of changes in cognitive functioning: reliable change indices for neuropsychological instruments in the elderly - a systematic review. Dement Geriatr Cogn Disord, 29(3), 275–286. doi: 10.1159/000289779 [DOI] [PubMed] [Google Scholar]
- Strauss E, Sherman EMS, & Spreen O (2006). A compendium of neuropsychological tests: Administration, norms, and commentary (Third Edition ed.). New York, NY: Oxford University Press. [Google Scholar]
- Wechsler D (1981). Wechsler Adult Intelligence Scale - Revised. San Antonio: Psychological Corporation. [Google Scholar]
- Wechsler D (1987). WMS-R : Wechsler Memory Scale--Revised : manual. San Antonio: Psychological Corp. [Google Scholar]
- Weiner MW, Veitch DP, Aisen PS, Beckett LA, Cairns NJ, Green RC, . . . Alzheimer’s Disease Neuroimaging, I. (2017). The Alzheimer’s Disease Neuroimaging Initiative 3: Continued innovation for clinical trial improvement. Alzheimers Dement, 13(5), 561–571. doi: 10.1016/j.jalz.2016.10.006 [DOI] [PMC free article] [PubMed] [Google Scholar]