

Abstract
Molecular dynamics simulations of mixtures of the ceramide N-(tetracosanoyl)-sphingosine (NS), cholesterol, and a free fatty acid are performed to gain a molecular-level understanding of the structure of the lipids found in the stratum corneum layer of skin. A new coarse-grained force field for cholesterol was developed using the multistate iterative Boltzmann inversion method (MS-IBI). The coarse-grained cholesterol force field is compatible with previously developed coarse-grained force fields for ceramide NS, free fatty acids, and water, and validated against atomistic simulations of these lipids using the CHARMM force field. Self-assembly simulations of multilayer structures using these coarse-grained force fields are performed, revealing that a large fraction of the ceramides adopt extended conformations, which cannot occur in the single bilayer in water structures typically studied using molecular simulation. Cholesterol fluidizes the membrane by promoting packing defects and an increase in cholesterol content is found to reduce the bilayer thickness, due to an increase in interdigitation of the C24 lipid tails, consistent with experimental observations. Using a reverse-mapping procedure, a self-assembled coarse-grained multilayer system is used to construct an equivalent structure with atomistic resolution. Simulations of this atomistic structure are found to closely agree with experimentally derived neutron scattering length density profiles. Significant interlayer hydrogen bonding is observed in the inner layers of the atomistic multilayer structure that are not found in the outer layers in contact with water or in equivalent bilayer structures. This work highlights the importance of simulating multilayer structures, as compared to the more commonly studied bilayer systems, to enable more appropriate comparisons with multilayer experimental membranes. These results also provide validation of the efficacy of the coarse-grained force fields and the framework for multiscale simulation.
Graphical Abstract

Introduction
The visible, outermost skin layer, called the stratum corneum (SC), is essential for skin’s role as a barrier to water loss from the body and invasion of toxic chemicals and infectious agents into the body. The SC is organized into a brick-and-mortar like arrangement in which corneocytes (the bricks) are surrounded by a dense, lamellar-structured lipid matrix (the mortar). This lipid matrix is a complex mixture of ceramides (CERs), cholesterol (CHOL), and free fatty acids (FFAs), with a distribution of carbon chain lengths in both the CERs and FFAs. CERs are two-tailed lipids in which a fatty acid chain is connected by an amide bond to a sphingoid base. At least 22 different subclasses of CERs have been identified in human SC with those combining a nonhydroxy (N) or alpha hydroxy (A) fatty acid chain with either a 6-hydroxy-sphingosine (H) or phytosphingosine (P) chain, designated as CERs NH, NP, AH, and AP,1 being most common.2–4 The structure and composition of this lipid matrix are crucial for a properly functioning skin barrier.5 Small angle X-ray diffraction (SAXD) studies of healthy human SC reveal two coexisting crystalline lamellar phases with repeat distances of ~13 nm for the long periodicity phase (LPP) and ~6 nm for the short-periodicity phase (SPP).6,7 Compared with healthy skin, the SC lipids in many skin diseases, such as psoriasis and atopic dermatitis, exhibit altered compositions, abnormal lamellar arrangements, and an impaired skin barrier.5,8–10
Various experimental models with well-defined compositions of a limited number of lipid molecules have been used to study the relationships between SC lipid composition, structure and barrier function.11–16 Compositions of the experimental synthetic lipid model that has been studied most, called the SC substitute (SCS), are based on porcine SC lipids, in which CER nonhydroxy sphingosine (CER NS) is the most abundant CER. One of these, which forms the SPP without the LPP (SCSSPP), can closely mimic the phase behavior and lateral organization of the SPP in human SC.17–19 This SCSSPP mixture contains five CERs (NS C24, NP C24, AS C24, and AP C24 and C16, where C24 and C16 designate fatty acid chain lengths of 24 and 16 carbons, respectively), although predominantly (60 mole %) CER NS C24, combined with equimolar amounts of CHOL and a mixture of FFAs with tail lengths ranging from C16-C26.17,18 Even simpler mixtures containing as few as three components (CER NS C24, CHOL, and FFA C24), can mimic characteristic behaviors of the SCSSPP.20,21 For example, the lamellar repeat distance of the equimolar version of this three-component mixture, identified here as the SCSSPP,min is the same (5.4 nm) as observed for the SCSSPP.17,22
Several insights into the formation and structure of the SPP as well as the role of CHOL specifically have been derived from studies of these synthetic lipid mixtures. For instance, using SAXD and Fourier Transform Infrared (FTIR) spectroscopy of SCSSPP samples prepared with varying amounts of CHOL, Mojumdar et al.19 observed that (i) CHOL is required to form the SPP and to enhance formation of the dense orthorhombic lateral packing, (ii) phase separated crystalline CHOL is present, and (iii) the repeat distance for the SPP is constant for CHOL/CER mole ratios between 0.2 and 1. Likewise, in comparisons of SCSSPP,min mixtures prepared with CER:CHOL:FFA mole ratios of 1:0.45:1 and 1:1:1, the repeat distances were the same, and phase separated CHOL was only detected in the high CHOL mixture.20,21 In neutron diffraction studies of the SCSSPP formulated with selectively deuterated molecules, CERs were determined to be arranged symmetrically, the CHOL headgroups were found to lie slightly inward from the unit cell boundary, and the FFA headgroups were located at the unit cell boundary with the tips of their tails interdigitating in the unit cell center.19 Using FTIR and selectively deuterated molecules in the SCSSPP,min mixture, Skolova et al.20 identified the presence of fully extended CER with its sphingosine and fatty acid tails associated preferentially with CHOL and FFA, respectively.
Experimental identification of lamellar and lateral lipid arrangements and molecular organization for even these simplified lipid systems is difficult, time consuming and costly. Increasingly, researchers have turned to molecular dynamics (MD) simulations as a useful tool for analyzing membrane properties at the atomistic level, and for relating microscopic details of the system with macroscopic properties observed in experiments. For example, in simulations of bilayers containing an equimolar mixture of CER NS C24 and FFA C24, both Das et al.23 and Gupta et al.24 observed a decrease in bilayer thickness with a corresponding increase in interdigitation of FFA and CER’s fatty acid tails when CHOL was added. Adding CHOL also increased the area compressibility indicating a more rigid bilayer,23,24 while decreasing lipid tail order as indicated by a decrease in the nematic order parameter, which decreased further when FFA was reduced by half.24 Schmitt et al. examined mixtures of CER NS C24, CER AP C24, CHOL and FFA C24 in 0.67:0.33:0.7:1 and 0.33:0.67:0.7:1 ratios using both experimental neutron scattering as well as atomistic molecular dynamics simulations.25 The simulations revealed trends in the lipid tilt angle and axial position, which matched experimental results. In simulations of an equimolar mixture of CER NS C24, CHOL and FFA C24, Gupta et al.24 found that CER hydrogen bonds with both other CERs and other lipids, while CHOL only hydrogen bonds with CERs and FFAs. In a related system, Moore et al.26 found that increasing CHOL content in bilayers of CER NS C24 and CHOL increased interdigitation, with a corresponding decrease in bilayer thickness and increased density in the center of the tail region, and resulted in fewer hydrogen bonds between lipids. Adding FFA C24 to the equimolar CER NS C24:CHOL system increased the bilayer thickness with a further decrease in the number of hydrogen bonds. Moore et al. also measured the in-plane lipid-lipid coordination number, a measure of the number of molecules within the first coordination shell (i.e. nearest neighbors). FFA molecules in bilayers containing equimolar CER NS C24, CHOL and FFA C24 were observed to have a higher in-plane lipid-lipid coordination number (2.3) with other FFA tails than for the randomly mixed system (1.5), suggesting that FFA molecules prefer to neighbor other FFA molecules.26 In a study of high and low hydration (30 compared with 2 water molecules per lipid) of CER NS C24, CHOL, and FFA C24 bilayers with 1:1:1 and 1:1:0.5 mole ratios, Del Regno and Notman27 observed formation of CHOL-rich regions, which were absent in the low hydration systems where water formed disconnected flattened pools in the headgroup region.
The simulation results described above illustrate the power of this tool for studying SC lipids. However, MD simulations of atomistic models, which calculate interactions between all atoms in the system, have a high computational cost that limits the size and timescales that can be reasonably studied. In addition, lipid mobility in the rigid gel-phase organization of the SC lamellae requires much longer simulation times to reach equilibrium than in more commonly studied fluid-phase membranes. As a consequence, almost all atomistic simulations thus far have used preassembled membrane configurations, rather than self-assembling membranes from isotropic mixtures, and, unless careful equilibration procedures are used, the final configuration of the simulation may not be able to adequately decorrelate from the initial configuration, thereby biasing the results.26,28
To date most atomistic simulation studies have focused almost exclusively on hydrated bilayer structures, in which lipid conformations are dictated by the lipid-water interface, whereas, lipid lamellae in the SC include many layers and are largely dehydrated with minimal water contact.17 Furthermore, in these bilayer simulations, CER molecules are restricted to the hairpin conformation (Figure 1f and 1g). This is not the case for the SPP in experimental multilayer systems, which exhibit a mixture of hairpin and extended conformations.17,20 While atomistic simulations of larger, multilayer structures, which include lipid-lipid interfaces, are possible, lipid conformation and in-plane morphological arrangement will tend to remain close to their initial pre-assembled configurations26 because transitions between hairpin and extended conformations, and movement from one leaflet (defined as half a bilayer) to another, or from well-mixed systems to lipid clusters are unlikely to occur over the currently feasible timescales for these systems. Given these potential limitations, self-assembly is a possible route toward examining lipid membrane configurations that arise naturally, rather than an assumed pre-assembled structure, similar to the experiments using model SC lipid systems.11–16 However, the computational cost associated with self-assembly of SC lipids is unrealistic for atomistic models at present.
Figure 1:

a) CG mapping scheme for CHOL, where the A, B, C, and D rings of the skeletal structure are labeled, c) FFA C24, and d) CER NS C24. In all cases, CG beads are spherically symmetric. CG representation of d) CHOL, e) FFA C24, f) CER NS C24 in a hairpin configuration, and e) CER NS C24 in an extended configuration. CG mappings are colored to be consistent with simulation renderings in this work: CHEAD is black, CBODY (i.e., RING1–4, CHME, CTAIL, CTERM beads) yellow, FHEAD is purple, TAIL and TER2 are gray, OH1 and OH2 are red, MHEAD2 is cyan, and AMIDE is blue.
MD simulations of coarse-grained (CG) models, which group 2–5 atoms and their bonded hydrogen atoms into a single interaction site (a CG bead), can be used to study longer timescales and larger system sizes than simulations of atomistic models. This is enabled by the reduced number of interactions that need to be computed at each timestep and the softening of those interactions relative to the atomistic system.29–32 As a result, CG simulations can be used to study self-assembly of mixed lipid lamellae once reliable CG models have been developed.
While numerous CG studies have been performed of phospholipids, similar studies for SC lipids, and CERs in particular, are in their infancy. The popular CG MARTINI model has been applied to a few SC lipids (CER NS29,33–36, CER AP30, CER NP37, CHOL38,39, and FFA38). However, the generic nature of the MARTINI force field parameters, which circumvents the need for extensive optimization, also limits MARTINI’s ability to accurately reproduce experimental and atomistic SC lipid membrane structures. 29,30,33–39
Hadley and McCabe developed the first CG model specifically optimized for SC lipids.40–42 Using the iterative Boltzmann inversion method (IBI), they optimized a CG force field to accurately reproduce the structure of pure atomistic systems of FFA and CHOL as well as mixtures thereof. A limitation of these models is that multiple force fields are required to reproduce fluid and ordered states in order to compensate for the poor state transferability of IBI-derived force fields.42 To address this issue, McCabe and co-workers subsequently developed CG force fields for CER NS,43 FFA,43 water,44 and the corresponding cross-interactions,32 using the multistate iterative Boltzmann inversion (MS-IBI) method. The MS-IBI approach, combined with a simulated wetting procedure to properly describe hydrophobic interactions, was found to enable the development of transferable force fields. Simulations using these CG force fields were shown to be in close agreement with their atomistic targets in terms of both bulk fluid and ordered structural properties, while also capturing the correct balance between hydrophobic and hydrophilic interactions necessary for the self-assembly of lamellar structures. Furthermore, these force fields have been used to study the self-assembly of SC lipids into bilayer and multi-lamellar structures.32,43 The multilayer results enable examination of inner bilayers (i.e., layers without bulk water contact) that are more representative of experiment and allow assessment of the preferred conformation of CERs, either extended or hairpin, in the lipid lamella.32,43 For example, in multilayer simulations performed using the MS-IBI optimized force fields, approximately 15% of the CERs adopted extended conformations in the inner layers in pure CER NS systems, which increased to approximately 25% for systems with a 1:1 mole ratio of CER NS C24 and FFA C24.32,43
By the nature of their construction, CG models are simpler than their atomistic counterparts and thus quantities that depend on atomistic level detail, such as hydrogen bonding or electron density, cannot be directly measured. Methods have thus been proposed to reverse-map CG systems to the atomistic level in order to generate atomistic configurations.26,27,45 So far, these methods have primarily been applied to fluid membranes, with only limited application to gel-phase membranes and models of the SC,30,46 likely due to the challenges associated with generating stable atomistic configurations for dense, highly ordered membranes. The development and implementation of such reverse-mapping algorithms for gel-phase membranes is essential for combining the ability to self-assemble large multilayer membranes using CG models with the accuracy of results obtained from atomistic simulations.
Here, we present a MS-IBI based CG model for CHOL using the mapping scheme for CHOL proposed by Hadley and McCabe,41 optimized to be compatible with MS-IBI models for water, CER NS, and FFA.32,43,44 The model is tested and validated through the study of a minimal model of the SPP phase containing CER NS, CHOL and FFA C24. We then explore the effects of CHOL concentration on self-assembled multilayer structures containing equimolar mixtures of CER NS C24 and FFA C24. In particular, we examine the tendency of CER NS to form hairpin rather than extended conformations in multilayer lipid lamella, along with analyses of the three-dimensional structural arrangements of the individual lipids within the multilayer structures. Finally, an atomistic multilayer system that mimics the CG conformations was constructed from the CG simulation results using a simple reverse-mapping approach and then used in atomistically detailed examinations of hydrogen bonding and the localization of atomic species.
Materials and Methods
To simulate a model SPP phase, a minimal 3-component system containing ceramide N-(tetracosanoyl)-sphingosine (NS) with a saturated acyl chain of C24, designated CER NS C24 mixed with CHOL, and FFA C24 has been studied. Although CER NS is not the most abundant CER in human SC, it is chosen here for the availability of experimental data for CER NS containing systems. In experiments, this mixture formed lamellar phases resembling the SPP at molar ratios of 1:1:1 and 1:0.45:1 for CER NS C24:CHOL:FFA C24, although we note that at the 1:1:1 ratio, a separate CHOL-rich domain is formed and thus the amount of CHOL in the SPP phase is lower than the nominal ratio.21 CG models for CER NS, FFA, and water were developed in previous work.32,43,44 The schemes for mapping atoms in CER NS C24 and FFA C24 to CG beads are shown in Figure 1; a CG water bead represents 4 water molecules.47 CER NS C16 and FFA C16 were also studied by eliminating the TER2 and two TAIL beads of the C24 fatty acid chain.
CHOL CG Model
The CG model for CHOL is shown in Figure 1a,d.41 In this mapping, proposed by Hadley and McCabe,41 nonbonded interactions of the CHOL molecule are described by nine separate interaction sites (i.e., beads), five of them unique. The CHOL head bead (CHEAD) represents the hydroxyl group and two of the carbon atoms in the A ring of the 4-ring structure denoted as A-D in Figure 1a. The remaining carbon atoms in the A ring and rings B-D are allocated into four RING beads. The CHOL tail attached to the D ring is divided into two distinct beads, CTAIL and CTERM. To capture the molecular roughness of one face of the CHOL molecule, the methyl groups attached to rings are each mapped to a CHME bead (i.e., chiral methyl).41 For the remainder of the discussion, the RING, CTAIL, CTERM, and CHME beads are collectively referred to as CBODY.
MS-IBI Optimization
The MS-IBI method,48 which is an extension of the commonly used IBI methodology,49 was used to optimize the CG CHOL force field and cross interactions with other lipids.48,49 In its usual implementation, IBI performs self-consistent optimization of a CG interaction potential, whereby the CG interactions are modified at each step by comparing the radial distribution function (RDF) of the CG simulation to the RDF of the “target,” typically from an atomistic simulation of the system being reproduced. MS-IBI uses the same general procedure, but instead allows the CG interaction potential to be optimized based upon the agreement with multiple distinct targets; these targets may be for the same molecules or different molecules with a subset of shared chemical topologies, at distinct thermodynamic state points/structures, and/or at the same state point but simulated using different ensembles. For example, constant volume (NVT) and constant pressure (NPT) states are often both utilized simultaneously in optimizing a force field to enable it to capture the pressure-density relationship of the system.43 This is accomplished by considering the correction to the CG interaction potential to be the normalized sum of the deviations between RDFs for the multiple targets, as shown in Equation 1,
| (1) |
where Vi(r) and Vi+1(r) are the potential energy functions at the current and next iterations, respectively, for a given pair of atom types; and are the radial distribution functions between a given pair of atom types for state s, calculated respectively from the target atomistic system mapped to the CG level and the current iteration; αs(r) is a weighting factor for state s; Nstates is the total number of states; Ts is the temperature of target state s; and kB is the Boltzmann constant. For the case of a single state point, equation 1 reduces to the standard IBI procedure.
The relative weight (αs(r)) of each of the states allows more emphasis to be placed on matching targets deemed to be of greater importance for the desired application (e.g., in our case, greater emphasis placed upon ordered state points). The αs parameters also act as damping factors to stabilize the optimization procedure by preventing large updates that can slow down the rate of convergence. Additionally, for MS-IBI, the weighting functions are defined such that they decrease linearly from their maximum value, αmax, at r = 0, to zero at r = rmax to suppress artifacts in the interaction potential that can arise due to intermediate and long-range correlations in the RDF, following the work in reference 50. The values of αmax (listed in Table S2) are chosen via guidance from prior optimization work and refined via guess and check iteration to arrive at the final set used in the optimization of the model presented here. In general, ordered states are provided with a higher αmax than disordered states; e.g., monolayer, bilayer, and multilayer states have a value of αmax = 0.5 and αmax = 0.05 for the bulk fluid for interactions between FFA TAIL and CHOL CBODY.
The nonbonded interactions for CG CHOL were parametrized using the MS-IBI approach to match several target states from atomistic simulations in order to improve state transferability of the model as compared to the original parameters determined by Hadley and McCabe using single-state IBI.51,52 To capture a range of behaviors, the target states for optimizing the CHOL force field included the bulk fluid, a monolayer, hydrated bilayer, and dehydrated stacked bilayers (i.e., no water in between the bilayer leaflets at all). Surface wetting simulations were also performed for select interactions to measure contact angles and aid in gauging the accuracy of the strength of the hydrophobic interactions in the CG model and tuning these strengths as necesary.43 Complete details of the target states and the force field optimization process are provided in the supporting information (§S1.1 and §S2.1).
Simulation Methodology
Atomistic simulations were performed for three purposes: (i) to generate target data (bulk fluid, monolayer, hydrated bilayer, dehydrated stacked bilayers; Table S1) for the MS-IBI optimization of the CHOL CG model, (ii) to calculate structural properties from hydrated bilayers of CER NS, CHOL and FFA mixtures for validating the CG model, and (iii) to interrogate atomistic level details recovered by ‘reverse mapping’ the 6-leaflet self-assembled CG simulations to the atomistic level. All atomistic simulations employed the CHARMM36 force field51 with additional parameters from Guo et al.52 for CER NS and from Cournia et al.53 for CHOL. Atomistic simulations were performed using the GROMACS simulation engine version 201854 with a 1 fs timestep. Van der Waals interactions were truncated at 12 Å with a smooth switching function applied between 10 and 12 Å. Short-range electrostatics were truncated at 12 Å and long-range electrostatics calculated using the particle-mesh Ewald (PME) method. NVT and NPT simulations employed the Nose-Hoover thermostat with a coupling constant of 1 ps.55 For hydrated bilayers, separate but identical thermostats were applied to the water and the lipids. NPT simulations used a Parrinello-Rahman barostat56 with a coupling constant of 10 ps. Semi-isotropic coupling (in the xy-dimensions, along the bilayer plane) were used for bilayer systems, whereas isotropic coupling was used for the bulk fluid systems. For ordered systems, such as bilayers, the random walk MD (RWMD) procedure26 was used to allow lipids to decorrelate from their initial orientation and in-plane morphology. The exact simulation protocol is detailed in the supporting information (§S1). For target and validation data, four replicate simulations were performed, each differing by the seed given to the RWMD temperature sequence.
The CG simulations were performed using the HOOMD-Blue simulation engine, version 2.9.3.57 A timestep of 10 fs was used in all of the CG simulations. Full details of the simulation parameters used and the accuracy of the individual CG RDFs as compared to their atomistic targets mapped to the CG level are provided in the supporting information (§S2 and §S4). Simulations of the self-assembly of CG model membranes were initialized by randomizing the configuration and orientation of the lipids in the center of the simulation box and hydrating this lipid region with a randomized arrangement of water using the Molecular Simulation and Design Framework (MoSDeF)58–60 mBuild software.61 The initial configuration of the lipid systems starts with the water and lipids phase separated; while this phase separation happens very rapidly for a fully mixed, isotropic system, initializing the system in phase separated configurations ensures that membranes form with their interface normal to one of the principle axes of the system, for ease of analysis. Self-assembled bilayer systems contained 1,000 lipid molecules and 4- and 6-leaflet systems contained 2,000 lipid molecules. All systems contained 10 water beads per lipid (10,000 and 20,000 water beads respectively in total for the bilayer and multilayer systems), which translates to 40 water molecules per lipid. Four independent replicates, each starting from randomized initial configurations, were simulated for each self-assembled CG system studied. To accelerate self-assembly, the box annealing protocol described in Moore et al.32 was employed. Finally, production runs for the self-assembled systems were carried out in the NPT ensemble for 200 ns at 1 bar and 305K using the Martyna-Tobias-Klein thermostat-barostat with the same coupling constants as the atomistic simulations.62 Data from at least the final 100 ns of the simulations was used for analysis. Additional details of the CG system set up and simulations are provided in the supporting information (§S2).
Analysis
Analysis of the lipid systems was performed utilizing the MDTraj,63 Freud,64 and Voro++65 software packages. Structural properties of the systems were characterized using the area per lipid (APL) and/or normalized lipid area (NLA), bilayer thickness, interdigitation, tilt angle, and nematic order parameter (S2). We introduce the NLA in this work as a new metric that allows systems with lipids containing different numbers of tails and different cross-sectional areas to be compared on a more equivalent basis than APL. NLA is calculated by normalizing the APL by the average effective number of tails, where FFA is counted as 1 tail, CER NS acyl and sphingosine chains as 1 tail each (i.e., a hairpin CER would be counted as 2 and an extended would be 1 in an individual leaflet), and CHOL as 1.9 tails. The effective number of CHOL tails was determined by considering the cross sectional area of CHOL to be ~38 Å2 (reported in experiment to be between 37–39 Å2)66,67 and the cross-sectional area of a saturated carbon chain to be ~20 Å2 (20.7 Å2 for steric acid,68 ~20.6 Å2 for behenic acid,69 and 20 Å2 per chain from prior simulations of dehydrated CER NS bilayers using CHARMM43). A discussion of the impact of the choice of the number of effective tails for CHOL is included in the supporting information (§S3.2).
The fraction of CERs in the hairpin and extended conformations and the number and location of water beads were measured separately for outer leaflets (defined as those in contact with the water interface) and the inner leaflets (those not in contact with the water interface) of the multilayer systems. To further describe in-plane morphology, the in-plane coordination number between CHOL with itself and with the other lipid types was determined along with the Voronoi tessellation to examine local packing as described in the supporting information (§S6). For atomistic systems, neutron scattering length density profiles and hydrogen bonds were also calculated as described in the supporting information (§S3.6 and §S3.7).
Unless specified differently, results derived from both the atomistic and CG simulations are reported in tables and figures as the mean ± the pooled standard deviation from four replicate simulations initialized in different randomized configurations. For quantities derived from all lipids combined (e.g., NLA, APL, bilayer thickness, interdigitation, S2, and hydrogen bonding), the standard deviation for each replicate is calculated from the single observation determined at each time frame of the final production simulation (typically 2,000 frames). For quantities derived from individual lipids (e.g., tilt angle, cluster size, and Voronoi tessellation results), the standard deviation for each replicate is the pooled standard deviations of the multiple observations from each time frame. As a result, standard deviation values reported for quantities like tilt angle, which include the variability for each time frame (i.e., the thermal fluctuations), are larger than the standard deviation of the time averaged value for these quantities (e.g., a few degrees compared with less than a degree for tilt angle).
Results and Discussion
CHOL force field validation
Given that the optimization process of CHOL closely follows the procedures developed and used in our prior studies that optimized CG force fields for water, CER NS and FFA32,43,44, we refer the reader to the supporting information (§S1.1 and §S2.1) for further details, and here focus on the validation of the new force field. All of the potentials and RDFs from the MS-IBI derivation of the CHOL CG force field and its cross interactions with other SC lipids are provided in the supporting information (§S4). Machine readable tabulated force field files are available on GitHub.70 The CG CHOL force field obtained from the MS-IBI optimization is found to accurately describe pure CHOL. The atomistic and CG simulations are in good agreement for bulk fluid properties; for example, the density of pure CHOL at 550 K and 1 atm is reproduced with high accuracy (0.73 ± 0.01 g/mL (CG) versus 0.73 ± 0.01 g/mL (atomistic)), as is that for an equimolar mixture of CHOL and FFA C24 at 1 atm and 500 K (0.81 ± 0.03 g/mL (CG) versus 0.79 ± 0.01 g/mL (atomistic)). High temperatures were chosen for these systems to ensure that the lipids remain in a fluid state. Good agreement is also obtained between the atomistic target and CG RDFs (Figure 2). CHOL-CER NS and CHOL-FFA RDFs are in close agreement for ordered states but deviate more for bulk states, where the CG model predicts stronger association between the headgroups than is seen in the atomistic simulations (Figures S4 and S5). Because the focus of this work is on the formation of ordered phases, which are given a higher weighting factor in the MS-IBI optimization, these bulk phase deviations are considered acceptable
Figure 2:
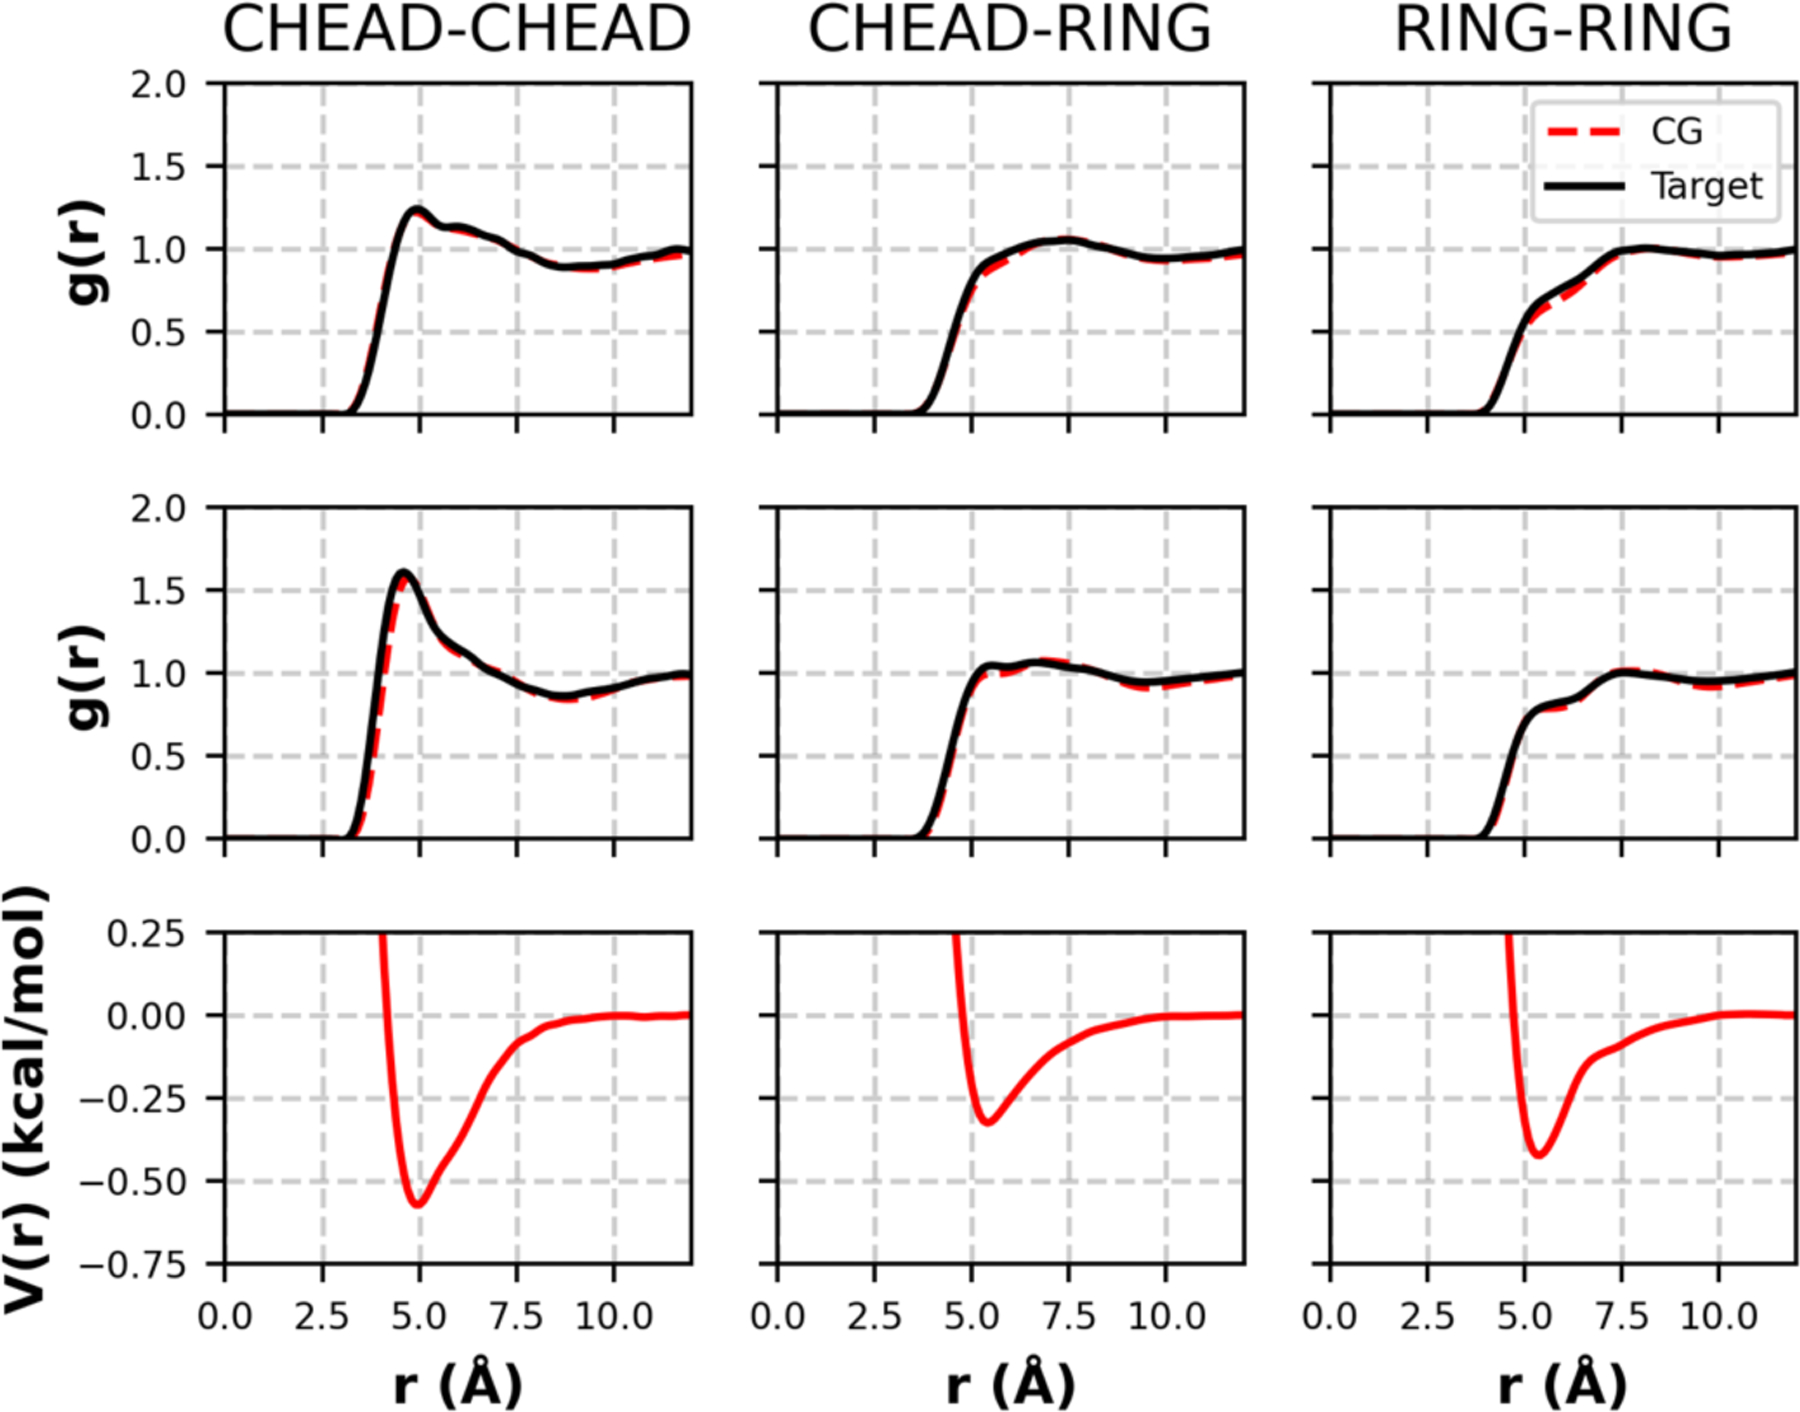
RDFs and pair potentials from the pure CHOL force field optimization. Top: target and CG RDFs at the 550K NPT state; middle: target and CG RDFs from the 400K NVT state; bottom: pair potential that yields the CG RDFs above. Each column corresponds to the pair interaction listed at the top of the column.
In hydrated bilayer simulations of two or three lipids, the CG force field reproduces with good accuracy the structural properties of the pre-assembled atomistic bilayers in both pre-assembled and self-assembled CG simulations at 305K (Table 1). Three systems of equimolar mixtures were studied: CER NS C24:CHOL allowing the CHOL-CER NS cross interactions to be tested, CHOL:FFA C16 allowing the CHOL-FFA interactions to be tested, and CER NS C24:CHOL:FFA C24, the system of particular interest in this study. Because the pre-assembled CG simulations were initialized using the final configuration of the atomistic simulation mapped to the CG level, the differences between the CG and atomistic structure for pre-assembled bilayers is primarily driven by the CG force field rather than the equilibration procedure used to form the self-assembled systems.
Table 1:
Structural properties of hydrated bilayers in the atomistic and CG systems studied at 305K. Results shown are the mean ± pooled standard deviation of four simulations.
| System | APL (Å2) | Bilayer Thickness (Å) | S 2 | Tilt (°) |
|---|---|---|---|---|
| CER NS C24:CHOL 1:1 | ||||
| Atomistic preassembled | 38.8 ± 0.3 | 47.8 ± 0.1 | 0.958 ± 0.007 | 9 ± 5 |
| CG preassembled | 39.74 ± 0.06 | 48.0 ± 0.1 | 0.931 ± 0.003 | 10. ± 6 |
| CG self-assembled | 38.71 ± 0.16 | 48.33 ± 0.08 | 0.947 ± 0.014 | 10. ± 6 |
| CHOL:FFA C16 1:1 | ||||
| Atomistic preassembled | 29.92 ± 0.09 | 35.9 ± 0.2 | 0.951 ± 0.004 | 11 ± 6 |
| CG preassembled | 30.58 ± 0.08 | 33.22 ± 0.05 | 0.908 ± 0.004 | 13 ± 6 |
| CG self-assembled | 30.33 ± 0.13 | 35.77±0.03 | 0.929 ± 0.014 | 11±6 |
| CER NS C24:CHOL:FFA C24 1:0.5:1 | ||||
| Atomistic preassembled | 30.38 ± 0.05 | 52.7 ± 0.18 | 0.977 ± 0.014 | 8 ± 4 |
| CG preassembled | 33.08 ± 0.17 | 50.7 ± 0.2 | 0.96 ± 0.03 | 8 ± 5 |
| CG self-assembled | 33.32 ± 0.16 | 50.82 ± 0.02 | 0.96 ± 0.02 | 8 ± 5 |
Focusing first on the comparison between pre-assembled bilayers, systems composed of CER NS C24:CHOL and CHOL:FFA C16, both in 1:1 ratios, the CG APL is within 2.5% of the atomistic APL, demonstrating that the CG model captures the in-plane packing of the lipids, similar to prior results for pure CER NS and CER NS:FFA mixtures.26 The thickness of the CG CER NS C24:CHOL bilayer shows almost perfect agreement with the atomistic bilayer, while the CG model of CHOL:FFA C16 underpredicts the atomistic bilayer thickness by ∼7.5%. In both the CER NS C24:CHOL and CHOL:FFA C16 equimolar systems, the nematic order (S2) of the lipid tails indicates that they are highly ordered, although the CG model slightly underpredicts the atomistic results. The CG model reproduces tilt angle well with a small over prediction that is well within the observed standard deviation. CG simulations from pre-assembled bilayers of CER NS C24, CHOL, and FFA C24 with a 1:0.5:1 mole ratio are also reported in Table 1. These show good agreement with the results from atomistic simulations, although the CG force field predicts an APL that is ~10% larger, with ~4% smaller thickness. Significantly, these three component lipid simulations provide an unbiased validation of the CG force field because target states from the three component systems were not included in the target optimization; only two component lipid systems were used as targets.
In general, close agreement is observed between the self-assembled CG and atomistic simulations in terms of structural properties, supporting the accuracy of the CG model (Table 1). For the CER NS C24: CHOL:FFA system, the self-assembled CG simulations slightly over predict the APL and underpredict the thickness, but these deviations are well within the accuracy expected for the CG force field, as observed in prior work.32,43 We note that for this composition, the structural properties of both the pre- and self-assembled CG simulations are not statistically different; this agreement suggests that the CG simulations reached the same energy minimum regardless of the procedure for the bilayer formation. Similar agreement between pre- and self-assembled configurations is observed for the CER NS C24:CHOL composition as well. The slight deviations seen when comparing pre- and self-assembled CG configurations for the CHOL:FFA C16 composition suggests that the pre-assembled systems may simply be stuck in a low energy, metastable configuration (here, demonstrating increased tilt and an associated reduced bilayer thickness, as these two measures cannot typically vary independently). However, the close agreement of the CG self-assembled and atomistic results for CHOL:FFA C16 again supports the accuracy of the CG model and highlights the importance of using self-assembly to initialize configurations. Furthermore, agreement between the atomistic and self-assembled configurations provides additional self-consistent validation of the efficacy of the RWMD procedure26 used in the atomistic simulations to relax and decorrelate the lipids from their initial configurations and morphologies.
In experimental studies of equimolar CHOL:FFA C16 mixtures, Lafleur and co-workers71,72 observed the appearance of a bilayer phase at 326.5 K. To allow comparison of the MS-IBI CG force fields with these experiments, additional self-assembly simulations were performed at 330K for CHOL:FFA C16. The 35.7 Å bilayer thickness observed for these simulations is 9% smaller than the 39 Å repeat distance observed by X-ray diffraction at 328K.73 However, the fraction of CHOL in the experimental bilayer may be greater than 50% due to phase separation of FFA into a second isotropic phase.72 The APL of 30.9 Å2 from the CG model at 330K is ~8% lower than the 33.3 Å2 obtained for the same system via atomistic simulation at 333K in a previous study.40 Also, the change in APL for the equimolar CHOL-FFA C16 system from 305 to 330K was much smaller for the CG model (30.33 to 30.9 Å) than the atomistic model (29.92 to 33.3 Å). This suggests that the temperature dependence of the CG model is much weaker than the atomistic model, which is expected given that IBI optimized models, like the ones used herein, are typically not optimized to reproduce thermotropic behavior.74,75 In prior work, Hadley and McCabe also used their IBI-derived CG force field to self-assemble equimolar mixtures of CHOL and FFA C16.40 From this model at 333 K, the bilayer thickness was 30 Å, which is slightly lower than the experimental value, and the APL was 33.3 Å2, which is in near perfect agreement with atomistic simulations. The latter result is expected because the Hadley-McCabe IBI model used the equimolar CHOL and FFA bilayer at 333K as the only target state for the CHOL/FFA cross-interactions, whereas the MS-IBI CHOL model derived in this work did not consider this state. However, despite these small deficiencies, the CG force field derived herein overall provides good agreement with the corresponding atomistic simulations and can capture self-assembly of the lipids into ordered phases.
We can further compare the collective behavior of the CG MS-IBI models to the CG MARTINI-based model developed by Podewitz, et al.,36 for a 1:0.5:1 mole ratio mixture of CER NS C24:CHOL:FFA C24 at 300K. Their MARTINI model produced an APL of 34.4Å2 that is ~13% larger than the atomistic result compared to the ~10% over-estimate of the MS-IBI model. The 53.0 Å bilayer thickness reported for the MARTINI model was calculated from the distance between the water interfaces on either side of the bilayer (defined as the position where water density decreased to half of the bulk density), which differs from the bilayer calculations reported in Table 1. For comparison, the bilayer thicknesses for the atomistic and MS-IBI simulations calculated using the water-interface method are 57.0 Å and 54.4 Å, respectively, showing closer agreement than MARTINI with atomistic simulation. A more significant difference between the MS-IBI and the MARTINI models is the absence of tilt in the MARTINI simulations.
Self-assembled lamellar structures
Simulations of the self-assembly of lipid membranes have been performed using the validated MS-IBI CG force fields described above for 3-component mixtures of CER NS C24, CHOL and FFA C24 to explore the effect of varying the CHOL composition on structural properties. Differences in the properties of a bilayer sandwiched between bulk water layers compared with those obtained from leaflets in the middle of a multilayer structure are also explored via the self-assembly of membranes with 2- (i.e., bilayer), 4- and 6-leaflets.
Comparison of bilayer and multilayer structures
As noted earlier, experimental SC lipid membrane systems exhibit multilayer structures, which, for a typical lipid deposition of between 0.9 and 1.5 mg/cm2,18,76,77 produce lipid membranes that are more than 10 μm thick. This corresponds to a stack of more than a thousand ~6 nm SPP-type bilayers. Thus, almost all lipids in these systems reside in interior bilayers without direct contact to bulk water. Experimental measurements of these systems, such as X-ray scattering profiles, and FTIR and NMR spectra, therefore represent the behavior of interior lipids, which, with much lower hydration, behave differently from the single hydrated bilayers that have been examined in many other simulation studies. Specifically, the interior lipids in experimental lipid systems have only 1–2 water molecules per lipid in the headgroup region, compared with the large amounts of water surrounding the headgroups in simulations of hydrated bilayers (typically 20 to 40 waters per lipid23,26,45). Less water leads to more interactions between headgroups,17 and allows the CERs to adopt an extended conformation, which is not seen in hydrated bilayer systems because contact between water and CER tails is highly unfavorable.
To investigate the differences between bilayer and multilayer systems, mixtures of CER NS C24:CHOL:FFA C24 in a 1:0.5:1 molar ratio were self-assembled into 2-, 4-, and 6-leaflet structures (Figure 3a, b, and e). In the following analysis, the headgroups of the ‘outer’ leaflets are in contact with the bulk water interface, whereas headgroups of the ‘inner’ leaflets are in contact with headgroups of an adjacent leaflet. The inner leaflets of the self-assembled multilayer systems contained small amounts of water: 2.20 ± 0.05 water molecules per lipid for the 4-leaflet system and 2.8 ± 0.2 for the 6-leaflet system. This is in good agreement with the ~2 waters per lipid based on neutron scattering measurements17 observed in the aforementioned experimental model of SPP systems containing an equimolar mixture of CERs, CHOL, and FFAs of varying tail lengths. In addition, a significant fraction of the inner CERs adopt an extended conformation (~35–36%) in the simulated structures.
Figure 3:

Simulation snapshots of self-assembled mixtures of CER NS C24:CHOL:FFA C24 A) in bilayer (2-leaflet) and B) 4-leaflet configuration with a 1:0.5:1 molar ratio; C-F are 6-leaflet configurations with mole ratios of C) 1:0:1, D) 1:0.2:1, E) 1:0.5:1, and F) 1:1:1. Water is represented as transparent volumes determined using the QuickSurf representation in VMD. For clarity lipid backbones are represented as a stick model, with headgroup beads rendered as spheres, following the color scheme described in Figure 1.
The combination of low hydration and the presence of extended CERs in the inner layers of the multilayer systems affects structural properties as shown in Table 2, which reports the average across all leaflets, except for the fraction of extended CERs and the number of water molecules per lipid, which were calculated from only the inner leaflets. The decrease in APL for the 4- and 6-leaflet systems compared to the 2-leaflet systems can be attributed to the increase in extended CERs, which pack more efficiently. At the same time, the tilt angle for the 6-leaflet system is slightly larger than for the 2- or 4-leaflet systems. The average bilayer thickness increased by ~2–3 Å as the number of inner leaflets increases, which is consistent with reduced lipid interdigitation in the inner leaflets. The average bilayer thickness of 53.81 Å for the 6-leaflet system closely agrees with the experimentally measured 53–54 Å repeat distances for the SPP phase in the SCSSPP synthetic lipid mixture (described in the Introduction), likely because lipid hydration and the presence of extended CERs in the 4 inner leaflets more closely matches the experimental system.17,18
Table 2:
Average structural properties of 2-, 4-, and 6-leaflet systems of CER NS C24/CHOL/FFA C24 with a molar ratio 1:0.5:1. Results are the average across all leaflets (the mean ± pooled standard deviation of four simulations), except for the fraction of extended CERs and the water molecules per lipid, which are calculated from the inner leaflets that do not contact bulk water.
| 2-leaflet | 4-leaflet | 6-leaflet | |
|---|---|---|---|
| APL (Å2) | 33.7 ± 0.2 | 33.40 ± 0.13 | 33.14 ± 0.08 |
| Tilt Angle (°) | 8 ± 5 | 8 ± 5 | 9 ± 5 |
| Interdigitation (Å) | 10.7 ± 0.2 | 10.13 ± 0.14 | 9.2 ± 0.3 |
| Average Bilayer Thickness (Å) | 50.82 ± 0.02 | 52.94 ± 0.06 | 53.81 ± 0.10 |
| % CERs extended in inner leaflets | -- | 36.3 ± 1.9 | 35.3±0.7 |
| Water molecules/lipid in inner leaflets | -- | 2.20 ± 0.05 | 2.8 ± 0.2 |
Influence of CHOL content on self-assembled CG systems
To examine the role of CHOL in the SC, the mole ratio of CHOL in the minimal SPP systems containing equimolar CER NS C24 and FFA C24 was varied from 0 to 1 relative to CER NS in self-assembled simulations of the 6-leaflet system, which consists of an inner bilayer sandwiched between two outer bilayers (Figure 3c-f). Figure 4 shows the trends in the structural properties of the inner and outer bilayers as a function of CHOL concentration. If adding CHOL does not change lipid packing, then NLA should be constant. This appears to be the case in the outer layers for CHOL/CER molar ratios of 0 to 0.5, with only a small decrease in NLA at CHOL/CER mole ratio of 1. In contrast, NLA values for the inner layers decrease as CHOL is added, suggesting more efficient packing at higher CHOL composition. Also, NLA is consistently greater for the inner layers compared to the outer layers, indicating that the lipids in the inner layers pack less efficiently compared to those in the outer layers. The choice of 1.9 effective tails for CHOL, which is based, as described above, on experimental measurements of cross-sectional area, does not substantially impact the observed trends (see Fig. S1 and the surrounding discussion). Because CHOL is relatively short (approximately the same length as FFA C16), increasing its concentration causes a roughly proportional increase in the interdigitation of the FFA C24 tails and C24 (fatty acid) tails of CER NS C24. The number of extended CER NS molecules, which are abundant in the four inner leaflets and absent in the outer leaflets, increased from ~32% to 38% as the CHOL/CER mole ratio is increased from 0.2 to 1 (Figure 4a). This might occur because the extended conformation packs more efficiently around the CHOL, or, alternatively, because CHOL interaction with one type of CER tail (fatty acid or sphingosine) is preferred over the other tail.
Figure 4:

Average structural properties for the inner and outer bilayers of the 6-leaflet system with varying CHOL:CER molar ratio in an equimolar mixture of CER NS C24:FFA C24. a) % CERs in an extended conformation (calculated from the four inner leaflets), b) NLA, c) tilt angle, d) S2, e) bilayer thickness, and f) interdigitation. Results shown are the mean ± pooled standard deviation of four simulations. In some cases, the error bars are smaller than the symbol size. Experimental bilayer thicknesses are repeat distance measurements for the SCSSPP system from Mojumdar et al.18 (this mixture of 5 different CERs combined with equimolar amounts of CHOL and an FFA mixture with tail length varying from C16 to C26 is described in the introduction and the text discussing Figure 6).
Adding as little as 0.2 CHOL per CER NS disrupts the ordering of the hydrocarbon tails for both the inner and outer bilayers, as indicated by the significant decrease in S2; however, further increases in the CHOL content have no effect. Like tail order, the tilt angle of the inner bilayer is roughly the same when CHOL is present but deviates when CHOL is absent. In contrast, the outer bilayer tilt is the same whether CHOL is or is not present. Because bilayer thickness is affected by both interdigitation and tilt angle (i.e., bilayer thickness decreases with increased interdigitation and increases with decreased tilt angle), the inner bilayer thickness is unchanged when the mole ratio of CHOL/CER is increased from 0 to 0.2, after which the thickness decreases proportional to the increase in CHOL amount; also, therefore, the thickness of the outer bilayers decreases proportional to CHOL amount starting with no CHOL.
Repeat distances measured by SAXD of the SCSSPP mixture with varying amounts of CHOL are quantitatively similar to bilayer thicknesses calculated from simulation. However, unlike the simulation bilayer thicknesses, which decrease with increasing CHOL/CER mole ratio, the experimental repeat distances are constant, indicating that interdigitation (assuming constant tilt angle) did not change with increasing CHOL. The different lipid compositions of the experiments and simulations, especially the presence of FFAs with multiple tail lengths instead of only FFA C24 as in the simulations, is a likely cause of these different observations. In the SCSSPP mixture, CHOL may be able to offset gaps caused by the variation of the FFA tail lengths, which it cannot do when there is no variation in FFA tail lengths. Another possibility is that the amount of CHOL in the simulated bilayers is larger than in the experimental bilayers, because experimentally at CHOL/CER mole ratios of 1 and possibly lower, some of the CHOL resides in a separate CHOL phase.18
The effect of CHOL content on the preferential arrangement and aggregation of lipid tails in the inner bilayer was examined using three different methods: cluster analysis quantifying the formation of nearest neighbor networks with the same lipid tail type, coordination number calculation for CHOL with each lipid tail type, and Voronoi analysis of the number of adjacent neighbors for each lipid type in the inner four leaflets (see supporting information §S3 and §S6 for calculation details). The mean cluster size, defined as the average number of lipid tails of the same type in a cluster, are reported in Figure 5A. When CHOL is absent, the cluster sizes for the FFA and CER NS lipid tails are almost the same. Increasing the CHOL/CER mole ratio from 0.2 to 1 causes an expected approximately proportional increase in the size of the CHOL cluster. The surprising result is that when the CHOL/CER ratio is small (0.2), FFA exhibits a strong preference for being a neighbor with other FFA molecules. With further increases in the CHOL molar ratio, this preference for FFA molecules to neighbor each other diminishes, perhaps because more FFA molecules are needed to fill the larger number of packing defects introduced by more CHOL.
Figure 5:

A) Mean cluster size (defined as the number of each lipid type in a cluster) for lipid tails in the inner leaflets; sphingosine and fatty acid tails of CER NS C24 are designated respectively as FA and SPH. B) CHOL-X coordination numbers, where X is either CHOL, FFA C24, the sphingosine chain of CER NS C24 (SPH), or the fatty acid chain of CER NS C24 (FA). Results shown are the mean ± pooled standard deviation of four simulations.
The coordination numbers of the CHOL tails with each of the lipid tail types are presented for the 1:0.2:1, 1:0.5:1, and 1:1:1 CER NS C24:CHOL:FFA C24 systems in Figure 5B. It is evident from the coordination numbers that for all three systems, CHOL is most likely to have FFA C24 neighbors. Among the CER tails, CHOL is more likely to have CER sphingosine tails as neighbors rather than CER fatty acid tail. This is most easily seen for the CHOL/CER mole ratio of 0.2 where the coordination numbers are 2.6 (FFA), 2 (sphingosine tail), 1.3 (CER fatty acid tail) and 0.5 (CHOL) compared with the values expected if the likelihood was based on the number of each tail type in the mixture; i.e., 2 for all lipid tails except CHOL, which is 0.4. The relative magnitude of these preferences decrease with increasing CHOL content; at a CHOL molar ratio of 1, CHOL is a neighbor with itself and the other types of lipid tails in almost equal amounts with FFA being a neighbor to CHOL slightly more often than the others.
These results are consistent with experimental Fourier transform infrared (FTIR) spectra, which suggest that the CER sphingosine tail is a more likely than the CER fatty acid tail to neighbor CHOL molecules in an equimolar mixture of CER NS C24, CHOL, and FFA C24 plus 5 wt % cholesterol sulfate (in which the FFA and/or the fatty acid chain of the CER were deuterated).20 The authors of this study also concluded that CER NS C24 favors an extended conformation, and FFA C24 prefers to associate with the fatty acid tail of CER NS C24 but not with CHOL. This last conclusion does not necessarily contradict the coordination numbers in Figure 5B because an increased likelihood for FFA molecules to neighbor CHOL does not require CHOL to be a more frequent neighbor to FFA. For example, a single CHOL molecule surrounded by six FFA molecules would have six FFA neighbors but each of those FFAs might have only one CHOL neighbor. Although the extent of these neighbor preferences cannot be quantified from their experimental measurements, the authors proposed a model that assumes all CERs are extended, CHOL is a neighbor to only CER sphingosine tails, and FFA C24 is only a neighbor to CER fatty acid tails or itself.20 This model and a similar model from Iwai et al.78 are inconsistent with the results in Figure 5B indicating that FFA C24 is a common neighbor of CHOL. These differences could be related to the conformation of the CER NS C24 molecules, where we observe that roughly 1/3 are in an extended conformation; a larger fraction of extended molecules could alter the in-plane structure due to localization of the molecular interactions in the membrane and changes to hydrogen bonding (as discussed below in the context of recovering atomistic details).
The Voronoi analysis (Figures S8 and S9 in the supporting information) shows that CHOL molecules in a mixture with smaller and similarly sized FFA and CER tails (cross-sectional area of ~38 Å2 for CHOL compared with about 20 Å2 for hydrocarbon tails from above) most often have seven nearest neighbors with an average of more than 6.5. In the absence of CHOL, FFA and the CER NS tails each have exactly six nearest neighbors. To accommodate CHOL and its seven nearest neighbors, many of the FFA and CER NS tails adjacent to CHOL have only five nearest neighbors. Because the average number of nearest neighbors for CHOL is independent of CHOL content, there are more FFA and CER tails with only five nearest neighbors in mixtures with more CHOL. Overall, the average number of nearest neighbors is slightly smaller for FFA than for either CER NS tail, suggesting that a few more FFA molecules may squeeze around CHOL.
Recovering atomistic details
As previously discussed, the CG model and force field used in this work is capable of reproducing, with good accuracy, many of the key structural metrics of the corresponding atomistic bilayers. However, the loss of atomistic level details in the CG model prohibits comparisons with experimental neutron scattering length density (NSLD) measurements as well as accurate calculations of quantities such as hydrogen bonding. Here, a simple procedure is used to reintroduce atomistic level details into the CG multilayer configurations generated via self-assembly. In this approach, the morphology (i.e., in-plane arrangement of lipids) and CER conformations (i.e., hairpin or extended) are determined from the self-assembled CG structure and the atomistic lipids are arranged accordingly. With this configuration generated, the same general procedures used for the pre-assembled atomistic bilayers are employed to relax the system. Since morphology is derived from the unbiased self-assembled simulation, RWMD is not required. The main goal is to allow lipids to perform a local energy minimization while retaining the configuration dictated by the self-assembled system in a process that is akin to the reverse-mapping of Wassenaar et al.79 However, unlike the method of Wassenaar et al.,79 this simplified reverse mapping method does not need to use constrained simulations or lengthy energy minimization steps to relieve the system of overlapping atoms, which would be abundant in the large and dense multilayer systems studied in this work.
Here, we focus on an atomistic configuration generated for the system shown in Figure 3e, namely 6 leaflets of the 1:0.5:1 CER NS C24 :CHOL:FFA C24 mixture containing 2,000 total lipids sandwiched between two water layers containing 26,666 molecules (13.3 water molecules/lipid which is equivalent to 40 water molecules/lipid in the outermost leaflets). The small number of water molecules associated with the headgroups of the inner leaflets in the CG configuration (Table 2) were not included in this analysis. As is typical for initializing atomistic bilayers, the in-plane area of the initial configuration is set larger than the anticipated equilibrium area to avoid overlaps between the lipids; in this case, the initial in-plane box dimensions are larger than the final dimensions by a factor of ~1.2. All lipids in the atomistic multilayer have their in-plane rotational orientation randomized, similar to the bilayer simulations above and in prior work,26 with the individual lipid tilt angle set to match the average value from the CG simulation. The pre-assembled structure is then hydrated. To relax this configuration, a steepest-descent energy minimization is performed to remove high energy states, followed by a 10 ns NVT step at 305K to relax the molecular structure. Next an NPT step is performed for 100 ns at 305K and 1 atm to allow the box shape (i.e., the in-plane area) to relax and for lipids to further minimize their energy. A final 20 ns NPT production step at 305K and 1 atm is performed to gather 2,000 frames of simulation data spaced in even 10 ps intervals for analysis. Data for the reverse-mapped systems are from a single replicate reported as the mean and standard deviations from each of the frames of the final production simulation, as discussed previously.
A simulation snapshot of the relaxed atomistic multilayer configuration for CER NS C24:CHOL:FFA C24 mixture with a 1:0.5:1 molar ratio at 305K and 1 atm is shown in Figure 6a, with the extended and hairpin CERs designated in different colors (Figure 6b) to highlight their presence. The composition of the leaflets with and without water contact deviate by a small amount from the overall molar ratio of CER NS C24:CHOL:FFA C24, namely, 1:0.52:1.09 (131:68:144 molecules/leaflet) for the two leaflets with water contact (indicating CER NS is depleted) and 1:0.49:0.95 (134.5:66:128 molecules/leaflet) for the 4 leaflets without water contact (indicating CHOL is depleted); 35% of the CERs (46.8 molecules/leaflet) in the inner bilayer are in an extended conformation. The tilt of the atomistic system is on average 9.9 ± 8.2° compared to 9.2 ± 5.3° for the corresponding CG systems. We note that average tilt angle from the CG system was used to set the initial tilt angle of the lipids in atomistic system, and thus we might expect such agreement; however, due to starting with a configuration that was expanded by a factor of ~1.2 in the in-plane dimensions, lipids were provided with sufficient freedom to adjust this angle if the initial value was unfavorable. The average NLA for the atomistic system is calculated to be 20.35 ± 0.03 Å2, which is slightly smaller than 20.96 ± 0.04 Å2 for the corresponding CG systems.
Figure 6:

a) Simulation snapshot of a reverse-mapped atomistic 1:0.5:1 CER NS C24:CHOL:FFA C24 6-leaflet system with lipids colored according to the images in b). A 1-nm thick slice is highlighted in a) and shown in detail in Figure 7a. c) Protiated NSLD profiles for the inner bilayer (i.e., inner 2 leaflets) from the atomistic multilayer simulation shown in a) compared with experimental results for the SCSSPP system from Groen et al.17 (see text for system composition) and an equivalent composition atomistic bilayer simulation used to validate the CG force field (see Table 1).
As a means of validating the atomistic configuration, the NSLD profile calculated for the inner 2 leaflets of the 6-leaflet system in Figure 6a is compared in Figure 6c to an experimental NSLD for the SCSSPP system with a nominal bin size value of 0.25Å (see §S3.6). We recall that the experimental SCSSPP system, which is described in the Introduction contains a CER mixture (NS C24, AP C24, AS C24, and AP C16 and C24) combined with equimolar amounts of CHOL and a FFA mixture ranging from C16 to C26.26 We expect the experimental system, despite its more complex composition and larger amount of CHOL, to be relevant to the simpler simulated systems. First, at 60 mol %, CER NS C24 is the dominant CER species in the experimental system. Second, as much as half of the CHOL in the experimental system is located in a separate crystalline CHOL phase, which reduces the amount in the lamallae.19 Finally, similar phase behavior, including formation of the SPP, has been demonstrated for simplifications of the experimental composition including FFA C24 instead of the FFA mixture and/or CER NS C24 instead of the CER mixture.80 There is good agreement between the NSLD calculated from the simulated multilayer system and experiment in terms of the position and shape of the main peaks, suggesting the reverse-mapped atomistic system captures the same 53.9 Å repeat distance seen experimentally.17 However, there is a slight difference in the thicknesses of the secondary peaks located at ±15 Å for the experimental and reverse-mapped atomistic NSLD profile. This may be attributed to the difference in lipid composition as well as truncation error in the experimental measurement. Comparing to the NSLD profile calculated for an equivalent composition single hydrated bilayer (one of the replicates used to validate the CG force field, as reported in Table 1), the main peaks are considerably narrower because there is a lipid-water interface, rather than a lipid-lipid interface, as in the simulated multilayer system or experiment.
Moore et al.26 and Wang and Klauda45 also compared their simulations of equimolar amounts of CER NS C24, CHOL, and FFA C24 in a single hydrated bilayer to the same NSLD experimental data; the results of Moore et al.26 and Wang and Klauda45 are similar to each other with repeat distances smaller than the 53.9 Å reported experimentally (~50 Å from Moore et al. and ~49 Å from Wang and Klauda). This reduced repeat distance is expected given that the larger concentration of shorter length CHOL molecules enables increased interdigitation compared with the 1:0.5:1 CER NS C24:CHOL:FFA C24 composition; this was shown previously in the CG simulations as a function of CHOL concentration (Figure 4). As was seen in the hydrated single bilayer system in Figure 6c, the main peaks in the simulations from Moore et al.26 and Wang and Klauda45 are also significantly narrower than those seen in experiment and the multilayer simulation, since the peaks in the hydrated bilayers represent a water-lipid interface, not lipid-lipid interface.
To highlight the ordering of the lipids, Figure 7a renders a slice of the system located between the two highlighted planes in Figure 6a using the color scheme shown in Figure 6b. To quantify the distribution of the species in Figure 7a, Figures 7b and 7c plot the density histogram of the lipid components of this system. The z-distance from the center (i.e., x-axis) in Figures 7b and 7c correspond to the spatial dimensions shown in 7a. Consistent with the experimental observations,19 the FFA chains show increased density within the central region of a leaflet pair (as seen at z-positions of ~ −60, 0, and 60 Å in Figure 7b) due to interdigitation of the chains. Also consistent with experiment, CHOL appears to sit deeper in the leaflet, away from the CER and FFA headgroups. Experimentally, this distance has been measured to be ~4 Å from the edge of the unit cell, at position ±22.9 Å;19 examination of the density profile of the headgroup oxygen in CHOL, labeled as CHOL O in Figure 7b, a peak location at ±22.8 Å is identified, in close agreement with experiment. Figure 7c shows the overall density histogram of all CER NS, along with separate histograms for molecules in the hairpin and extended conformations. At approximately ±25 Å, the hairpin CERs show two small peaks (one is slightly larger than the other), corresponding to the two layers formed by opposing CER headgroups. The histogram for the extended conformation shows only a single peak located roughly at the center between these two headgroup peaks, rather than aligning with the position of either layer of the hairpin headgroups.
Figure 7:

a) Slice from the center of the simulation cell for the 1:0.5:1 molar ratio of CER NS C24:CHOL:FFA C24 6-leaflet system shown in Figure 6a using the color scheme specified in Figure 6b. b) Density profile of CER NS, CHOL, FFA. The density profile of the oxygen in the CHOL headgroup is also plotted, with the numerical values scaled by a factor of 10 to make them visible on this plot. c) Density profile for CER NS showing the hairpin and extended conformations separately.
Headgroups in lipid membranes form a network of intermolecular hydrogen bonds that affects membrane stability and permeability.81,82 It is important therefore to measure hydrogen bonding between different lipid components within and between leaflets. Table 3 reports the average number of hydrogen bonds between each pair of lipid types in the 6-leaflet system measured separately for the leaflets with and without bulk water contact (i.e., outer leaflets represent the two leaflets in contact with the bulk water, inner leaflets represent the 4 leaflets that do not contact the bulk water). Considering first the overall number of hydrogen bonds scaled by the number of lipids in each leaflet type (i.e. inner or outer leaflets), we observe that lipids in the inner leaflets, which can participate in both intra-and inter-leaflet bonding, have approximately 3 times the number of lipid-lipid hydrogen bonds than the outer leaflets, which have only intra-leaflet bonding due to the interface with water; each lipid in the outer leaflet has 2.00 ± 0.04 hydrogen bonds with water. Intra-layer lipid-lipid hydrogen bonding of the inner leaflets (0.584 ± 0.023 bonds per lipid) is about half of all hydrogen bonding in these leaflets and slightly larger than in the outer leaflets (0.396 ± 0.020). We note that the inner leaflets in this analysis were dehydrated, preventing hydrogen bonding with water. How the small number of water molecules associated with the headgroups of the inner leaflets, as observed experimentally and in the CG configuration, affect hydrogen bonding is an interesting question that we reserve for separate investigation.
Table 3:
Normalized number of lipid-lipid hydrogen bonds in the reverse-mapped atomistic structure for the 6-leaflet system of CER NS C24:CHOL:FFA C24 with a 1:0.5:1 molar ratio. Results are shown for CERs, CHOL, and FFA in the inner and outer leaflets, as well as specifically the extended (exCER) and hairpin (hpCER) CERs in the inner leaflets. The values reported are the mean ± standard deviation, normalized by the number of the designated lipid type or pairs of lipid types in the specified leaflets. Raw data are provided in Table S5 of the supporting information.
| Lipid Pair | Inner Leaflets | Outer Leaflets | Normalization |
|---|---|---|---|
| CER-CER | 1.149 ± 0.034 | 0.500 ± 0.036 | # CERs |
| CER-CHOL | 0.267 ± 0.016 | 0.123 + 0.018 | # CERs |
| CER-FFA | 0.897 ± 0.024 | 0.299 + 0.024 | # CERs |
| CHOL-CHOL | 0.004 ± 0.004 | 0.003 ± 0.005 | # CHOLs |
| CHOL-FFA | 0.289 ± 0.029 | 0.105 ± 0.021 | # CHOLs |
| FFA-FFA | 0.442 ± 0.011 | 0.052 + 0.016 | # FFAs |
| FFA-CHOL | 0.149 ± 0.015 | 0.050 ± 0.010 | # FFAs |
| ALL-ALL | 1.178 ± 0.020 | 0.396 ± 0.020 | # All lipids |
|
| |||
| exCER-exCER | 0.144 ± 0.082 | -- | # CER-CER pairs |
| exCER-hpCER | 0.443 ± 0.058 | -- | # CER-CER pairs |
| hpCER-hpCER | 0.413 ± 0.053 | -- | # CER-CER pairs |
| exCER-CHOL | 0.345 ± 0.139 | -- | # CER-CHOL pairs |
| hpCER-CHOL | 0.655 ± 0.099 | -- | # CER-CHOL pairs |
| exCER-FFA | 0.345 ± 0.067 | -- | # CER-FFA pairs |
| hpCER-FFA | 0.655 ± 0.043 | -- | # CER-FFA pairs |
Del Regno and Notman examined hydrogen bonding in simulations of 1:1:1 and 2:2:1 mole ratios of CER NS C24:CHOL:FFA C24 systems at two levels of hydration: (i) fully hydrated, akin to the outer leaflets, and (ii) low hydration with only two waters per lipid, similar to the inner leaflets.27 In their work, the intra-lipid (i.e., lateral) hydrogen bonding did not depend on the water content, which disagrees with the findings presented here.27 This difference in behavior may arise from the different compositions considered, the presence of a small amount of water in the Del Regno and Notman system, or from other subtle aspects (e.g., the use of a different force field). It is also possible that the presence of extended CER NS conformations, which were not included in the Del Regno and Notman study, is a crucial difference between the outer (hydrated) and inner (dehydrated) leaflets observed in this work.27 Therefore, to further explore these questions, we examined the number of hydrogen bonds as a function of the different lipid types and CER NS conformations.
On average each CER in the inner leaflets hydrogen bonds with one other CER and one FFA, whereas in the outer leaflet only one out of every two CERs hydrogen bonds with another CER and only 1/3 hydrogen bond with FFA. Far fewer hydrogen bonds exist between CER and CHOL: only 1 in 4 CERs hydrogen bond with CHOL in the inner leaflets, and in the outer leaflets, the number is just 1 in 8. Virtually no CHOL-CHOL hydrogen bonding is observed anywhere in the system. Hydrogen bonds are found between FFA and CHOL, where, again, the outer leaflets have fewer bonds (~1/3) than the inner leaflets. There are virtually no FFA-FFA hydrogen bonds in the outer leaflets but approximately 1 hydrogen bond for every 2 FFA lipids in the inner leaflets, with two-thirds of these occurring between separate leaflets. CER conformation appears to have no effect on its hydrogen bonding with either CHOL or FFA: 35% of the hydrogen bonds between both CHOL and FFA are with the extended CER conformation (Table 3), which matches the fraction of CERs in the extended conformation. The situation is different for hydrogen bonding of CER with itself, where bonding between CERs that are both extended is lower by a factor of more than five than hydrogen bonding of the hairpin conformation with either another hairpin or the extended conformation (which occur in approximately equal amounts). This behavior may be linked to the relative amount of each conformation in the system and how CERs distribute themselves spatially, rather than an intrinsic difference in the ability of the extended CERs to hydrogen bond with each other.
Given the importance of hydrogen bonding on membrane barrier properties, the large differences in the amount of hydrogen bonding within the inner leaflets compared with the outer leaflets are likely to produce corresponding differences in permeability. One would expect, therefore, that permeability measurements derived from simulations of a bilayer sandwiched between bulk water layers would be different than from simulations of multilayer systems containing extended CER conformations without large amounts of water between the layers. Because of this, simulated permeability measurements of bilayers in contact with bulk water, or stacked upon each other without extended conformations, should be interpreted cautiously, especially when compared with experimental permeability measurements across either the SC or model SC lipid membranes.
Conclusions
In this work, we present a novel CG force field for CHOL, derived using the MS-IBI method,48 that is compatible with our previously developed MS-IBI-based CG force fields for CER NS, FFA and water.32,43,44 Together these provide a set of force fields that can be used to examine SC lipid systems exhibiting SPP-like ordering. In this work, the CHOL-CHOL self-interactions and CHOL-CER and CHOL-FFA cross interaction potentials were optimized using a diverse set of atomistic target states ranging from bulk fluids to pure bilayers and mixed bilayers. The resulting force fields enable close agreement between the structural properties of the CG and atomistic systems studied. The CHOL force field was further validated by comparing bilayer structural properties of preassembled atomistic, preassembled CG, and self-assembled CG structures for mixtures of CHOL with CER NS and FFA that were not used as target states for optimization; agreement was again good indicating that the CG model accurately reproduces atomistic bilayer structures. To probe multilayer structures that should be more representative of experiments (e.g., Mojumdar, et al.18), self-assembled bilayer and 4- and 6-leaflet systems were simulated and compared for mixtures of CER NS C24:CHOL:FFA C24 with 1:0.5:1 molar ratios. Differences between the inner and outer leaflets in the average APL, tilt angle, S2 order parameter, and bilayer thickness are relatively small even though a significant number of extended CERs (~35–36% of total CERs in interior layers) are present in the inner layers of the multilayer structures, which affects the morphology and arrangement of lipids in-plane as well as lipid-lipid interactions spanning adjacent layers. Because experimental studies, such as neutron scattering and FTIR, average properties over dozens of lamellae, the results are largely dependent on the structure of interior layers, and thus the inner bilayer of the 6-leaflet structures provides the best comparison to experimental measurements. Simulations of self-assembled 6-leaflet CER NS C24:CHOL:FFA C24 1:X:1 systems, where the CHOL molar ratio, X, ranged from 0 to 1, demonstrated that interdigitation, fluidity, and the number of packing defects increase with increasing CHOL content. The results also indicate that the size of FFA and CER clusters reduces with increasing CHOL, suggesting that CHOL may improve the miscibility of these two components.
To further compare with experiment and examine atomistic level properties, a simple reverse-mapping procedure was used to generate an atomistic 6-leaflet containing CER NS C24:CHOL:FFA C24 with a 1:0.5:1 molar ratio, using the corresponding CG self-assembled structure as reference. This reverse-mapped structure preserved the conformation of CERs (i.e., hairpin or extended) and in-plane morphology of the associated self-assembled structure. Compared to previous work,26,45 which used only pre-assembled bilayer systems, the simulated NSLD curves using the inner layer of the reverse mapped structure showed much closer agreement with experimental NSLD curves for a model SPP system,17 highlighting the importance of considering multilayer structures. Furthermore, it was observed that approximately half of the lipid-lipid hydrogen bonds in the inner portion of the multilayer system exist between lipids in separate leaflets (i.e., inter-layer hydrogen bonding), which may differentiate barrier properties through the inner layers from the outer layers or bilayer structures. This multiscale approach allows for the exploration of atomistic self-assembled multilayer configurations that capture both hairpin and extended CER conformation and unbiased morphologies rather than arbitrarily arranged pre-assembled configurations, which makes the simulation of systems that are more representative of experimental studies possible. Given the significant impact of extended CERs on the observed properties, this work highlights the need for further study into the role of the different amounts of extended CERs on system properties. With the parameterization of additional CER headgroups for the CG model, this approach can be applied to other experimentally realized model systems12,83,84 and provide molecular-level explanations for the observed experimental behavior.
Supplementary Material
Acknowledgments
The project described was supported by Grant Number R01AR072679 from the National Institute of Arthritis and Muscoskeletal and Skin Diseases. D.X. also acknowledges support from the National Science Foundation through grant number DMR-1852157. Additional computational resources were provided by the National Energy Research Scientific Computing Center, supported by the Office of Science of the Department of Energy under Contract No. DE-AC02-05CH11231 and the Advanced Computing Center for Research and Education at Vanderbilt University.
Footnotes
Supporting Information
Detailed simulation methodology for atomistic and coarse-grained simulations; detailed description of analysis methods; description of coarse-grained force field optimization and validation; Voronoi analysis of multilayer simulations; raw hydrogen bonding data for reverse-mapped simulation; layer-by-layer lipid composition for coarse-grained simulations; time evolution of tilt angle in coarse-grained simulations.
References
- 1.Motta S, Monti M, Sesana S, Caputo R, Carelli S, Ghidoni R. Ceramide composition of the psoriatic scale. Biochim Biophys Acta - Mol Basis Dis 1993;1182(2):147–151. doi: 10.1016/0925-4439(93)90135-N [DOI] [PubMed] [Google Scholar]
- 2.Kawana M, Miyamoto M, Ohno Y, Kihara A. Comparative profiling and comprehensive quantification of stratum corneum ceramides in humans and mice by LC/MS/MS. J Lipid Res 2020;61(6):884–895. doi: 10.1194/jlr.RA120000671 [DOI] [PMC free article] [PubMed] [Google Scholar]
- 3.Van Smeden J, Janssens M, Kaye ECJ, et al. The importance of free fatty acid chain length for the skin barrier function in atopic eczema patients. Exp Dermatol 2014;23(1):45–52. doi: 10.1111/exd.12293 [DOI] [PubMed] [Google Scholar]
- 4.Van Smeden J, Boiten WA, Hankemeier T, Rissmann R, Bouwstra JA, Vreeken RJ. Combined LC/MS-platform for analysis of all major stratum corneum lipids, and the profiling of skin substitutes. Biochim Biophys Acta - Mol Cell Biol Lipids 2014;1841(1):70–79. doi: 10.1016/j.bbalip.2013.10.002 [DOI] [PubMed] [Google Scholar]
- 5.Van Smeden J, Janssens M, Gooris GSS, Bouwstra JAA. The important role of stratum corneum lipids for the cutaneous barrier function. Biochim Biophys Acta - Mol Cell Biol Lipids 2014;1841(3):295–313. doi: 10.1016/j.bbalip.2013.11.00 [DOI] [PubMed] [Google Scholar]
- 6.Bouwstra JA, Gooris GS, van der Spek JA, Bras W. Structural Investigations of Human Stratum Corneum by Small-Angle X-Ray Scattering. J Invest Dermatol 1991;97(6):1005–1012. doi: 10.1111/1523-1747.ep12492217 [DOI] [PubMed] [Google Scholar]
- 7.Bouwstra JA, Gooris GS, Bras W, Downing DT. Lipid organization in pig stratum corneum. J Lipid Res 1995;36(4):685–695. http://www.ncbi.nlm.nih.gov/pubmed/7542308. [PubMed] [Google Scholar]
- 8.Danso M, Boiten W, van Drongelen V, et al. Altered expression of epidermal lipid bio-synthesis enzymes in atopic dermatitis skin is accompanied by changes in stratum corneum lipid composition. J Dermatol Sci 2017;88(1):57–66. doi: 10.1016/j.jdermsci.2017.05.005 [DOI] [PubMed] [Google Scholar]
- 9.Boer DEC, van Smeden J, Al-Khakany H, et al. Skin of atopic dermatitis patients shows disturbed β-glucocerebrosidase and acid sphingomyelinase activity that relates to changes in stratum corneum lipid composition. Biochim Biophys Acta - Mol Cell Biol Lipids 2020;1865(6):158673. doi: 10.1016/j.bbalip.2020.158673 [DOI] [PubMed] [Google Scholar]
- 10.Uchida Y, Park K. Ceramides in Skin Health and Disease: An Update. Am J Clin Dermatol 2021;22(6):853–866. doi: 10.1007/s40257-021-00619-2 [DOI] [PubMed] [Google Scholar]
- 11.Kiselev MA, Ryabova NY, Balagurov AM, et al. New insights into the structure and hydration of a stratum corneum lipid model membrane by neutron diffraction. Eur Biophys J 2005;34(8):1030–1040. doi: 10.1007/s00249-005-0488-6 [DOI] [PubMed] [Google Scholar]
- 12.Ruettinger A, Kiselev MA, Hauss T, Dante S, Balagurov AM, Neubert RHH. Fatty acid interdigitation in stratum corneum model membranes: a neutron diffraction study. Eur Biophys J 2008;37(6):759–771. doi: 10.1007/s00249-008-0258-3 [DOI] [PubMed] [Google Scholar]
- 13.Schröter A, Kessner D, Kiselev MA, Hauß T, Dante S, Neubert RHH. Basic Nanostructure of Stratum Corneum Lipid Matrices Based on Ceramides [EOS] and [AP]: A Neutron Diffraction Study. Biophys J 2009;97(4):1104–1114. doi: 10.1016/j.bpj.2009.05.041 [DOI] [PMC free article] [PubMed] [Google Scholar]
- 14.De Jager MW, Gooris GS, Dolbnya IP, Bras W, Ponec M, Bouwstra JA. Novel lipid mixtures based on synthetic ceramides reproduce the unique stratum corneum lipid organization. J Lipid Res 2004;45(5):923–932. doi: 10.1194/jlr.M300484-JLR200 [DOI] [PubMed] [Google Scholar]
- 15.De Jager M, Groenink W, van der Spek J, et al. Preparation and characterization of a stratum corneum substitute for in vitro percutaneous penetration studies. Biochim Biophys Acta - Biomembr 2006;1758(5):636–644. doi: 10.1016/j.bbamem.2006.04.001 [DOI] [PubMed] [Google Scholar]
- 16.Schmitt T, Lange S, Sonnenberger S, et al. The long periodicity phase (LPP) controversy part I: The influence of a natural-like ratio of the CER[EOS] analogue [EOS]-br in a CER[NP]/[AP] based stratum corneum modelling system: A neutron diffraction study. Biochim Biophys Acta - Biomembr 2019;1861(1):306–315. doi: 10.1016/j.bbamem.2018.06.008 [DOI] [PubMed] [Google Scholar]
- 17.Groen D, Gooris GS, Barlow DJ, et al. Disposition of Ceramide in Model Lipid Membranes Determined by Neutron Diffraction. Biophys J 2011;100(6):1481–1489. doi: 10.1016/j.bpj.2011.02.001 [DOI] [PMC free article] [PubMed] [Google Scholar]
- 18.Mojumdar EH, Gooris GS, Bouwstra JA. Phase behavior of skin lipid mixtures: the effect of cholesterol on lipid organization. Soft Matter 2015;11(21):4326–4336. doi: 10.1039/C4SM02786H [DOI] [PubMed] [Google Scholar]
- 19.Mojumdar EH, Groen D, Gooris GS, et al. Localization of Cholesterol and Fatty Acid in a Model Lipid Membrane: A Neutron Diffraction Approach. Biophys J 2013;105(4):911–918. doi: 10.1016/j.bpj.2013.07.003 [DOI] [PMC free article] [PubMed] [Google Scholar]
- 20.Školová B, Hudská K, Pullmannová P, et al. Different Phase Behavior and Packing of Ceramides with Long (C16) and Very Long (C24) Acyls in Model Membranes: Infrared Spectroscopy Using Deuterated Lipids. J Phys Chem B 2014;118(35):10460–10470. doi: 10.1021/jp506407r [DOI] [PubMed] [Google Scholar]
- 21.Engberg O, Kováčik A, Pullmannová P, et al. The Sphingosine and Acyl Chains of Ceramide [NS] Show Very Different Structure and Dynamics That Challenge Our Understanding of the Skin Barrier. Angew Chemie Int Ed 2020;59(40):17383–17387. doi: 10.1002/anie.202003375 [DOI] [PMC free article] [PubMed] [Google Scholar]
- 22.Školová B, Janůšová B, Zbytovská J, et al. Ceramides in the Skin Lipid Membranes: Length Matters. Langmuir 2013;29(50):15624–15633. doi: 10.1021/la4037474 [DOI] [PubMed] [Google Scholar]
- 23.Das C, Noro MG, Olmsted PD. Simulation Studies of Stratum Corneum Lipid Mixtures. Biophys J 2009;97(7):1941–1951. doi: 10.1016/j.bpj.2009.06.054 [DOI] [PMC free article] [PubMed] [Google Scholar]
- 24.Gupta R, Rai B. Molecular Dynamics Simulation Study of Skin Lipids: Effects of the Molar Ratio of Individual Components over a Wide Temperature Range. J Phys Chem B 2015;119(35):11643–11655. doi: 10.1021/acs.jpcb.5b02093 [DOI] [PubMed] [Google Scholar]
- 25.Schmitt T, Gupta R, Lange S, et al. Impact of the ceramide subspecies on the nanostructure of stratum corneum lipids using neutron scattering and molecular dynamics simulations. Part I: impact of CER[NS]. Chem Phys Lipids 2018;214:58–68. doi: 10.1016/j.chemphyslip.2018.05.006 [DOI] [PubMed] [Google Scholar]
- 26.Moore TC, Hartkamp R, Iacovella CR, Bunge AL, McCabe C. Effect of Ceramide Tail Length on the Structure of Model Stratum Corneum Lipid Bilayers. Biophys J 2018;114(1):113–125. doi: 10.1016/j.bpj.2017.10.031 [DOI] [PMC free article] [PubMed] [Google Scholar]
- 27.Del Regno A, Notman R. Permeation pathways through lateral domains in model membranes of skin lipids. Phys Chem Chem Phys 2018;20(4):2162–2174. doi: 10.1039/C7CP03258G [DOI] [PubMed] [Google Scholar]
- 28.Uppulury K, Coppock PS, Kindt JT. Molecular Simulation of the DPPE Lipid Bilayer Gel Phase: Coupling between Molecular Packing Order and Tail Tilt Angle. J Phys Chem B 2015;119(28):8725–8733. doi: 10.1021/acs.jpcb.5b05720 [DOI] [PubMed] [Google Scholar]
- 29.Sovová Ž, Berka K, Otyepka M, Jurečka P. Coarse-grain simulations of skin ceramide ns with newly derived parameters clarify structure of melted phase. J Phys Chem B 2015;119(10):3988–3998. doi: 10.1021/jp5092366 [DOI] [PubMed] [Google Scholar]
- 30.Badhe Y, Gupta R, Rai B. Development and application of coarse-grained MARTINI model of skin lipid ceramide [AP]. J Mol Model 2020;26(7):182. doi: 10.1007/s00894-020-04435-z [DOI] [PubMed] [Google Scholar]
- 31.MacDermaid CM, Hall KW, DeVane RH, Klein ML, Fiorin G. Coexistence of Lipid Phases Stabilizes Interstitial Water in the Outer Layer of Mammalian Skin. Biophys J 2020;118(7):1588–1601. doi: 10.1016/j.bpj.2020.01.044 [DOI] [PMC free article] [PubMed] [Google Scholar]
- 32.Moore TC, Iacovella CR, Leonhard AC, Bunge AL, McCabe C. Molecular dynamics simulations of stratum corneum lipid mixtures: A multiscale perspective. Biochem Biophys Res Commun 2018;498(2):313–318. doi: 10.1016/j.bbrc.2017.09.040 [DOI] [PMC free article] [PubMed] [Google Scholar]
- 33.Ogushi F, Ishitsuka R, Kobayashi T, Sugita Y. Rapid flip-flop motions of diacylglycerol and ceramide in phospholipid bilayers. Chem Phys Lett 2012;522:96–102. doi: 10.1016/j.cplett.2011.11.057 [DOI] [Google Scholar]
- 34.López CA, Sovova Z, van Eerden FJ, de Vries AH, Marrink SJ. Martini Force Field Parameters for Glycolipids. J Chem Theory Comput 2013;9(3):1694–1708. doi: 10.1021/ct3009655 [DOI] [PubMed] [Google Scholar]
- 35.Wassenaar TA, Ingólfsson HI, Böckmann RA, Tieleman DP, Marrink SJ. Computational Lipidomics with insane : A Versatile Tool for Generating Custom Membranes for Molecular Simulations. J Chem Theory Comput 2015;11(5):2144–2155. doi: 10.1021/acs.jctc.5b00209 [DOI] [PubMed] [Google Scholar]
- 36.Podewitz M, Wang Y, Gkeka P, Von Grafenstein S, Liedl KR, Cournia Z. Phase Diagram of a Stratum Corneum Lipid Mixture. J Phys Chem B 2018;122(46):10505–10521. doi: 10.1021/acs.jpcb.8b07200 [DOI] [PubMed] [Google Scholar]
- 37.Antunes E, Cavaco-Paulo A. Stratum corneum lipid matrix with unusual packing: A molecular dynamics study. Colloids Surfaces B Biointerfaces 2020;190:110928. doi: 10.1016/j.colsurfb.2020.110928 [DOI] [PubMed] [Google Scholar]
- 38.Marrink SJ, Risselada HJ, Yefimov S, Tieleman DP, De Vries AH. The MARTINI force field: Coarse grained model for biomolecular simulations. J Phys Chem B 2007;111(27):7812–7824. doi: 10.1021/jp071097f [DOI] [PubMed] [Google Scholar]
- 39.Melo MN, Ingólfsson HI, Marrink SJ. Parameters for Martini sterols and hopanoids based on a virtual-site description. J Chem Phys 2015;143(24):243152. doi: 10.1063/1.4937783 [DOI] [PubMed] [Google Scholar]
- 40.Hadley KR, McCabe C. A simulation study of the self-assembly of coarse-grained skin lipids. Soft Matter 2012;8(17):4802. doi: 10.1039/c2sm07204a [DOI] [PMC free article] [PubMed] [Google Scholar]
- 41.Hadley KR, McCabe C. A Structurally Relevant Coarse-Grained Model for Cholesterol. Biophys J 2010;99(9):2896–2905. doi: 10.1016/j.bpj.2010.08.044 [DOI] [PMC free article] [PubMed] [Google Scholar]
- 42.Hadley KR, McCabe C. A coarse-grained model for amorphous and crystalline fatty acids. J Chem Phys 2010;132(13):134505. doi: 10.1063/1.3360146 [DOI] [PMC free article] [PubMed] [Google Scholar]
- 43.Moore TC, Iacovella CR, Hartkamp R, Bunge AL, McCabe C. A Coarse-Grained Model of Stratum Corneum Lipids: Free Fatty Acids and Ceramide NS. J Phys Chem B 2016;120(37):9944–9958. doi: 10.1021/acs.jpcb.6b08046 [DOI] [PMC free article] [PubMed] [Google Scholar]
- 44.Moore TC, Iacovella CR, McCabe C. Development of a Coarse-Grained Water Forcefield via Multistate Iterative Boltzmann Inversion. In: Snurr RQ, Adjiman CS, Kofke DA, eds. Foundations of Molecular Modeling and Simulation. Molecular Modeling and Simulation (Applications and Perspectives) Singapore: Springer; 2016:37–52. doi: 10.1007/978-981-10-1128-3_3 [DOI] [PMC free article] [PubMed] [Google Scholar]
- 45.Wang E, Klauda JB. Simulations of Pure Ceramide and Ternary Lipid Mixtures as Simple Interior Stratum Corneum Models. J Phys Chem B 2018;122(10):2757–2768. doi: 10.1021/acs.jpcb.8b00348 [DOI] [PubMed] [Google Scholar]
- 46.Karozis SN, Mavroudakis EI, Charalambopoulou GC, Kainourgiakis ME. Molecular simulations of self-assembled ceramide bilayers: comparison of structural and barrier properties. Mol Simul 2020;46(4):323–331. doi: 10.1080/08927022.2019.1703975 [DOI] [Google Scholar]
- 47.Hadley KR, McCabe C. On the Investigation of Coarse-Grained Models for Water: Balancing Computational Efficiency and the Retention of Structural Properties. J Phys Chem B 2010;114(13):4590–4599. doi: 10.1021/jp911894a [DOI] [PMC free article] [PubMed] [Google Scholar]
- 48.Moore TC, Iacovella CR, McCabe C. Derivation of coarse-grained potentials via multistate iterative Boltzmann inversion. J Chem Phys 2014;140(22):224104. doi: 10.1063/1.4880555 [DOI] [PMC free article] [PubMed] [Google Scholar]
- 49.Reith D, Pütz M, Müller-Plathe F. Deriving effective mesoscale potentials from atomistic simulations. J Comput Chem 2003;24(13):1624–1636. doi: 10.1002/jcc.10307 [DOI] [PubMed] [Google Scholar]
- 50.Pullmannová P, Ermakova E, Kováčik A, et al. Long and very long lamellar phases in model stratum corneum lipid membranes. J Lipid Res 2019;60(5):963–971. doi: 10.1194/jlr.M090977 [DOI] [PMC free article] [PubMed] [Google Scholar]
- 51.Klauda JB, Venable RM, Freites JA, et al. Update of the CHARMM All-Atom Additive Force Field for Lipids: Validation on Six Lipid Types. J Phys Chem B 2010;114(23):7830–7843. doi: 10.1021/jp101759q [DOI] [PMC free article] [PubMed] [Google Scholar]
- 52.Guo S, Moore TC, Iacovella CR, Strickland LA, McCabe C. Simulation Study of the Structure and Phase Behavior of Ceramide Bilayers and the Role of Lipid Headgroup Chemistry. J Chem Theory Comput 2013;9(11):5116–5126. doi: 10.1021/ct400431e [DOI] [PMC free article] [PubMed] [Google Scholar]
- 53.Cournia Z, Smith JC, Ullmann GM. A molecular mechanics force field for biologically important sterols. J Comput Chem 2005;26(13):1383–1399. doi: 10.1002/jcc.20277 [DOI] [PubMed] [Google Scholar]
- 54.Abraham MJ, Murtola T, Schulz R, et al. GROMACS: High performance molecular simulations through multi-level parallelism from laptops to supercomputers. SoftwareX 2015;1–2:19–25. doi: 10.1016/j.softx.2015.06.001 [DOI] [Google Scholar]
- 55.Hoover WG. Canonical dynamics: Equilibrium phase-space distributions. Phys Rev A 1985;31(3):1695–1697. doi: 10.1103/PhysRevA.31.1695 [DOI] [PubMed] [Google Scholar]
- 56.Parrinello M, Rahman A. Polymorphic transitions in single crystals: A new molecular dynamics method. J Appl Phys 1981;52(12):7182–7190. doi: 10.1063/1.328693 [DOI] [Google Scholar]
- 57.Glaser J, Nguyen TD, Anderson JA, et al. Strong scaling of general-purpose molecular dynamics simulations on GPUs. Comput Phys Commun 2015;192:97–107. doi: 10.1016/j.cpc.2015.02.028 [DOI] [Google Scholar]
- 58.Thompson MW, Gilmer JB, Matsumoto RA, et al. Towards molecular simulations that are transparent, reproducible, usable by others, and extensible (TRUE). Mol Phys 2020;118(9–10):e1742938. doi: 10.1080/00268976.2020.1742938 [DOI] [PMC free article] [PubMed] [Google Scholar]
- 59.Summers AZ, Gilmer JB, Iacovella CR, Cummings PT, McCabe C. MoSDeF, a Python Framework Enabling Large-Scale Computational Screening of Soft Matter: Application to Chemistry-Property Relationships in Lubricating Monolayer Films. J Chem Theory Comput 2020;16(3):1779–1793. doi: 10.1021/acs.jctc.9b01183 [DOI] [PubMed] [Google Scholar]
- 60.Cummings PT, McCabe C, Iacovella CR, et al. Open‐source molecular modeling software in chemical engineering focusing on the Molecular Simulation Design Framework. AIChE J 2021;67(3):e17206. doi: 10.1002/aic.17206 [DOI] [Google Scholar]
- 61.Klein C, Sallai J, Jones TJ, Iacovella CR, McCabe C, Cummings PT. A Hierarchical, Component Based Approach to Screening Properties of Soft Matter In:; 2016:79–92. doi: 10.1007/978-981-10-1128-3_5 [DOI]
- 62.Martyna GJ, Tobias DJ, Klein ML. Constant pressure molecular dynamics algorithms. J Chem Phys 1994;101(5):4177–4189. doi: 10.1063/1.467468 [DOI] [Google Scholar]
- 63.McGibbon RT, Beauchamp KA, Harrigan MP, et al. MDTraj: A Modern Open Library for the Analysis of Molecular Dynamics Trajectories. Biophys J 2015;109(8). doi: 10.1016/j.bpj.2015.08.015 [DOI] [PMC free article] [PubMed] [Google Scholar]
- 64.Ramasubramani V, Dice BD, Harper ES, Spellings MP, Anderson JA, Glotzer SC. freud: A software suite for high throughput analysis of particle simulation data. Comput Phys Commun 2020;254:107275. doi: 10.1016/j.cpc.2020.107275 [DOI] [Google Scholar]
- 65.Rycroft CH. VORO++: A three-dimensional Voronoi cell library in C++. Chaos An Interdiscip J Nonlinear Sci 2009;19(4):041111. doi: 10.1063/1.3215722 [DOI] [PubMed] [Google Scholar]
- 66.Burke LI, Patil GS, Panganamala RV, Geer JC, Cornwell DG. Surface areas of naturally occurring lipid classes and the quantitative microdetermination of lipids. J Lipid Res 1973;14(1):9–15. http://www.ncbi.nlm.nih.gov/pubmed/4701558. [PubMed] [Google Scholar]
- 67.Lundberg B A surface film study of the lateral packing of phosphatidylcholine and cholesterol. Chem Phys Lipids 1982;31(1):23–32. doi: 10.1016/0009-3084(82)90016-0 [DOI] [Google Scholar]
- 68.Malta V, Celotti G, Zannetti R, Martelli AF. Crystal structure of the C form of stearic acid. J Chem Soc B Phys Org 1971:548. doi: 10.1039/j29710000548 [DOI]
- 69.Bommarito GM, Foster WJ, Pershan PS, Schlossman ML. A determination of the phase diagram of relaxed Langmuir monolayers of Behenic acid. J Chem Phys 1996;105(12):5265–5284. doi: 10.1063/1.472367 [DOI] [Google Scholar]
- 70.Shamaprasad P Multiscale Stratum Corneum Lipid Force Field (MuSCL) https://github.com/PTC-CMC/muscl. Published 2021. Accessed January 26, 2022.
- 71.Ouimet J, Lafleur M. Hydrophobic Match between Cholesterol and Saturated Fatty Acid Is Required for the Formation of Lamellar Liquid Ordered Phases. Langmuir 2004;20(18):7474–7481. doi: 10.1021/la0491293 [DOI] [PubMed] [Google Scholar]
- 72.Paré C, Lafleur M. Formation of Liquid Ordered Lamellar Phases in the Palmitic Acid/Cholesterol System. Langmuir 2001;17(18):5587–5594. doi: 10.1021/la0102410 [DOI] [Google Scholar]
- 73.Ouimet J, Croft S, Paré C, Katsaras J, Lafleur M. Modulation of the Polymorphism of the Palmitic Acid/Cholesterol System by the pH. Langmuir 2003;19(4):1089–1097. doi: 10.1021/la026601g [DOI] [Google Scholar]
- 74.Ghosh J, Faller R. State point dependence of systematically coarse–grained potentials. Mol Simul 2007;33(9–10):759–767. doi: 10.1080/08927020701275050 [DOI] [Google Scholar]
- 75.Farah K, Fogarty AC, Böhm MC, Müller-Plathe F. Temperature dependence of coarse-grained potentials for liquid hexane. Phys Chem Chem Phys 2011;13(7):2894–2902. doi: 10.1039/C0CP01333A [DOI] [PubMed] [Google Scholar]
- 76.Uche LE, Gooris GS, Bouwstra JA, Beddoes CM. Increased Levels of Short-Chain Ceramides Modify the Lipid Organization and Reduce the Lipid Barrier of Skin Model Membranes. Langmuir 2021;37(31):9478–9489. doi: 10.1021/acs.langmuir.1c01295 [DOI] [PMC free article] [PubMed] [Google Scholar]
- 77.Kováčik A, Pullmannová P, Opálka L, Šilarová M, Maixner J, Vávrová K. Effects of (R)- and (S)-α-Hydroxylation of Acyl Chains in Sphingosine, Dihydrosphingosine, and Phytosphingosine Ceramides on Phase Behavior and Permeability of Skin Lipid Models. Int J Mol Sci 2021;22(14):7468. doi: 10.3390/ijms22147468 [DOI] [PMC free article] [PubMed] [Google Scholar]
- 78.Iwai I, Han H, Den Hollander L, et al. The Human Skin Barrier Is Organized as Stacked Bilayers of Fully Extended Ceramides with Cholesterol Molecules Associated with the Ceramide Sphingoid Moiety. J Invest Dermatol 2012;132(9):2215–2225. doi: 10.1038/jid.2012.43 [DOI] [PubMed] [Google Scholar]
- 79.Wassenaar TA, Pluhackova K, Böckmann RA, Marrink SJ, Tieleman DP. Going Backward: A Flexible Geometric Approach to Reverse Transformation from Coarse Grained to Atomistic Models. J Chem Theory Comput 2014;10(2):676–690. doi: 10.1021/ct400617g [DOI] [PubMed] [Google Scholar]
- 80.Uchiyama M, Oguri M, Mojumdar EH, Gooris GS, Bouwstra JA. Free fatty acids chain length distribution affects the permeability of skin lipid model membranes. Biochim Biophys Acta - Biomembr 2016;1858(9):2050–2059. doi: 10.1016/j.bbamem.2016.06.001 [DOI] [PubMed] [Google Scholar]
- 81.Pascher I Molecular arrangements in sphingolipids Conformation and hydrogen bonding of ceramide and their implication on membrane stability and permeability. Biochim Biophys Acta - Biomembr 1976;455(2):433–451. doi: 10.1016/0005-2736(76)90316-3 [DOI] [PubMed] [Google Scholar]
- 82.Moore J, Mark E. Rerek D. Insights into the Molecular Organization of Lipids in the Skin Barrier from Infrared Spectroscopy Studies of Stratum Corneum Lipid Models. Acta Derm Venereol 2000;80(208):16–22. doi: 10.1080/000155500750042817 [DOI] [PubMed] [Google Scholar]
- 83.Schroeter A, Stahlberg S, Školová B, et al. Phase separation in ceramide[NP] containing lipid model membranes: neutron diffraction and solid-state NMR. Soft Matter 2017;13(10):2107–2119. doi: 10.1039/C6SM02356H [DOI] [PubMed] [Google Scholar]
- 84.Schmitt T, Lange S, Dobner B, Sonnenberger S, Hauß T, Neubert RHH. Investigation of a CER[NP]- and [AP]-Based Stratum Corneum Modeling Membrane System: Using Specifically Deuterated CER Together with a Neutron Diffraction Approach. Langmuir 2018;34(4):1742–1749. doi: 10.1021/acs.langmuir.7b01848 [DOI] [PubMed] [Google Scholar]
Associated Data
This section collects any data citations, data availability statements, or supplementary materials included in this article.