

Abstract
Despite improvements in survival across races in the past 20 years, African Americans have worse liver transplant outcomes after orthotopic liver transplantation (OLT). This study aims at quantifying the change in disparities between African Americans and other races in survival after OLT. We retrospectively analyzed the United Network for Organ Sharing (UNOS) database for patient data for candidates who received a liver transplant between January 1, 2007 and December 31, 2017. Multivariate Cox proportional hazards regression indicated similar decreases in mortality over time for each race with a decrease in mortality for African Americans: 2010–2012 (HR = .930), 2012–2015 (HR = .882), and 2015–2017 (HR = .883) when compared to 2007–2010. Risk of mortality for African Americans compared to Caucasians varied across the 4 eras: 2007–2010 (HR = 1.083), 2010–2012 (HR = 1.090), 2012–2015 (HR = 1.070), and 2015–2017 (HR = 1.125). While African Americans have seen increases in survival in the past decade, a similar increase in survival for other races leaves a significant survival disparity in African Americans.
Keywords: health disparities, liver transplantation, outcomes, race
1 |. INTRODUCTION
African Americans have seen significant improvements in liver transplant outcomes in the past decade, but racial disparities persist. Survival outcomes for liver transplant recipients for all races have significantly improved in the past 20 years because of dramatic improvements in short-term survival.1 Long-term survival has not changed substantially suggesting that improvements are related to pre-, peri-, and immediately post-operative care resulting in reduced acute rejection rates.2 Standardization of donor organ procurement and recipient implantation operations as well as the use of a multidisciplinary team approach likely contribute to these improvements.3 Diagnosis and treatment of infectious complications has also improved allowing transplant recipients to tolerate more selective, intense, and less toxic immunosuppressive therapy.3
Despite these overall improvements in survival, studies have shown that African American patients have worse liver transplant outcomes than other races, including lower graft function, inferior graft survival, and worse overall short and long-term survival after undergoing OLT.4 One single-center study showed equivalent long-term survival in African Americans with tacrolimus-based immunosuppression (1994–2007), but persistent disparities in short and medium-term survival from 1984 to 1993.5 It has been largely demonstrated by other studies that these disparities do exist.4–12
Though the presence of these disparities is noted in the literature, characterization and analysis of these trends over time is lacking. Hong et al. compares the differences in survival outcomes between African Americans and other races between 1984–1993 and 1994–2007 but does not evaluate the existence or change in disparities over the past decade or utilize a large, multicenter database. Our study aims to determine if disparities are decreasing alongside the aforementioned survival outcome improvements and will highlight changes in specific outcome inequalities. Furthermore, analysis may illuminate the mechanisms underlying these inequalities, which can guide interventions targeted toward promoting equity in liver transplant survival outcomes.
The paper aims at evaluating the existence and quantifying the change in disparities in survival after liver transplantation for African Americans compared to other races between 2007 and 2017. To do this, we conducted a large, retrospective, study of UNOS liver transplant patients in four 2.5-year eras stratified by racial groups: African Americans, Caucasians, and Other Races. Evaluating the change in the known discrepancy in survival among African Americans compared to other races will allow research and policy decisions to be aimed at promoting equity in health outcomes in the future.
2 |. METHODS
2.1 |. Design/Setting/Population/Procedure
We retrospectively analyzed deidentified patient data of all candidates listed for liver transplant between January 1, 2007 and June 31, 2017, using the United Network for Organ Sharing (UNOS) data. Patient consent and study approval were waived by the institutional review board because patient information was deidentified and not reported in the study. Demographic characteristics for patient and donor grouped by era are summarized in Table 1.
Table 1.
Demographics Characteristics
| Recipient | Era 1 (2007–2010) | Era 2 (2010–2012) | Era 3 (2012–2015) | Era 4 (2015–2017) |
|---|---|---|---|---|
| No. Patients | 13,345 | 12,361 | 13,510 | 14,456 |
| Age | 53.7 ± 10.1 | 54.7 ± 10.1 | 55.5 ± 10.3 | 55.7 ± 10.8 |
| % Female | 32 | 33 | 33 | 33.5 |
| %African American | 9.4 | 10.2 | 9.7 | 8.8 |
| % Caucasian | 71.6 | 70.3 | 71.4 | 71.3 |
| % Other Races | 19.03 | 19.49 | 18.9 | 19.85 |
| Height (cm) | 172.3 ± 10.1 | 172.1 ± 10.1 | 172.1 ± 10.3 | 171.9 ± 10.3 |
| Weight (kg) | 84.3 ± 19.5 | 84.7 ± 19.5 | 84.9 ± 19.5 | 85.7 ± 20 |
| INR | 1.9 ± 1.4 | 2 ± 1.2 | 2 ± 1.1 | 2 ± 1.1 |
| Creatinine (mg/dL) | 1.4 ± 1 | 2 ± 1.2 | 2 ± 1.1 | 2 ± 1.4 |
| MELD | 21.4 ± 10.1 | 22.4 + 10.8 | 22.5 + 11.3 | 22.8 ± 11.3 |
| Cause of Liver Failure | ||||
| Acute hepatic necrosis | 4.70% | 4.36% | 3.92% | 3.21% |
| Cholestatic liver disease | 7.54% | 7.76% | 7.22% | 7.46% |
| Metabolic liver disease | 2.66% | 2.49% | 2.58% | 2.61% |
| Malignancy | 23.99% | 27.72% | 29.47% | 27.14% |
| Hepatitis C | 22.63% | 21.37% | 19.96% | 13.84% |
| Hepatitis B | 1.89% | 1.51% | 1.41% | 1.34% |
| Alcoholic cirrhosis | 10.63% | 10.99% | 11.62% | 17.16% |
| Cold ischemia time (hrs) | 7.1 ± 3.2 | 6.5 ± 2.8 | 6.3 ± 2.5 | 6.1 ± 2.3 |
| Donor | ||||
| No. Patients | 13,345 | 12,361 | 13,510 | 14,456 |
| Age | 41.8 ± 17.1 | 41.7 ± 16.6 | 41.8 ± 16.4 | 41.4 ± 16.2 |
| % Female | 39.8 | 41.2 | 40.4 | 40.2 |
| % African American | 17.2 | 18.3 | 18.3 | 18.2 |
| % Caucasian | 66.4 | 65.12 | 65.3 | 64.5 |
| Height (cm) | 171.6 ± 10.9 | 171.3 ± 10.8 | 171.3 ± 10.8 | 171.1 ± 10.8 |
| Weight (kg) | 80.2 ± 20 | 80.9 ± 20 | 81.8 ± 20.6 | 82.5 ± 21.4 |
| Creatinine (mg/dL) | 1.6 ± 1.7 | 1.5 ± 1.6 | 1.6 ± 1.7 | 1.7 ± 1.9 |
| Cause of Death | ||||
| CVA | 60.6 | 63.9 | 65.4 | 68.8 |
| Trauma | 36.1 | 33.5 | 32.2 | 28.7 |
2.2 |. Sampling
We exclusively used donor and recipient characteristics reported at the time of transplant. The follow-up information used was collected at 6 months, and then yearly after transplantation. Candidates were followed from the time of listing to death after transplantation or to the last known follow-up. Patients who were lost to follow-up (3.5%) or alive on June 31, 2017, were censored at the date of last known follow-up, and only patients who received a transplant were included in the analysis.
Patients were excluded if < 18 years of age (n = 17,834), required a living donor (n = 5,534), or required a transplant of another organ (n = 10,715). A separate analysis was performed with patients requiring a living donor as this population differs greatly and there are host of socioeconomic and psychosocial factors at play (Tables S1 and S2). The final analysis included liver transplant patients in 2007–2010 (Era 1, n = 13,345), 2010–2012 (Era 2, n = 12,361), 2012–2015 (Era 3, n = 13,510), and 2015–2017 (Era 4, n = 14,456) (Table 1). Patients who were retransplanted were included (3.86%).
2.2.1 |. Eras
Four 2.5-year cohorts were created to track outcomes over time: 2007–2010, 2010–2012, 2012–2015, and 2015–2017. Our study focuses on this decade as a great deal of change was observed during this period, and the 2.5-year eras were the minimum amount of time needed to power our analysis.
2.2.2 |. Race
Patients were categorized into cohorts according to race including African American, Caucasian, or Other (Hispanic, Asian, other races).
2.3 |. Data collection
UNOS data were analyzed for outcomes for adult liver transplant recipients who received a liver in the 10-year period 2007–2017 using the general-purpose statistical software package Stata® 16.1 (Stata Corp). Continuous variables were reported as mean ± standard deviation with a p-value of < .05 being considered statistically significant, and all reported p values were 2-sided. The primary outcome was defined as overall post-transplant mortality.
2.4 |. Data analysis
Univariate and multivariate Cox proportional hazard models were used to calculate era specific African American-Caucasian hazard ratios and race specific survival over time hazard ratios. Univariate Cox proportional hazard models were used to determine which variables significantly affected mortality for each of the four eras. Additionally, univariate Cox proportional hazard models were used to determine which variables significantly affected mortality for each of the three racial groups over time. We evaluated every possible variable to make the analysis comprehensive for our large study population. Statistically significant variables were included in the multivariate Cox proportional hazard model analysis for the three racial groups and each of the four eras, respectively (Tables 2–4). The results are represented in Cox proportional hazard ratio with HR > 1 representing increase probability of overall mortality. Post-transplant survival for each racial group over time and for all three racial groups in each era were visualized using Kaplan–Meier curves (Figures 1 and 2, respectively).
Table 2.
Multivariate Cox Proportional Hazards Regression for Improvement in African American Outcomes Over Time
| Race | African Americans |
Caucasians |
Other Races |
|||
|---|---|---|---|---|---|---|
| HR (95% CI) | p-value | HR (95% CI) | p-value | HR (95% CI) | p-value | |
|
| ||||||
| Era 1 (2007–2010) | Reference | Reference | Reference | |||
| Era 2 (2010–2012) | 0.930 (0.881, 0.981) | 0.008 | 0.940 (0.919, 0.960) | <0.001 | 0.931 (0.891, 0.973) | 0.002 |
| Era 3 (2012–2015) | 0.882 (0.847, 0.919) | <0.001 | 0.914 (0.900, 0.929) | <0.001 | 0.899 (0.870, 0.929) | <0.001 |
| Era 4 (2015–2017) | 0.883 (0.851, 0.915) | <0.001 | 0.883 (0.871, 0.896) | <0.001 | 0.890 (0.866, 0.915) | <0.001 |
Table 4.
Multivariate Cox Proportional Hazards Regression for Disparities in Survival Over Time.
| Era 3 (2012–2015) | Era 4 (2015–2017) | ||||
|---|---|---|---|---|---|
|
| |||||
| Variable | HR (95% CI) | p-value | Variable | HR (95% CI) | p-value |
|
| |||||
| Recipient Age 18–30 | 0.685 (0.526, 0.892) | 0.005 | Reciepient Age 30–60 | 1 (Reference Range) | 0 |
| Reciepient Age 30–60 | 1 (Reference Range) | 0 | Recipient Age 60–65 | 1.359 (1.203, 1.534) | <0.001 |
| Recipient Age 60–65 | 1.358 (1.233, 1.496) | <0.001 | Recipient Age > 65 | 1.502 (1.319, 1.709) | <0.001 |
| Recipient Age > 65 | 1.524 (1.366, 1.700) | <0.001 | Donor Age 30–45 | 1 (Reference Range) | 0 |
| Donor Age 15–20 | 0.865 (0.735, 1.019) | 0.083 | Donor Age 60–70 | 1.316 (1.138, 1.522) | <0.001 |
| Donor Age 20–30 | 0.887 (0.790, 0.997) | 0.044 | Donor Age > 70 | 1.462 (1.159, 1.846) | 0.001 |
| Donor Age 30–45 | 1 (Reference Range) | 0 | Hemodialysis Prior to Transplant | 1.078 (0.887, 1.309) | 0.45 |
| Donor Age 45–55 | 1.109 (0.996, 1.235) | 0.059 | High School Education | 1.131 (1.015, 1.261) | 0.026 |
| Donor Age 60–70 | 1.202 (1.055, 1.369) | 0.006 | Bachelors Degree | 0.933 (0.810, 1.075) | 0.337 |
| Donor Age > 70 | 1.248 (1.021, 1.524) | 0.03 | Encephalopathy | 1.169 (1.007, 1.356) | 0.04 |
| BMI <30 | 1 (Reference Range) | 0 | MELD Score 35–40 | 1.066 (0.879, 1.293) | 0.516 |
| BMI 35 – 40 | 0.870 (0.763, 0.992) | 0.037 | MELD Score >40 | 0.941 (0.742, 1.192) | 0.614 |
| Creatinine Donor <1.5 | 1 (Reference Range) | 0 | Serum Sodium 145 –150 mEq/L | 1.139 (0.885, 1.466) | 0.313 |
| Creatinine Donor > 2.0 | 1.085 (0.982, 1.198) | 0.108 | Serum Sodium > 155 mEq/L | 2.370 (0.970, 5.791) | 0.058 |
| Hemodialysis Prior to Transplant | 1.250 (1.077, 1.451) | 0.003 | Functional Status 10% | 1.107 (0.843, 1.453) | 0.464 |
| Bachelors Degree | 0.838 (0.750, 0.937) | 0.002 | Functional Status 20% | 1.135 (0.942, 1.367) | 0.182 |
| Encephalopathy | 1.004 (0.881, 1.145) | 0.95 | Functional Status 30–40% | 1 (Reference Range) | 0 |
| MELD Score >40 | 0.990 (0.847, 1.157) | 0.898 | Functional Status 70% | 0.829 (0.705, 0.976) | 0.024 |
| Serum Sodium 125–130 mEq/L | 0.917 (0.800, 1.052) | 0.217 | Functional Status 80% | 0.772 (0.640, 0.931) | 0.007 |
| Serum Sodium 150–155 mEq/L | 1.883 (1.307, 2.712) | 0.001 | Functional Status 90% | 0.782 (0.570, 1.073) | 0.127 |
| Serum Sodium > 155 mEq/L | 2.051 (0.914, 4.601) | 0.081 | Height Difference of 30 – 60 cm | 1.500 (1.114, 2.019) | 0.007 |
| Functional Status 10% | 0.963 (0.770, 1.204) | 0.74 | Life Support for Tranplant Patient | 1.223 (0.915, 1.635) | 0.174 |
| Functional Status 20% | 1.097 (0.962, 1.251) | 0.166 | ICU Stay | 1.007 (0.787, 1.289) | 0.955 |
| Functional Status 30–40% | 1 (Reference Range) | 0 | Hospitalization | 1.078 (0.920, 1.262) | 0.355 |
| Functional Status 70% | 0.801 (0.702, 0.913) | 0.001 | 2nd Transplant Within 90 Days of 1st Transplant | 2.355 (1.801, 3.078) | <0.001 |
| Functional Status 80% | 0.827 (0.722, 0.948) | 0.007 | 2nd Transplant After 90 Days of 1st Transplant | 1.999 (1.479, 2.703) | <0.001 |
| Functional Status 90% | 0.798 (0.643, 0.990) | 0.04 | 3rd Transplant Within 90 Days of 1st Transplant | 1.000 (0.000, 0.000) | <0.001 |
| Life Support for Tranplant Patient | 1.504 (1.152, 1.963) | 0.003 | 3rd Transplant After 90 Days of 1st Transplant | 14.180 (5.170, 38.893) | <0.001 |
| ICU Stay | 1.005 (0.840, 1.201) | 0.96 | Ventilation | 1.245 (0.912, 1.700) | 0.168 |
| 2nd Transplant Within 90 Days of 1st | 1.771 (1.406, 2.231) | <0.001 | History of Portal Vein Thrombosis at Registration | 1.006 (0.814, 1.243) | 0.958 |
| 2nd Transplant After 90 Days of 1st | 1.295 (0.977, 1.716) | 0.072 | History of Portal Vein Thrombosis at Transplant | 1.195 (1.019, 1.402) | 0.029 |
| 3rd Transplant Within 90 Days of 1st | 1.000 (0.000, 0.000) | <0.001 | Private Insurance | 0.904 (0.814, 1.004) | 0.059 |
| Ventilation | 1.129 (0.859, 1.485) | 0.385 | Previous Abdominal Surgery | 1.064 (0.960, 1.178) | 0.237 |
| History of PVT at Transplant | 1.178 (1.051, 1.320) | 0.005 | Region: DE, DC, MD, NJ, PA, N. VA, WV | 1.170 (1.020, 1.342) | 0.025 |
| Private Insurance | 0.859 (0.789, 0.935) | <0.001 | Region: IN, MI, OH | 0.846 (0.711, 1.008) | 0.061 |
| Previous Abdominal Surgery | 1.049 (0.966, 1.138) | 0.257 | Regional Procurement | 1.074 (0.960, 1.201) | 0.212 |
| Ventilation | 1.150 (1.026, 1.290) | 0.016 | Total Bilirubin 2–8 mg/dL | 1 (Reference Range) | 0 |
| Region: AK, HI, ID, MT, OR, WA | 0.836 (0.638, 1.096) | 0.195 | Total Bilirubin 16 – 32 mg/dL | 0.978 (0.824, 1.161) | 0.801 |
| African American Recipient | 1.070 (1.008, 1.136) | 0.026 | Total Bilirubin > 32 mg/dL | 1.027 (0.817, 1.292) | 0.818 |
|
|
|||||
| African American Recipient | 1.125 (1.046, 1.209) | 0.001 | |||
FIGURE 1.
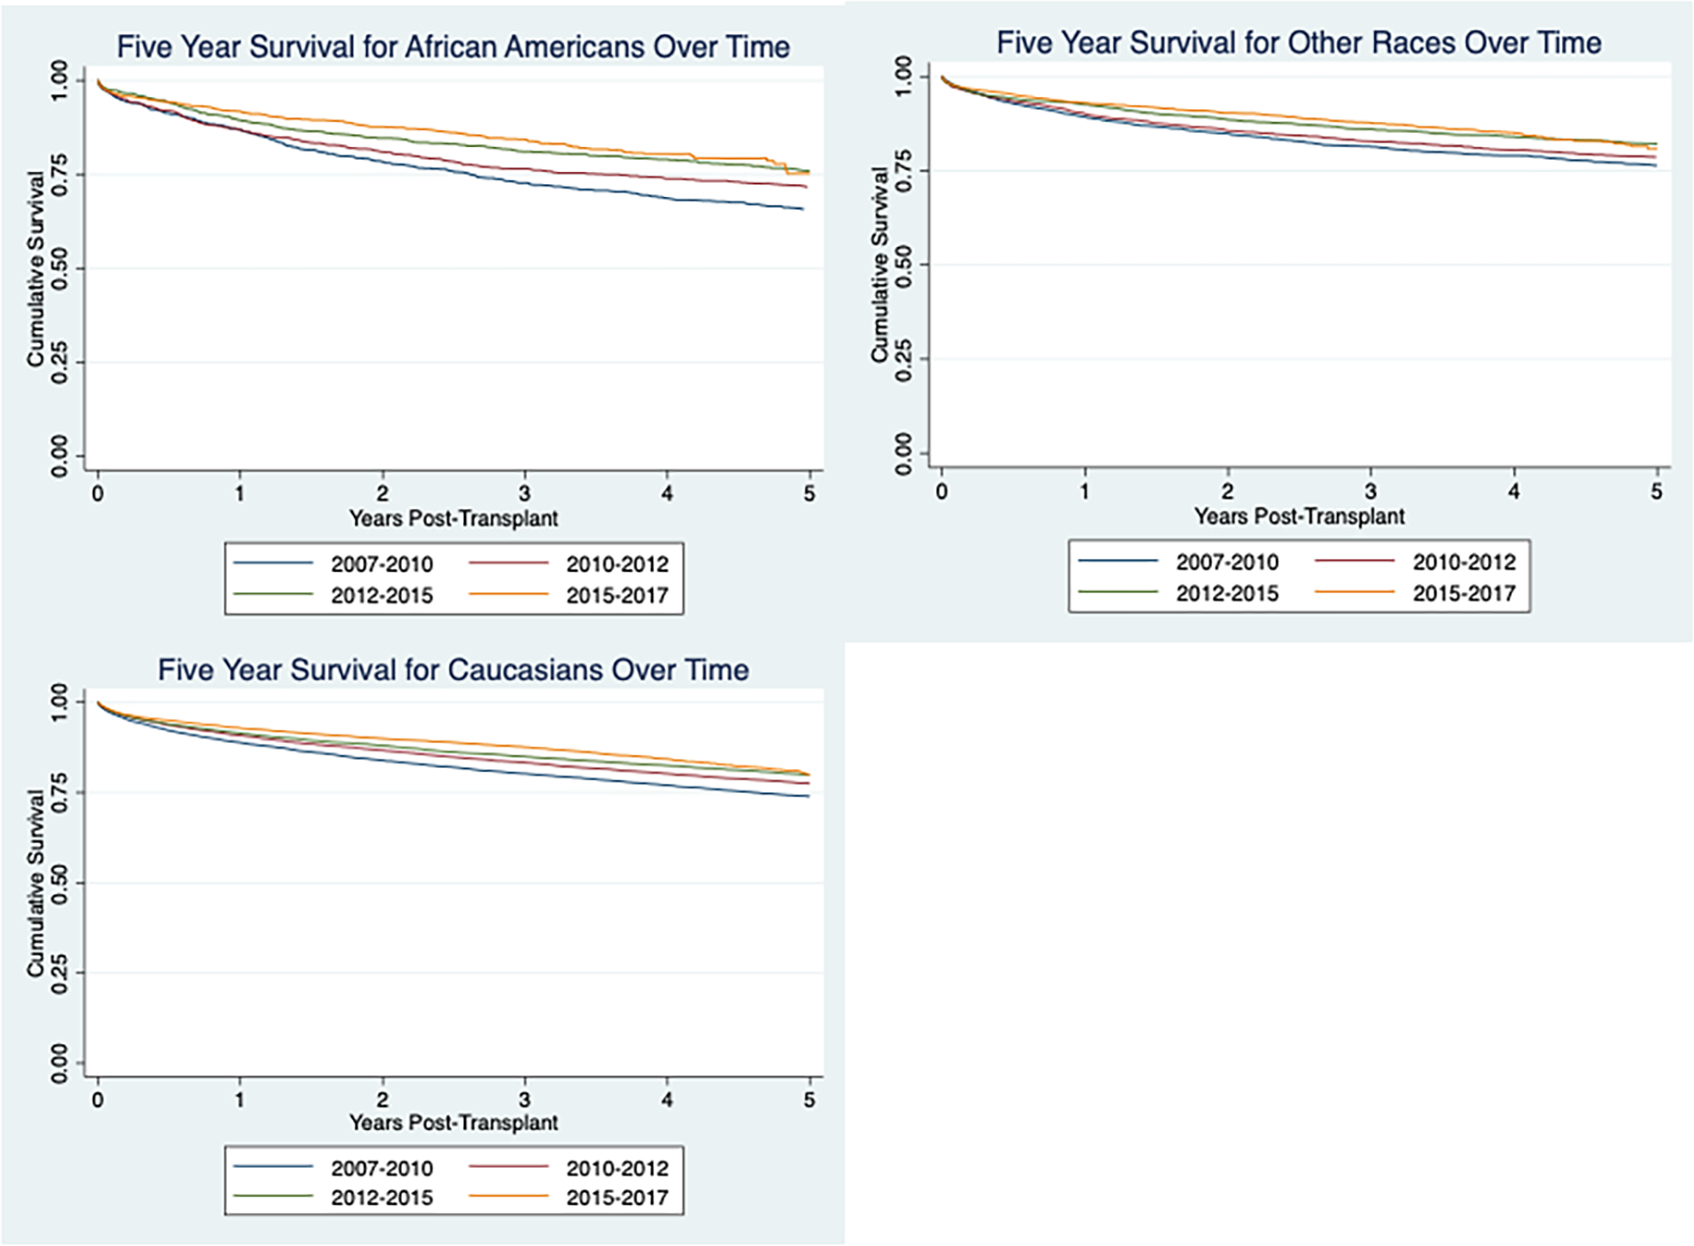
Improvement in African American survival over time
FIGURE 2.
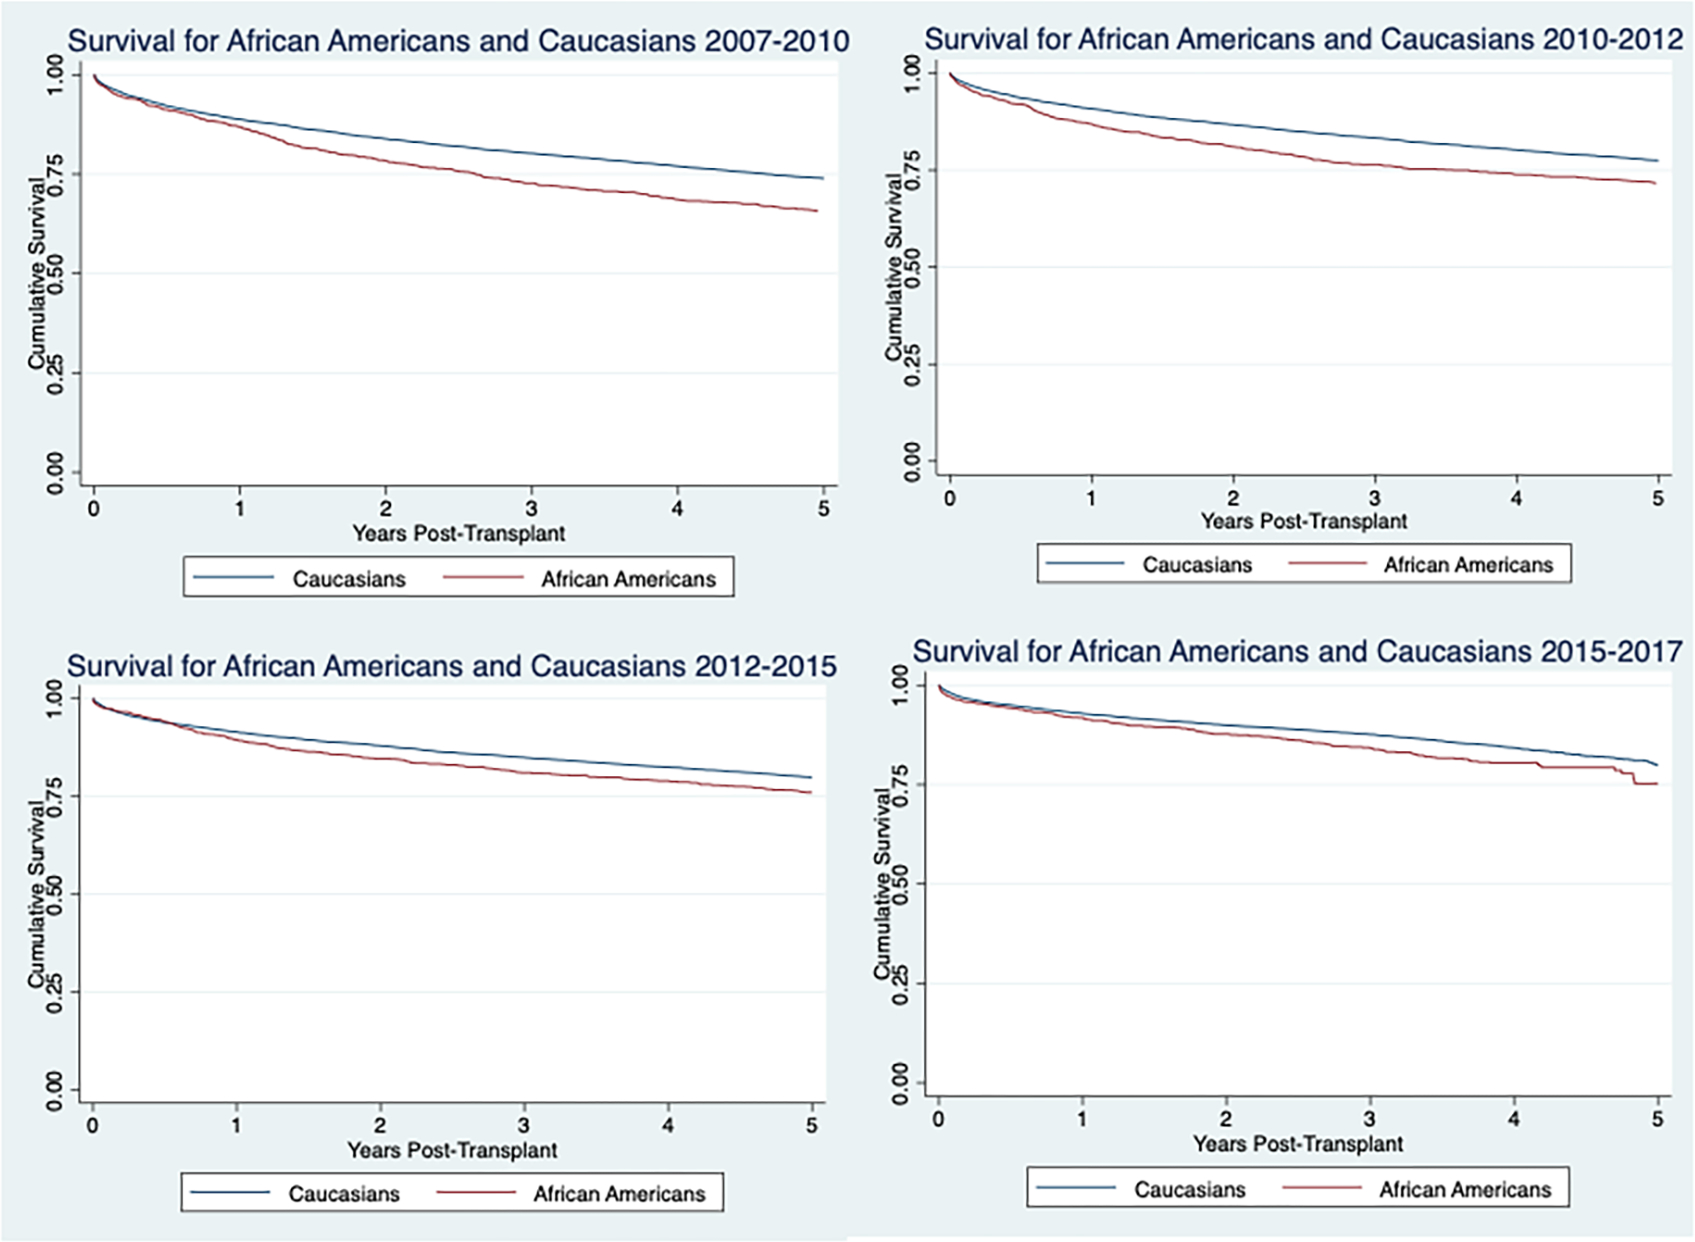
5-Year survival for African Americans versus Caucasians in each era
3 |. RESULTS
3.1 |. Improvement in African American outcomes over time
Univariate cox proportional analysis was used to identify variables that were significant (defined as p < .05). All factors significant in the univariate analysis were controlled for in the multivariate analysis (Table 2). Multivariate analysis showed similar decrease in mortality over time for each race with a 7% (HR = .930(.881, .981), p = .008, 12% (HR = .882 (.847, .919), p = <.001, and 12% (HR = .883 (.851, .915), p=<.001) decrease in mortality for African Americans for era 2, 3, and 4, respectively when compared to era 1. There was a 6% (HR = .940 (.919, .960), p = <.001), 9% (HR = .914 (.900, .929), p < .001), and 12% (HR = .883 (.871, .896), p < .001) decrease in mortality for Caucasians for era 2, 3, and 4 respectively compared to era 1. There was a 7% (HR = .931(.891, .973), p = .002, 10% (HR = .899 (.870, .929), p < .001) 11% (HR = .890 (.866, .915, p < .001) decrease in mortality for other races for era 2, 3, and 4, respectively compared to era 1.
Overall, 5-year survival over time was evaluated with Kaplan–Meier curves for African Americans, Caucasians, and others (Figure 1). All races demonstrated a decrease in mortality over the four eras with African Americans appearing to have a more substantial decrease in mortality. However, this is not observed in the adjusted survival data.
4 |. 5-YEAR SURVIVAL FOR AFRICAN AMERICANS VERSUS CAUCASIANS IN EACH ERA
Univariate Cox proportional analysis was used to identify variables that significantly affected the hazard ratio. All factors significant in the univariate analysis were controlled for in the multivariate analysis (Tables 3 and 4). There was a statistically significant difference in survival for African Americans compared to Caucasians in 2007–2010, 2010–2012, 2012–2015, and 2015–2017 with the p-values being .001, .001, .003, and .001, respectively. There was no obvious trend in the change in disparities between African Americans and Caucasians over time. The risk for mortality for being African American for each era, is 8% (HR = 1.083 (1.034, 1.134, p = .001), 9% (HR = 1.090 (1.035, 1.149), p = .001), 7% (HR = 1.070 (1.008, 1.136), 026), and 12% (HR = 1.125 (1.046, 1.209), p = .001), respectively.
Table 3.
Multivariate Cox Proportional Hazards Regression for Disparities in Survival Over Time.
| Era 1 (2007–2010) | Era 2 (2010–2012) | ||||
|---|---|---|---|---|---|
|
| |||||
| Variable | HR (95% CI) | p-value | Variable | HR (95% CI) | p-value |
|
|
|||||
| Recipient Age 18–30 | 0.662 (0.545, 0.805) | <0.001 | Recipient Age 18–30 | 0.743 (0.591, 0.934) | 0.011 |
| Reciepient Age 30–60 | 1 (Reference Range) | 0 | Reciepient Age 30–60 | 1 (Reference Range) | 0 |
| Recipient Age 60–65 | 1.303 (1.201, 1.414) | <0.001 | Recipient Age 60–65 | 1.306 (1.193, 1.429) | <0.001 |
| Recipient Age > 65 | 1.477 (1.339, 1.628) | <0.001 | Recipient Age > 65 | 1.551 (1.396, 1.723) | <0.001 |
| Donor Age 10–15 | 0.706 (0.551, 0.904) | 0.006 | Donor Age 15–20 | 0.785 (0.685, 0.898) | <0.001 |
| Donor Age 15–20 | 0.828 (0.746, 0.921) | Donor Age 20–30 | 0.893 (0.808, 0.988) | 0.028 | |
| Donor Age 20–30 | 0.807 (0.738, 0.883) | <0.001 | Donor Age 30–45 | 1 (Reference Range) | 0 |
| Donor Age 30–45 | 1 (Reference Range) | 0 | Donor Age 55–60 | 1.139 (1.006, 1.290) | 0.04 |
| Donor Age 55–60 | 1.165 (1.045, 1.299) | 0.006 | Donor Age 60–70 | 1.160 (1.037, 1.299) | 0.01 |
| Donor Age 60–70 | 1.276 (1.161, 1.402) | <0.001 | Donor Age > 70 | 1.455 (1.228, 1.725) | <0.001 |
| Donor Age > 70 | 1.275 (1.110, 1.464) | 0.001 | Hepititis C | 1.192 (1.096, 1.296) | <0.001 |
| Albumin >2.5 g/dL | 1 (Reference Range) | 0 | Hemodialysis Prior to Transplant | 1.368 (1.191, 1.572) | <0.001 |
| Albumin 1.5 – 2.0 g/dL | 1.172 (1.051, 1.307) | 0.004 | High School Dropout | 1.052 (0.973, 1.138) | 0.202 |
| BMI <30 | 1 (Reference Range) | 0 | Bachelors Degree | 0.913 (0.820, 1.018) | 0.1 |
| BMI > 40 | 0.814 (0.683, 0.969) | 0.021 | Encephalopathy | 1.050 (0.933, 1.182) | 0.421 |
| Cold Ischemia Time < 6 hrs | 0.950 (0.892, 1.012) | 0.11 | Heptaocellular Carcinoma | 1.305 (1.188, 1.432) | <0.001 |
| Creatinine Donor <1.5 | 1 (Reference Range) | 0 | MELD Score >40 | 0.910 (0.781, 1.060) | 0.225 |
| Creatinine Donor 1.5 – 2.0 | 1.081 (0.986, 1.185) | 0.096 | Serum Sodium 130–135 mEq/L | 0.957 (0.882, 1.038) | 0.286 |
| Hepititis C | 1.196 (1.114, 1.284) | <0.001 | Serum Sodium 145 –150 mEq/L | 1.322 (1.090, 1.602) | 0.004 |
| Hemodialysis Prior to Transplant | 1.114 (0.966, 1.286) | 0.138 | Functional Status 10% | 1.164 (0.943, 1.436) | 0.158 |
| High School Dropout | 1.123 (0.937, 1.345) | 0.209 | Functional Status 20% | 1.012 (0.884, 1.157) | 0.865 |
| Bachelors Degree | 0.917 (0.837, 1.005) | 0.063 | Functional Status 30–40% | 1 (Reference Range) | 0 |
| Encephalopathy | 1.034 (0.930, 1.149) | 0.536 | Functional Status 60% | 0.884 (0.787, 0.993) | 0.037 |
| Heptaocellular Carcinoma | 1.226 (1.128, 1.333) | <0.001 | Functional Status 80% | 0.858 (0.765, 0.962) | 0.009 |
| MELD Score >40 | 1.085 (0.936, 1.259) | 0.279 | Life Support for Tranplant Patient | 0.928 (0.690, 1.248) | 0.621 |
| Serum Sodium < 125 mEq/L | 0.809 (0.674, 0.972) | 0.024 | ICU Stay | 1.105 (0.917, 1.332) | 0.293 |
| Serum Sodium 145 –150 mEq/L | 1.116 (0.930, 1.340) | 0.238 | Hospitalization | 1.165 (1.034, 1.313) | 0.012 |
| Serum Sodium 160–199 mEq/L | 3.792 (1.544, 9.315) | 0.004 | 2nd Transplant Within 90 Days of 1st | 5.619 (0.779, 40.513) | 0.087 |
| Functional Status 10% | 1.255 (1.022, 1.540) | 0.03 | 2nd Transplant After 90 Days of 1st | 4.008 (0.554, 28.985) | 0.169 |
| Functional Status 20% | 1.137 (1.001, 1.292) | 0.048 | 3rd Transplant Within 90 Days of 1st | 0.407 (0.057, 2.910) | 0.37 |
| Functional Status 30–40% | 1 (Reference Range) | 0 | More Than 3 Transplants | 3.054 (1.447, 6.444) | 0.003 |
| Functional Status 50% | 1.093 (0.992, 1.205) | 0.073 | Ventilation | 1.428 (1.042, 1.959) | 0.027 |
| Functional Status 80% | 0.862 (0.791, 0.940) | 0.001 | History of PVT at Registration | 1.235 (1.031, 1.479) | 0.022 |
| Functional Status 90% | 0.774 (0.667, 0.897) | 0.001 | History of Portal Vein Thrombosis at Transplant | 1.030 (0.910, 1.165) | 0.639 |
| Hepatitis C in Donor | 1.181 (1.004, 1.389) | 0.045 | Private Insurance | 0.816 (0.756, 0.881) | <0.001 |
| INR <2 | 1 (Reference Range) | 0 | Previous Abdominal Surgery | 1.093 (1.014, 1.177) | 0.019 |
| INR 3.5 – 4.0 | 0.674 (0.488, 0.930) | 0.016 | Region: DE, DC, MD, NJ, PA, N. VA, WV | 1.106 (0.995, 1.230) | 0.062 |
| Life Support for Tranplant Patient | 0.948 (0.655, 1.372) | 0.776 | Region: AL, AR, FL, GA, LA, MS, PR | 0.931 (0.843, 1.028) | 0.155 |
| ICU Stay | 1.202 (1.014, 1.425) | 0.034 | Region: AK, HI, ID, MT, OR, WA | 0.803 (0.631, 1.023) | 0.076 |
| Hospitalized not in ICU Pre-Transplant | 1.125 (1.015, 1.246) | 0.025 | ALT < 60 u/L | 1 (Reference Range) | 0 |
| 2nd Transplant Within 90 Days of 1st Transplant | 1.555 (0.493, 4.905) | 0.452 | ALT 60 –100 u/L | 0.909 (0.812, 1.017) | 0.097 |
| 2nd Transplant After 90 Days of 1st Transplant | 0.971 (0.307, 3.071) | 0.96 | Total Bilirubin 2–8 mg/dL | 1 (Reference Range) | 0 |
| 3rd Transplant Within 90 Days of 1st Transplant | 1.400 (0.447, 4.380) | 0.563 | Total Bilirubin 8 – 16 mg/dL | 0.987 (0.884, 1.102) | 0.816 |
| 3rd Transplant After 90 Days of 1st Transplant | 3.286 (1.839, 5.872) | <0.001 | African American Recipient | 1.090 (1.035, 1.149) | 0.001 |
|
|
|||||
| Ventilation | 1.134 (0.776, 1.659) | 0.516 | |||
| History of PVT at Registration | 1.261 (1.054, 1.508) | 0.011 | |||
| History of PVT at Transplant | 1.004 (0.887, 1.136) | 0.949 | |||
| Private Insurance | 0.824 (0.765, 0.888) | <0.001 | |||
| Medicaid | 1.042 (0.938, 1.158) | 0.445 | |||
| Previous Abdominal Surgery | 1.092 (1.024, 1.163) | 0.007 | |||
| Region: DE, DC, MD, NJ, PA, N. VA, WV | 1.190 (1.090, 1.301) | <0.001 | |||
| Region: AL, AR, FL, GA, LA, MS, PR | 1.000 (0.000, 0.000) | <0.001 | |||
| Region: AZ, CA, NV, NM, UT | 0.817 (0.727, 0.918) | 0.001 | |||
| Region: AK, HI, ID, MT, OR, WA | 0.794 (0.646, 0.975) | 0.027 | |||
| Region: NY, VT | 1.093 (0.960, 1.243) | 0.178 | |||
| National Procurement | 1.035 (0.902, 1.188) | 0.622 | |||
| Total Bilirubin 2–8 mg/dL | 1 (Reference Range) | 0 | |||
| Total Bilirubin < 2 mg/dL | 1.187 (1.097, 1.284) | <0.001 | |||
| Total Bilirubin 8 – 16 mg/dL | 0.977 (0.887, 1.076) | 0.637 | |||
| African American Recipient | 1.083 (1.034, 1.134) | 0.001 | |||
Overall 5-year survival for African Americans versus Caucasians was evaluated with Kaplan–Meier curves for each era (Figure 2). The disparities appear to be decreasing over the four eras. However, this trend is not present in the adjusted survival data.
5 |. DISCUSSION
Our study identified a significant and consistent difference in improvement of survival outcomes after liver transplant for African Americans when compared to Caucasians from 2007 to 2017. Although African Americans have improved survival rates after OLT in recent years, other races faced similar or greater improvements in the same time span. These results highlight the need for changes to be made to ensure African Americans receive equitable benefit from the substantial improvement in pre-, peri-, and postoperative care surrounding liver transplantation in the past decade.
This finding is consistent with prior studies, which demonstrate worse liver transplant outcomes for African Americans compared to other races, including worse overall short and long-term survival after undergoing OLT.4 This difference in survival persists despite controlling for recipient and donor characteristics, geographic region, donor service area, and individual hospitals.3
The prior studies discussed above focus largely on static differences. One single-center study compared survival in two eras: before tacrolimus-based immunosuppression (1984–1993) and after (1994–2007). Analysis showed equivalent long-term survival in African Americans with tacrolimus-based immunosuppression, but disparities in short and medium-term survival from 1984–1993.5 No multi-center study has attempted to quantify the change in this disparity over time. The current study uses a larger and more updated multi-center database than the previous study. We were thus able to fill in this gap in the literature and quantify the change in disparity in survival over the past decade in 2.5-year intervals. Our analysis did not reveal any improvements in the long existing disparities in African American survival following OLT.
In the future, it is imperative that sources of racial disparities in liver transplant outcomes be identified and investigated. While the research investigating explanations of racial disparities in liver transplantation is less robust, data from renal transplantation literature suggests center-level characteristics, disease severity, comorbidity, low referral rates, and socioeconomic status may all contribute to disparities in solid organ transplantation.13,14 Socioeconomic status likely serves as a proxy for several other explanatory factors such as neighborhood factors, area-level health statistics, access to affordable housing and food, poor health literacy, unintentional medication nonadherence, access to high quality follow up care, and cultural barriers that are not well quantified by the UNOS database.4 Societal bias has led to the unequal distribution of wealth, education, and employment opportunities resulting in a disproportionately high number of African Americans in lower socioeconomic groups.15 A socioeconomic environment unique to African Americans may limit availability of suitable organs and makes the fulfillment of rigid criteria required for transplant, such as social support and adherence to medical care, more challenging.16
Center-level and system-level factors such as transplant volume, policies, available capital, and structural center-level practices in addition to health care segregation potentially account for these observed differences. Center-level factors have been found to account graft outcomes disparities in African American patients following kidney transplant.14 There is evidence that significant health-care segregation occurs such that a minority of healthcare systems account for the care of the majority of African Americans and these tend to be lower performing health-centers with lower volume and higher mortality rates.17,18 Within liver transplantation, African Americans are treated at lower quality centers and have higher risk of graft failure and death after transplant.8 Studies regarding the impact of transplant volume and quality rating of transplant centers have been conflicting with some evidence that low-volume centers and centers with lower quality ratings have higher mortality.4,19,20 These center and system-level factors likely have a substantial impact on racial disparities in liver transplantation. Center-level analysis may further support proposed explanations; however, given the retrospective registry nature of this study, we were unable to assess the effects of center-level factors on changes in disparities between races.
Many studies have postulated that disparities in access to liver transplants among African Americans offer an explanation for worse outcomes. Being African American is significantly associated with lower rates of referral, delayed referral, lower rates of waitlisting, and higher MELD scores.13,21–26 This reduced access and delayed referral is likely due to medical, financial, social, and geographical factors as well as patient and physician influences.24 A retrospective study of VA patients demonstrated an 85% decrease in the odds of mentioning liver transplantation as compared with whites.21 Distance from a transplant center also plays a role is restricting African Americans access to liver transplants with increasing distance being associated with higher mortality.27 It could also be that limited access to health care, cultural barriers, and lower SES may lead some to seek medical attention later.22 Recent studies have found that while African Americans have an equal chance of receiving a liver transplant in the post-MELD era after being listed, they are more likely to be younger and present with advanced or aggressive liver disease and have a higher waitlist mortality.24,28 Taken together, barriers in access described above potentially account for differential disease burden at presentation.
Furthermore, disease burden is not equal. African Americans are more likely to have ALD, chronic hepatitis B, chronic hepatitis C, and HCC and higher mortality than their non-Hispanic white counterparts. Leading causes of chronic liver disease (HCV and ALD) are largely preventable and disproportionately affect African Americans through socioeconomic status and cultural factors as well as biological vulnerability.13 African American race and alcoholic liver disease are independently associated with decreased likelihood of physicians mentioning liver transplant as a possible treatment option.21 African Americans with HCV are less likely to receive referral for therapy, respond to interferon therapy for HCV treatment, receive temporizing shunt procedure for ascites and variceal bleeding and more likely to have delayed endoscopic hemostatic for variceal bleeds and have recurrence of HCV.29,30 African American patients see higher rates of HCC, higher rates of mortality, and are more likely to present at an earlier age, with metastases and less likely to have resective surgery.13,31 These together suggest barriers in access to timely and quality care as well as the presence of implicit bias among physicians, but further understanding of the patient-physician level interaction is necessary.15
Biological impediments may also contribute to inferior outcomes post-OLT in African Americans. A reduced immunosuppressive effect has been observed in African American patients compared to Caucasian patients. This impaired immunosuppressive effect of tacrolimus is likely related to the enhanced immune responsiveness observed in African American recipients, which increases the risk of rejection. Different polymorphisms in drug metabolizing enzymes can potentially account for variations in response to immunosuppressive medications.23 Compensating for this risk with high doses of immunosuppressive drugs can lead to infectious complications in this population. Additional efforts aimed at identifying these genetic variations affecting bio-availability of immunosuppressive drugs and immune responsiveness are needed. Furthermore, Alvarado et al. found twice the rate in post-OLT ESRD and an almost 10-fold increase in mortality due to post-OLT ESRD in African Americans compared to Caucasians.32 This difference is not well understood, but inherent biological differences and higher doses of immunosuppressive drugs are possible explanatory factors for discrepancies in patient and graft survival.
Further research is needed to investigate potential explanations for the inferior outcomes observed in African Americans after transplantation and guide center-level interventions aimed at reducing these disparities. Specifically, research focused on identifying and comparing high-disparity versus low-disparity regions or institutions and evaluating for factors that allow for more equitable care. Understanding the impact of race on the patient-physician interaction would provide valuable insight into the disparities observed in treatment and referral practices for African Americans. Increasing ethnic concordance at the patient-physician level could ameliorate the influence of implicit bias on treatment and referral practices. Moving forward, research should move from database studies to institutionalized studies that would allow for a more granular look at patient and center-level disparities. In addition, replication of kidney transplant data would further elucidate reasons behind these disparities. Timely and equitable access to the liver transplantation regardless of ethnicity should prioritized. This can be achieved by investing resources in the growth of smaller transplant centers that treat underserved populations and focusing on patient outreach via telemedicine. Achieving racial equity in liver transplant outcomes is contingent upon the completion of further research, particularly with regards to the impact of socioeconomic status, center-level characteristics, disease severity, comorbidity, referral rates and access to liver transplant, variations in disease burdens, and genetic differences. With underlying mechanisms leading to disparity identified, steps can be designed and implemented to move toward the critical goal of racial equity in survival after liver transplant.
This study has many limitations. Firstly, this study used a large national database registry, which is subject to errors and variability; however, given the large size and period of the collected data, small amounts of missing or incorrect data are unlikely to bias analysis in a significant manner. Additionally, it is even less likely that errors in the data and diagnosis coding were systematically different across racial groups. Secondly, this study includes data from the pre-MELD score era, which may bias analysis by including listing characteristics and outcomes from a previous era in liver transplantation. Since the registry used in this study only records variables at time of listing, time of transplant, and scheduled follow-ups until death, specific data related to clinical events such as rejections, infections, and complications may be unreliable. Finally, other variables such as income, marital status, social support, which may relate to access to transplant are not accounted for in the current study.
6 |. CONCLUSION
Our study demonstrates the significant and consistent disparity in survival for African Americans after OLT. While African Americans have seen substantial decreases in mortality in the past decade, a similar decrease in mortality for other races leaves a significant difference in survival for African Americans. This study highlights the need for future research, policies, and patient-centered care to be aimed at reducing this disparity in the future.
Supplementary Material
ACKNOWLEDGEMENTS
This material is based on work supported by a Cancer Prevention & Research Institute of Texas RP150587 grant. This work is also supported by the National Cancer Institute’s (NCI) U01 CA230997 and R01 CA256977 grants.
Funding information
Cancer Prevention & Research Institute of Texas, Grant/Award Number: RP150587; National Cancer Institute’s, Grant/Award Numbers: U01 CA230997, R01 CA256977
Footnotes
CONFLICT OF INTEREST
None.
SUPPORTING INFORMATION
Additional supporting information may be found in the online version of the article at the publisher’s website.
DATA AVAILABILITY STATEMENT
The data that support the findings of this study are available in the Scientific Registry of Transplant Recipients (SRTR) database, which canbe requested from SRTR at www.srtr.org.
REFERENCES
- 1.Lodhi SA, Lamb KE, Meier-Kriesche HU. Solid organ allograft survival improvement in the United States: the long-term does not mirror the dramatic short-term success. Am J Transplant. 2011;11(6):1226–1235. 10.1111/j.1600-6143.2011.03539.x [DOI] [PubMed] [Google Scholar]
- 2.Germani G, Theocharidou E, Adam R, et al. Liver transplantation for acute liver failure in Europe: outcomes over 20 years from the ELTR database. J Hepatol. 2012;57(2):288–296. 10.1016/j.jhep.2012.03.017 [DOI] [PubMed] [Google Scholar]
- 3.Zarrinpar A, Busuttil RW. Liver transplantation: past, present and future. Nat Rev Gastroenterol Hepatol. 2013;10(7):434–440. 10.1038/nrgastro.2013.88 [DOI] [PubMed] [Google Scholar]
- 4.Ross-Driscoll K, Kramer M, Lynch R, Plantinga L, Wedd J, Patzer R. Variation in racial disparities in liver transplant outcomes across transplant centers in the United States. Liver Transplant. 2021;27(4):558–567. 10.1002/lt.25918 [DOI] [PMC free article] [PubMed] [Google Scholar]
- 5.Hong JC, Kosari K, Benjamin E, et al. Does race influence outcomes after primary liver transplantation? A 23-year experience with 2,700 patients. J Am Coll Surg. 2008;206(5):1009–1016. 10.1016/j.jamcollsurg.2007.12.019 [DOI] [PubMed] [Google Scholar]
- 6.Ananthakrishnan AN, Saeian K. Racial differences in liver transplantation outcomes in the MELD era. Am J Gastroenterol. 2008;103(4):901–910. 10.1111/j.1572-0241.2008.01809.x [DOI] [PubMed] [Google Scholar]
- 7.Adler JT, Yeh H. Social determinants in liver transplantation. Clin Liver Dis. 2016;7(1):15–17. 10.1002/cld.525 [DOI] [PMC free article] [PubMed] [Google Scholar]
- 8.Quillin RC, Wilson GC, Wima K, et al. Independent effect of black recipient race on short-term outcomes after liver transplantation. Surg (United States). 2015;157(4):774–784. 10.1016/j.surg.2014.10.018 [DOI] [PubMed] [Google Scholar]
- 9.Kaswala DH, Zhang J, Liu A, et al. A Comprehensive Analysis of Liver Transplantation Outcomes among Ethnic Minorities in the United States. J Clin Gastroenterol. 2020;54(3):263–270. 10.1097/MCG.0000000000001236 [DOI] [PubMed] [Google Scholar]
- 10.Wong RJ, Ahmed A. Combination of racial/ethnic and etiology/diseasespecific factors is associated with lower survival following liver transplantation in African Americans: an analysis from UNOS/OPTN database. Clin Transplant. 2014;28(7):755–761. 10.1111/ctr.12374 [DOI] [PubMed] [Google Scholar]
- 11.Neff GW, Kemmer N, Kaiser T, Zacharias V, Majoras N, Safdar K. Outcomes in adult and pediatric liver transplantation among various ethnic groups. Transplant Proc. 2007;39(10):3204–3206. 10.1016/j.transproceed.2007.09.031 [DOI] [PubMed] [Google Scholar]
- 12.Mathur AK, Sonnenday CJ, Merion RM. Race and ethnicity in access to and outcomes of liver transplantation: a critical literature review. Am J Transplant. 2009;9(12):2662–2668. 10.1111/j.1600-6143.2009.02857.x [DOI] [PMC free article] [PubMed] [Google Scholar]
- 13.Nguyen GC, Thuluvath PJ. Racial disparity in liver disease: biological, cultural, or socioeconomic factors. Hepatology. 2008;47(3):1058–1066. 10.1002/hep.22223 [DOI] [PubMed] [Google Scholar]
- 14.Taber DJ, Gebregziabher M, Srinivas T, Egede LE, Baliga PK. Transplant center variability in disparities for African-American kidney transplant recipients. Ann Transplant. 2018;23:119–128. 10.12659/AOT.907226 [DOI] [PMC free article] [PubMed] [Google Scholar]
- 15.Moseley KL, Kershaw DB. African American and white disparities in pediatric kidney transplantation in the United States – unfortunate or unjust? Camb Q Healthc Ethics. 2012;21(3):353–365. 10.1017/S0963180112000072 [DOI] [PubMed] [Google Scholar]
- 16.Anand A, Malik TH, Dunson J, et al. Factors associated with long-term graft survival in pediatric kidney transplant recipients. Pediatr Transplant. 2021;25(4):e13999. 10.1111/petr.13999 [DOI] [PubMed] [Google Scholar]
- 17.Lucas FL, Stukel TA, Morris AM, Siewers AE, Birkmeyer JD. Race and surgical mortality in the United States. Ann Surg. 2006;243(2):281–286. 10.1097/01.sla.0000197560.92456.32 [DOI] [PMC free article] [PubMed] [Google Scholar]
- 18.Blustein J Who is accountable for racial equity in health care? JAMA J Am Med Assoc. 2008;299(7):814–816. 10.1001/jama.299.7.814 [DOI] [PubMed] [Google Scholar]
- 19.Wey A, Salkowski N, Kasiske BL, et al. Comparing Scientific Registry of Transplant Recipients posttransplant program-specific outcome ratings at listing with subsequent recipient outcomes after transplant. Am J Transplant. 2019;19(2):391–398. 10.1111/ajt.15038 [DOI] [PMC free article] [PubMed] [Google Scholar]
- 20.Axelrod DA, Guidinger MK, McCullough KP, Leichtman AB, Punch JD, Merion RM. Association of center volume with outcome after liver and kidney transplantation. Am J Transplant. 2004;4(6):920–927. 10.1111/j.1600-6143.2004.00462.x [DOI] [PubMed] [Google Scholar]
- 21.Julapalli VR, Kramer JR, El-Serag HB. Evaluation for liver transplantation: adherence to AASLD referral guidelines in a large Veterans Affairs center. Liver Transplant. 2005;11(11):1370–1378. 10.1002/lt.20434 [DOI] [PubMed] [Google Scholar]
- 22.Eckhoff DE, McGuire BM, Young CJ, et al. Race: a critical factor in organ donation, patient referral and selection, and orthotopic liver transplantation? Liver Transplant Surg. 1998;4(6):499–505. 10.1002/lt.500040606 [DOI] [PubMed] [Google Scholar]
- 23.Kemmer N Ethnic disparities in liver transplantation. Gastroenterol Hepatol. 2011;7(5):302–307. Accessed February 11, 2022. /pmc/articles/PMC3127035/. [PMC free article] [PubMed] [Google Scholar]
- 24.Reid AE, Resnic M, Chang YC, Buerstatte N, Weissman JS. Disparity in use of orthotopic liver transplantation among blacks and whites. Liver Transplant. 2004;10(7):834–841. 10.1002/lt.20174 [DOI] [PubMed] [Google Scholar]
- 25.Kanwal F, Hernaez R, Liu Y, et al. Factors associated with access to and receipt of liver transplantation in Veterans with end-stage liver disease. JAMA Intern Med. 2021;181(7):949–959. 10.1001/jamainternmed.2021.2051 [DOI] [PMC free article] [PubMed] [Google Scholar]
- 26.Bryce CL, Angus DC, Arnold RM, et al. Sociodemographic differences in early access to liver transplantation services. Am J Transplant. 2009;9(9):2092–2101. 10.1111/j.1600-6143.2009.02737.x [DOI] [PMC free article] [PubMed] [Google Scholar]
- 27.Warren C, Carpenter AM, Neal D, Andreoni K, Sarosi G, Zarrinpar A. Racial disparity in liver transplantation listing. J Am Coll Surg. 2021;232(4):526–534. 10.1016/j.jamcollsurg.2020.12.021 [DOI] [PMC free article] [PubMed] [Google Scholar]
- 28.Moylan CA, Brady CW, Johnson JL, Smith AD, Tuttle-Newhall JE, Muir AJ. Disparities in liver transplantation before and after introduction of the MELD score. JAMA - J Am Med Assoc. 2008;300(20):2371–2378. 10.1001/jama.2008.720 [DOI] [PMC free article] [PubMed] [Google Scholar]
- 29.Brau N, Bini EJ, Currie S, et al. Black patients with chronic hepatitis C have a lower sustained viral response rate than non-Blacks with genotype 1, but the same with genotypes 2/3, and this is not explained by more frequent dose reductions of interferon and ribavirin*. J Viral Hepat. 2006;13(4):242–249. 10.1111/j.1365-2893.2005.00682.x. [DOI] [PubMed] [Google Scholar]
- 30.Conjeevaram HS, Fried MW, Jeffers LJ, et al. Peginterferon and ribavirin treatment in African American and Caucasian American patients with hepatitis C genotype 1. Gastroenterology. 2006;131(2):470–477. 10.1053/j.gastro.2006.06.008 [DOI] [PubMed] [Google Scholar]
- 31.Wong RJ, Corley DA. Survival differences by race/ethnicity and treatment for localized hepatocellular carcinoma within the united states. Dig Dis Sci. 2009;54(9):2031–2039. 10.1007/s10620-008-0661-8 [DOI] [PMC free article] [PubMed] [Google Scholar]
- 32.Alvarado M, Schaubel DE, Reddy KR, Bittermann T. Black race is associated with higher rates of early-onset end-stage renal disease and increased mortality following liver transplantation. Liver Transplant. 2021;27(8):1154–1164. 10.1002/lt.26054 [DOI] [PMC free article] [PubMed] [Google Scholar]
Associated Data
This section collects any data citations, data availability statements, or supplementary materials included in this article.
Supplementary Materials
Data Availability Statement
The data that support the findings of this study are available in the Scientific Registry of Transplant Recipients (SRTR) database, which canbe requested from SRTR at www.srtr.org.