

Abstract
The ambient air pollution by particulate matter (PM) has strong negative effects on human health. Recent studies have found correlations between pollution and mortality due to Covid-19. We present here an analysis of such correlation for 32 locations in 6 countries of the Western Europe (France, Germany, Italy, Netherlands, Spain, United Kingdom), for the 2020–2022 period. The data are weekly averaged, and the mortality values were normalized considering the population of the locations. A correlation is qualitatively found for the time-series of PM2.5 pollution and Covid-19 mortality. The higher mortality values occurred during the pollutions peaks, as presented for the city of Paris (France) and the Lombardy regions (Italia), one of the more polluted locations in Western Europe. An almost linear trend with a factor 5.5 ± 1.0 increase in mortality when the pollution increases to ~45 μg.m−3 is found when considering all data. This leads to an increase of 10.5 ± 2.5 % of mortality per 1 μg.m−3. More precisely, the trend depends on the period of the analysis and decreases with time (first spread of the pandemic in Spring 2020, mid-2020 – mid 2021 period where the pandemic was better managed, and vaccinal race after mid-2021). Finally, although the initial conditions could differ from one country to another, the relative trend of increase was similar for the countries here considered. Such results can have some implication on the management of the Covid-19 pandemic and other cardiopulmonary diseases during PM pollution events. They also show the importance of reducing the PM pollution in the major cities.
Keywords: Aerosols pollution covid-19 mortality
Graphical abstract

1. Introduction
Air pollution has a large range of negative impacts on human health (WHO (World Health Organization), 2016; Schraufnagel et al., 2019; Beelen et al., 2014), including respiratory and pulmonary infection, increased cardiovascular risks (Miller, 2020; Robertson and Miller, 2018) and perturbations of the immune system (Glencross et al., 2020) after long-term exposure. The impacts are also demonstrated in short-term acute effects (Horne et al., 2018; Seaton et al., 1995).
Evidences of links between air pollution and viral infection were already established for the 1918 Spanish Influenza Pandemic (Clay et al., 2018) and for the 2002 SARS epidemy in south-east Asia (Cui et al., 2003). Also, ambient air pollution may play an indirect role in the diffusion of some virus carried by airborne particles (Cao et al., 2014; Yu et al., 2004) and thus accelerate population exposure to the virus.
Different sources of transmission dynamics of Covid-19 (SARS-COV-2) may be considered, as local meteorology, air pollution, population density, medical conditions. Recent studies have shown a correlation between particulate matter (PM2.5 or PM10) pollution levels and known Covid-19 symptoms and mortality during the first phases of the pandemic (Rohrer et al., 2020; Accarino et al., 2021; Coccia, 2020a; Conticini et al., 2020; Frontera et al., 2020; Fronza et al., 2020; Gurta et al., 2021; Sidell et al., 2022; Bourdrel et al., 2021). These symptoms are respiratory, cardiovascular and related to the immune system, formulating the hypothesis that air pollution can be a facilitating factor for Covid-19 infection and morbidity (Bourdrel et al., 2021; Mehmood et al., 2020; Zoran et al., 2020; Gupta et al., 2021). In particular, Wu et al. (2020) have shown that PM2.5 increase of 1 μg.m−3 can lead to at least 11 % of increase in Covid-19 mortality in the United States; similar values were found in England (Travaglio et al., 2021), in the Netherlands (Cole et al., 2020), and in a meta-analysis on 35 observational studies (Zang et al., 2022). Correlatively, the Covid-19 number of cases was found to be lower during high speed winds, which dissipated the PM pollution (Coccia, 2020b). Conversely, the absence of correlation between the Covid-19 outbreaks and temperature or UV radiation (Yao et al., 2020) lead to the conclusion that air pollution likely plays a much larger role than some weather condition parameters.
A review on the correlations between Covid-19 epidemic and air pollution or meteorology was given by Srivastava (2021), based on the analysis performed during the first phase of the pandemic. The authors concluded that as far as local meteorology is concerned, temperature and humidity are negatively correlated with the number of cases. On the other hand, PM pollution generally increases when temperature decreases, mainly linked to the winter heating, thus making difficult to decorrelate the various parameters.
So far, few studies have investigated the link between particulate matter (PM) and Covid-19 mortality at the European level (Annesi-Maesano et al., 2022). To extend these previous findings in a representative way, we analyzed the relation between PM2.5 pollution and Covid-19 mortality for 32 different geographical areas in Western Europe between 2020 and 2022. Fine particulate matter of a diameter of <2.5 μm, PM2.5 causes a major impact on human health as it can permeate deeper inside the body (e.g. Chen et al., 2016). This is why we considered PM2.5, for which the World Health Organization has recommended in September 2021 a mean yearly value of <5 μg.m−3 and a daily value <15 μg.m−3. The chosen areas are representative of the various levels of air pollution that can be encountered, both due to the local and transported PM sources as well as to weather heterogeneity (PM pollution increases during anticyclonic conditions and low boundary layers, e. g. Renard et al., 2020).
We first present the case of Paris (France), a high-density populated city of 2.2 million inhabitants (20,640 inhabitants per km2) on a compact area of 105 km2 as well as one of the most polluted cities in Western Europe (Renard and Marchand, 2021) due to the predominance of diesel vehicles and the vicinity of large intensive agriculture areas; then we extend our analysis to the 31 other selected regions.
2. Materials and methods
2.1. Data origins
We considered a large set of data coming from different populated locations in Western Europe presenting low to high levels of air pollution. To distinguish between these levels, we propose a PM2.5 threshold at the 20 μg.m−3. This threshold is based on the new World Health Organization recommendations for daily exposition of PM2.5 below 15 μg.m−3 in ambient air, on which we have added the measurements uncertainty of 5 μg.m−3.
Locations with similar low PM levels, such as for the south of Italy, are not considered here since they will not add a significant statistical value. Thus, we have focused on 32 locations (Table 1 , the name of the regions is given in their original language), which are representative of the various levels of pollution that can be encountered in Western Europe. These levels are dependent on the sources, on the wind conditions, and on the geographical conditions. Our aim is not to discuss the origin of these pollution levels, but to consider them as a possible input parameter for the Covid-19 mortality. According to the national administrative division, these locations can be regions, departments or cities. The population given in Table 1 are needed for the normalization process of the Covid-19 mortality data conducted in part Section 2.2.
Table 1.
Name of the regions, departments and cities considered for the study (DE: Germany; ES: Spain; FR: France; GB: Great Britain; IT: Italy; NL: Netherlands), and population, source of PM pollution data and level of pollution peaks.
| Location (country) | Population (106 inhabitants) | Source of PM2.5 data | Level of pollution peaks |
|---|---|---|---|
| Baden-Württemberg (DE) | 11.1 | Air quality network | Low |
| Berlin (DE) | 4.4 | Air quality network | Low |
| Brandenburg (DE) | 2.4 | Air quality network | Low |
| Hamburg (DE) | 1.9 | Air quality network | Low |
| Hessen (DE) | 6.3 | Air quality network | Low |
| Nordrhein-Westfalen (DE) | 17.9 | Air quality network | Low |
| Schleswig-Holstein (DE) | 2.9 | Air quality network | Low |
| Comunidad de Madrid (ES) | 6.6 | Pollutrack | High |
| Bas Rhin (FR) | 1.1 | Air quality network | Low |
| Bouche du Rhone (FR) | 2.0 | Pollutrack | Low |
| Gironde (FR) | 1.6 | Air quality network | High |
| Haute Garonne (FR) | 1.4 | Air quality network | Low |
| Nord (FR) | 2.6 | Pollutrack | High |
| Paris (FR) | 2.2 | Pollutrack | High |
| Rhone (FR) | 1.9 | Air quality network | High |
| Seine Saint-Denis (FR) | 1.7 | Air quality network | High |
| London (GB) | 14.4 | Air quality network | Low |
| North East (GB) | 2.7 | Air quality network | Low |
| North West(GB) | 7.3 | Air quality network | Low |
| South West (GB) | 5.6 | Air quality network | Low |
| West Midlands (GB) | 2.9 | Air quality network | Low |
| Yorkshire and the Humber (GB) | 5.5 | Air quality network | Low |
| Emilia-Romagna (IT) | 4.5 | Air quality network | High |
| Friuli Venezia Giulia (IT) | 1.2 | Air quality network | High |
| Lazio (IT) | 5.9 | Air quality network | High |
| Lombardia (IT) | 10.1 | Air quality network | High |
| Piemonte (IT) | 4.4 | Air quality network | High |
| Toscana (IT) | 3.7 | Air quality network | High |
| Gelderland (NL) | 2.1 | Air quality network | Low |
| Noord-Brabant (NL) | 2.5 | Air quality network | Low |
| Noord-Holland (NL) | 2.8 | Air quality network | Low |
| Zuid-Holland (NL) | 3.7 | Pollutrack | High |
The PM pollution data are available all over Europe, from each national air quality monitoring networks. The measuring stations provide reference data for the PM10 (particles smaller than 10 μm) and sometimes for the PM2.5 (particles smaller than 2.5 μm). Because of their initial and operational cost, only few stations are available per cities or regions.
Usually, daily PM2.5 mass-concentrations pollution data can be accessed through various websites, associated with fixed monitoring stations dedicated to air quality monitoring. However, PM2.5 data can be obtained also using other methods. For example, the Pollutrack networks conduct measurements in several cities of Europe using mobile light optical aerosol counters operated on the roof tops of hundreds of electric vehicles, which provide a better spatial coverage of the cities (Renard and Marchand, 2021).
For the purpose of the present paper, we have averaged all the PM2.5 daily measurements available in a given region. Although such measurements provide a mean estimate of PM2.5 pollution, they could not represent the spatial heterogeneity of PM2.5 content. For example, there are only 5 PM2.5 measurement stations available inside the Paris city (France), two of them being in the beltway that circles Paris. Thus, when possible, we prefer to consider the measurements obtained since 2020 with the Pollutrack mobile PM2.5 sensors. As an example, the daily PM2.5 mass-concentrations in Paris obtained by the air quality network managed by Airparif (data available at https://www.airparif.asso.fr/) and those obtained by Pollutrack network are presented in Fig. 1 for the 2020–2022 period. The mean difference between the two set of data is of 2.0 μg.m−3 (Pollutrack being slightly above Airparif, a logical outcome since measurements are performed directly in traffic lanes) with a standard deviation of 5.3 μg.m−3. Given all air pollution measurement technologies experience uncertainties of several μm (Allen et al., 1997), these results show very good alignment between Pollutrack and Airparif data. The Pollutrack measurements are always above the Airparif air quality network measurements during pollution peaks, which could indicate a better ability to detect them when considering their spatial heterogeneity. The variability of PM2.5 sources and low number of fixed stations for the air quality networks could induce several μg.m−3 of uncertainties. Considering the standard deviation calculated above, it seems reasonable to assume a total error of 5 μg.m−3 for all mass-concentrations measurements.
Fig. 1.
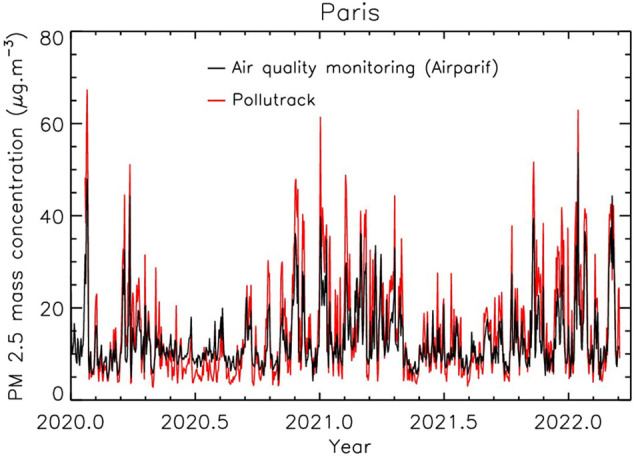
Comparison between Airparif air quality network data and Pollutrack daily data for the 2020–2022 period in the city of Paris (France).
Data on the mortality due to the Covid-19 pandemic could be found at the national health agencies, and some others from independent organizations (herein we use data from the John Hopkins University). The principal problem with Covid-19 data relates to the consistency and speed at which they are collected and reported. Offsets of several days could occur depending on the efficiency and continuity of the data reporting from the local authorities, which can bias the statistics when compared to other data. In particular, the Spanish data are highly variable from one day to another even during the higher part of the crisis and thus only the Madrid region data can be used for the present work.
2.2. Data analysis procedures
To limit the scatter of the daily PM pollution values and of Covid-19 mortality values, all the daily data are averaged over one week; thus, we mainly focus on mid and long-lasting pollution episodes.
To be able to search for a relation between PM pollution and Covid-19 mortality trends for the various regions and countries, it is necessary to normalize the Covid-19 data; thus, the mortality values were divided by the population of the region (Table 1). The Covid-19 regional data are established for the whole population, including larger and smaller cities that can locally encounter different levels of PM pollution and viral transmission due the variability of the population density. As a consequence, the weekly mean values could differ from one region to another even if the pollution levels are similar. It is then necessary to consider a large number of data coming from different regions having different mean levels of pollution and Covid-19 mortality to search for the correlation between these two parameters.
Two analyses are conducted. The first one compares the weekly time evolution of PM2.5 pollution and Covid-19 mortality per millions. The second analysis consists of considering all weekly PM2.5 mass-concentrations and Covid-19 mortality and to tentatively derive an average evolution between them. These analyses must consider the various lockdowns imposed in 2020 across several countries to limit the spread of the Covid-19, thus reducing the intensity of the PM sources and the strength of pollution events (e. g. Chauhan and Singh, 2020: Petit et al., 2021). This fact could partly bias the analysis of the correlation between Covid-19 mortality and pollution events, although the main trigger of the pollution variability is the wind conditions (e. g Renard et al., 2020).
3. Results
3.1. Time-evolutions between 2020 and 2022: the case of Paris (France)
North Italy (Piedmont Lombardy, Emilia-Romagna) encountered the highest pollution levels of Western Europe during the 2020–2022 period, with weekly maximum PM2.5 values close to 50 μg.m−3 in the 2020–2021 winter associated with a high Covid-19 mortality (Conticini et al., 2020). Another highly polluted location in Western Europe was the city of Paris (France), also associated with a high Covid-19 mortality.
Paris is a compact city, which allows us to perform a more accurate analysis than using values coming from a region with different locations having different population densities. Herein we use the mean of the Pollutrack PM2.5 values obtained inside Paris with a good spatial resolution. We use also the values of the Covid-19 mortality available for the city only.
Fig. 2 illustrates the time-evolution of the PM2.5 pollution and the number of deaths per million. Globally the mortality trend follows the PM pollution trend. Three periods can be established. The first one is between the sudden beginning of the pandemic in March 2020 and mid-2020; a significant pollution event occurred as the epidemic strongly progressed. The second period covers the mid-2020 to mid-2021 range, when better therapeutic strategies were adopted. Several significant pollution events occurred during the 2020–2021 winter. The last period begins at mid-2021, which corresponds to the vaccination race; also, several pollution events occurred in the 2021–2022 winter. The mean level of mortality decreases from one period to the following one; nevertheless, the same trend is observed, as the mortality is always higher during pollution events than outside them.
Fig. 2.
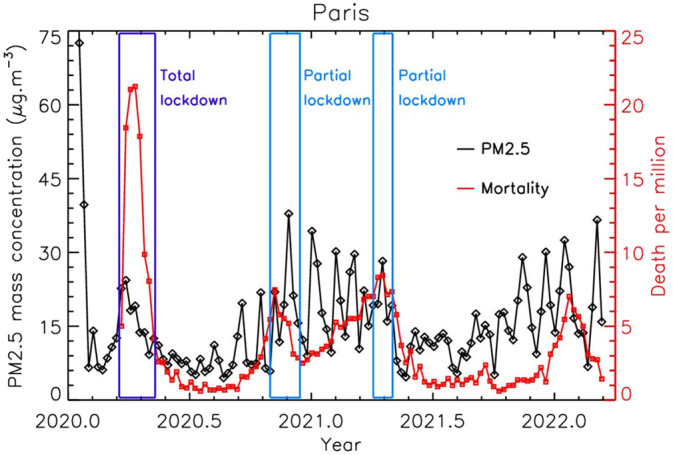
Time-evolution of the PM2.5 pollution and of the mortality for the 2020–2022 period in Paris (France); the PM2.5 error is of about ±2.5 μg.m−3.
The first lockdown in spring 2020 was almost total, with the cessation of all but essential activities, which has reduced the PM2.5 pollution (Petit et al., 2021). Thus, the decrease in Covid-19 mortality could be due to the direct effect of the lockdown but also to the induced pollution decrease. The analysis can be conducted more easily during the second period. Increases and peaks of mortality occurred during each of the pollution peaks above 20 μg.m−3. Two partial lockdowns occurred during this period, where the activities were more or less reduced. The first one could explain the sudden decrease of mortality at the end of 2020. After, the mortality starts again to increase during each pollution event. A strong decrease of the mortality occurred in May 2021, just after the second partial lockdown that occurred in April 2021, but it seems more correlated to the sudden decrease of the pollution level. Finally, the mortality starts again to increase at the end of 2021 during the second pollution events of that period.
The PM2.5 pollution is globally higher in winter than in summer, mainly because of the combination of heating and traffic; also the Covid-19 mortality is also higher in winter. Nevertheless, no significant correlation has been found between the short-time variations in temperature and the short-time evolution of the Covid-19 mortality.
3.2. The case-differences for the various locations in Western Europe
As for the case of Paris, in Piedmont, Lombardy and Emilia Romagna in the 3 considered periods the increases and the decreases of Covid-19 mortality were correlated to the pollution level trends in the mid-2020 mid-2021 period (Fig. 3 ). Similar correlations were obtained for all the regions classified with high pollution levels in Table 1, with increases of mortality during the main winter PM2.5 pollution events.
Fig. 3.
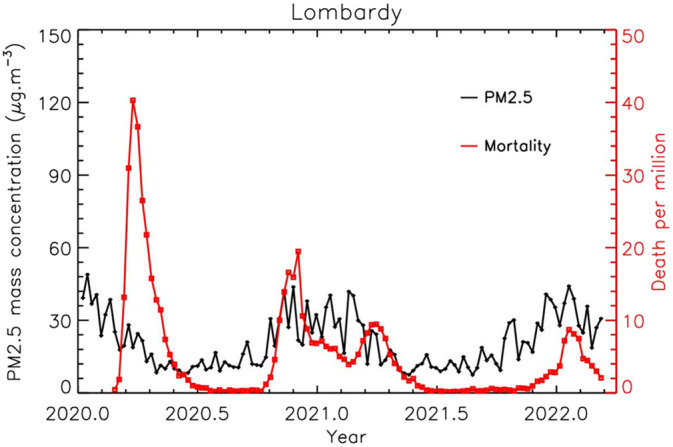
Time-evolution of the PM2.5 pollution and of the mortality for the 2020–2022 period in Lombardy (Italy); the PM2.5 error is of about ±2.5 μg.m−3.
Many of the Western European regions have low or moderate PM pollution events due to their geographical locations, their mean weather conditions, and their pollution regulatory law. Among them, the North Rhine-Westphalia region (Germany) is one of the best examples, with a mean pollution trend that remains almost constant over the year and always below 20 μg.m−3 (Fig. 4 ) despite large cities and many industrial activities. The Covid-19 mortality per millions inhabitant remains low compared to Paris and Lombardy. The same conclusion is obtained for all the regions classified with low pollution levels in Table 1.
Fig. 4.
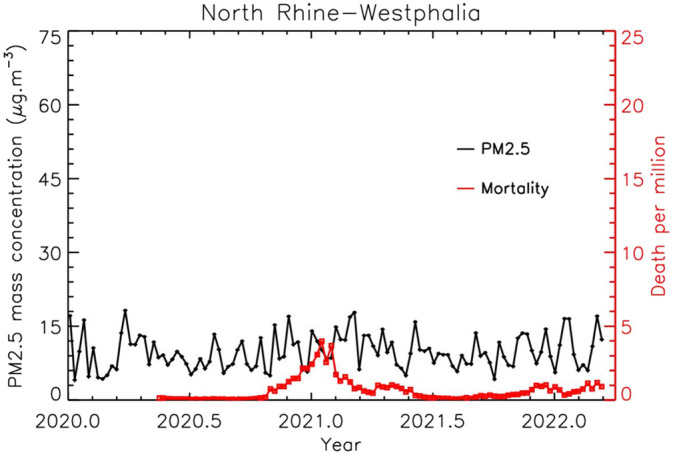
Time-evolution of the PM2.5 pollution and of the mortality for the 2020–2022 period in North Rhine - Westphalia (Nordrhein-Westfalen, Germany); the PM2.5 error is of about ±2.5 μg.m−3.
3.3. Evolution of COVID-19 mortality with PM2.5 pollution
The same trends are qualitatively detected for all regions: the higher the PM pollution, the higher the Covid-19 mortality per million inhabitants. Because of the mass-concentrations measurements uncertainties, the possible time-delay in Covid-19 data reporting, and the natural delay between the pollution peaks and their consequence on human health, we can expect scattered data when plotting the PM2.5 pollution level vs. Covid-19 death per million inhabitant (Fig. 5a). To tentatively surface trends and to partly compensate for the various sources of errors, the raw data are averaged within steps of 5 to 10 μg.m−3 to ensure a statistic rigor (depending on the number of data available in a given mass-concentration range). The error bars are calculated by considering the standard error of the mean.
Fig. 5.

Evolution of the PM2.5 pollution vs. of the Covid-19 mortality considering all the data together (a) and the data for 3 different periods (b, c, d); individual data and mean values are presented.
The raw data inside each bin of PM2.5 mass concentrations follows a log-normal distribution. Instead of averaging them, we can consider the highest value of the mode that corresponds to the most frequent mortality number. In this case, the resulting value is of about 30 ± 15 % lower than the average value, but all the trends are maintained. Since similar conclusions can be derived from these two methods, we will consider in the following the results coming from the averaging method. The Pearson correlation coefficient is not the best way to determine the correlation between pollution and mortality, since the mortality seems to have a cumulative effect with a timescale different from that of pollution. It is why we prefer to consider the mean of the mortality values or the values of highest probability
Fig. 5a illustrates the correlation between the pollution and Covid-19 mortality. To better evaluate the trends, it is necessary to separate the data in respect with the 3 temporal periods presented above, which are related to the health management of the pandemic. Despite the more or less severe lockdowns conducted in the various countries, the mortality increases when PM pollution also increases (Fig. 5b). During the second period, on which the higher values of pollution were encountered, the increase is significantly lower (Fig. 5c), but remains continuous for increasing pollution. Finally, due to the vaccination program, the effect of the pollution is lowered in the third period, although mortality continues to demonstrate increases with increasing pollution.
Fig. 5 also shows that the dispersion of the individual measurements strongly decreases for PM 2.5 mass-concentrations above about 20 μg.m−3. This value was chosen to be the threshold between low pollution and high pollution cities in Table 1.
Tests have been conducted by shifting the raw time-series of mortality values compared to the time-series of the pollution values, by a step of one week from −5 months to +5 months. The data is then averaged in the same mass-concentration intervals as above. The highest amplitude from the first mean mortality value (low pollution) to the last mean mortality value (high pollution) is obtained for no data shift. Positively or negatively increasing the shift reduces the amplitude and almost a flat trend is obtained for a shift of the order of 3 months (that roughly corresponds to the duration of the winter pollution event). This result seems to indicate that the correlation is not fortuitous, and that the incidence of the pollution on the Covid-19 mortality seems to be below one week.
The mean values curves are divided by their first value to make direct comparison between them (Fig. 6 ). An almost linear trend with a factor 5.5 ± 1.0 increase in mortality when the pollution increases to ~45 μg.m−3 is found when considering all data. This leads to an increase of 10.5 ± 2.5 % of mortality per 1 μg.m−3 increase, in good agreement with the Wu et al. (2020) value for the US. In fact, the trend varies depending on the stage of the pandemic evolution. During the first phase (rapid spread), the mortality increase was of 20 ± 5.0 % per 1 μg.m−3 increase. It was also of 10.5 ± 2.0 % per 1 μg.m−3 increase during the 2020.5–2021.5 period, and drops to 4.5 ± 1.5 % per 1 μg.m−3 increase in line with the rapid vaccine rollout.
Fig. 6.
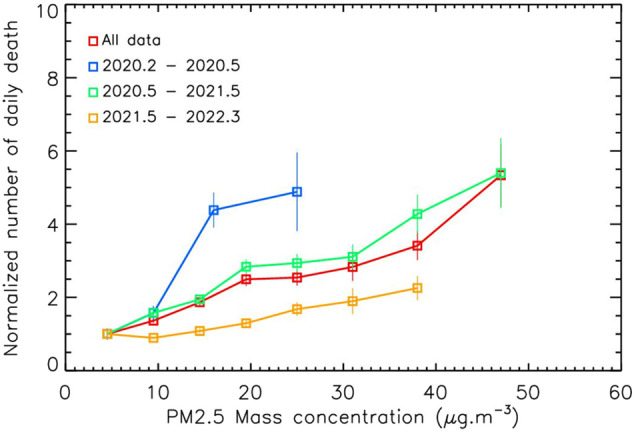
Evolution the Covid-19 mortality vs. the PM2.5 pollution divided by the first value of each curve, for all data and for the 3 periods; the PM2.5 error is of about ±2.5 μg.m−3.
We have considered above the data from all the countries studied. The mean value can be calculated with an acceptable accuracy if at least 10 individual data are available in the considered mass-concentration interval. Since the local authorities have managed the health crisis differently, we can expect different evolution of mortalities vs. PM2.5 pollution for the different countries. Fig. 7a shows that indeed the first mortality value for low PM mass-concentrations (<5 μg.m−3) differs from one country to another, the highest being for England and the lowest being for the Netherlands. To determine the trend of the relative evolution of mortality with the PM pollution, and thus to decorrelate the effect due to the pollution to other effects, all the curves are divided by their first value. The variability in the initial conditions can be interpreted as the various medical conditions of the population and the local management of the pandemic. All the curves are almost superimposed (Fig. 7b), indicating that whatever the initial conditions are, the consequence of the PM pollution on Covid-19 mortality increase is globally similar for all the Western Europe countries.
Fig. 7.

Evolution the Covid-19 mortality vs. the PM2.5 pollution divided by the first value of each curve, for all data and for the 3 periods; the PM2.5 error is of about ± 2.5 μg.m−3.
The same analysis is conducted for the two categories of regions presented in Table 1 (“low” pollution regions and “high” pollution regions). After averaging the individual data, similar trends in the 0–25 μg.m−3 range are found for the two categories, which could indicate that the relation between PM pollution and Covid-19 mortality do not depend on the locations.
4. Discussion
Our results confirm previous works on the link between PM pollution and Covid-19 Mortality (e.g. Coccia, 2020a) and the absence of direct links with weather parameters (Yao et al., 2020). The mean percentage of the Covid-19 mortality increases in Western Europe, of the order of 10 % per μg.m−3, in agreement with the Wu et al. (2020) value for the US. Nevertheless, our analysis shows that this value decreases with the medical and societal improved management of the pandemic, although the PM2.5 pollution effect still remain after the vaccination program. The example of Paris has shown that each peak of pollution higher than about 20 μg.m−3 that lasts more than one week are followed by a local increase of Covid-19 mortality. This PM2.5 threshold is very close to the new World Health Organization recommendations for daily exposition of PM2.5 below 15 μg.m−3 in ambient air.
To interpret our results, we propose that the inhalation of PM2.5 constitutes an irritant factor for all the airways, favoring the penetration of all airborne viruses and bacteria (WHO (World Health Organization), 2016). The systemic circulation of particles in the blood stream constitutes an additional irritant factor for the vascular walls that explains the relationship between particulate pollution and cardiovascular pathologies (in particular pulmonary embolism), both in the short term and in the long term. Thus, PM2.5 particulate pollution can explain a greater sensitivity of people to airborne viruses, but also a greater severity of these pathologies, the mortality of which is primarily pulmonary, by disseminated pulmonary micro embolisms.
During the Covid-19 pandemic, air pollution by fine and ultra-fine particulate matter increases permeability in the airway by reducing tight junctions proteins, which facilitates the virus penetration (Bourdrel et al., 2021). Also, cardiopulmonary and metabolic diseases are well-known comorbidities of Covid-19. These facts can explain the Covid-19 mortality increase during strong pollution events and the time-delay of the order of few days only.
Finally, the principal mode by which people are infected with the Covid-19 is through airborne transmission not only indoors but likely also outdoors. Indeed, Kayalar et al. (2021) supports the hypothesis that Covid-19 may be transported by ambient particles. However, further data are needed to confirm these analyses.
Our study can help to better manage the Covid-19 threat by control measures (Coccia, 2021), for example by establishing factors that can describe the pandemic propagation (Coccia, 2022) and predict its evolution during the following winters. Also, it is necessary to decrease the PM pollution in the major cities by political decisions on the reduction of the wood burning and the traffic. Finally, strong reductions of industrial activities and transport may be proposed during the period of high PM2.5 pollution to limit the Covid-19 mortality (and the other cardiopulmonary diseases).
5. Conclusion
This study shows that the PM2.5 pollution could induce an increase in Covid-19 mortality in Western Europe. This increase depends on the period of the pandemic and on the medical and societal managements. Further investigations in other countries and continents are required to determine whether these results are specific to Western Europe or can be generalized worldwide to locations that have encountered high pollution events. Analysis as the one conducted for Paris should be conducted for other compact and populated cities, to confirm that sudden increases of Covid-19 mortality could be associated with weekly pollution events above 20 μg.m−3. Also, all the medical processes on how PM inhalation increases the Covid-19 lethality must be established, as already done for others virus and pandemics.
This study has confirmed that the PM2.5 pollution is of major importance for human health. Although the direct health effect of the pollution has been well established, it shows that PM2.5 have also a strong indirect effect on the Covid-19 mortality through inhalation and irritating factors. This effect seems to be local and is dependent on the pollution management by local (and national) authorities. In consequence, the PM pollution must be considered as an important factor in the Covid-19 progression and may be included in the societal management of the pandemic.
Credit authorship contribution statement
Jean-Baptiste Renard: Methodology, data analysis, interpretation.
Jeremy Surcin: Data retrievals.
Isabella Annesi-Maesano: Interpretation, proofreading.
Gilles Delaunay: Bibliography.
Eric Poincelet: Methodology, proofreading.
Gilles Dixsaut: Analysis, proofreading.
Declaration of competing interest
The authors declare that they have no known competing financial interests or personal relationships that could have appeared to influence the work reported in this paper.
Acknowledgements
The authors thank the Pollutrack team for the deployment of hundreds of mobile PM sensors in Paris then across Europe, the ENEDIS and DPD groups for offering their fleets of electric vehicles and financing the sensors, and Scott Stonham for his most efficient proofreading.
Editor: Pavlos Kassomenos, Director
References
- Accarino G., Lorenzetti S., Aloisio G. Assessing correlations between short-term exposure to atmospheric pollutants and COVID-19 spread in all Italian territorial areas. Environ. Pollut. 2021;268(A) doi: 10.1016/j.envpol.2020.115714. [DOI] [PMC free article] [PubMed] [Google Scholar]
- Allen G., Sioutas C., Koutrakis P., Reiss R., Lurmann F.W., Roberts P.T. Evaluation of the TEOM method for measurements of ambient particulate mass in urban areas. J. Air Waste Manage. Assoc. 1997;47:682–689. doi: 10.1080/10473289.1997.10463923. [DOI] [PubMed] [Google Scholar]
- Annesi-Maesano I., Maesano C.N., Dessimond B., Prud'homme J., Colette A., Banerjee S. Has the Spring 2020 lockdown modified the relationship between air pollution and COVID-19 mortality in Europe? Allergy. 2022 doi: 10.1111/all.15267. [DOI] [PMC free article] [PubMed] [Google Scholar]
- Beelen R., Raaschou-Nielsen O., Stafoggia M., et al. Effects of long-term exposure to air pollution on natural-cause mortality: an analysis of 22 European cohorts within the multicentre ESCAPE project. Lancet. 2014;383(9919):785–795. doi: 10.1016/S0140-6736(13)62158-3. [DOI] [PubMed] [Google Scholar]
- Bourdrel T., Annesi-Maesano I., Alahmad B., Maesano C.N., Bind M.-D. The impact of outdoor air pollution on COVID-19: a review of evidence from in vitro, animal, and human studies. Eur. Respir. Rev. 2021;30 doi: 10.1183/16000617.0242-2020. [DOI] [PMC free article] [PubMed] [Google Scholar]
- Cao C., et al. Inhalable Microorganisms in Beijing’s PM2.5 and PM10 Pollutants during a Severe Smog Event. Environ. Sci. Techno. 2014;48(3):1499–1507. doi: 10.1021/es4048472. [DOI] [PMC free article] [PubMed] [Google Scholar]
- Chauhan A., Singh R.P. Decline in PM2.5 concentrations over major cities around the world associated with COVID-19. Environ. Res. 2020;187 doi: 10.1016/j.envres.2020.109634. [DOI] [PMC free article] [PubMed] [Google Scholar]
- Chen R., Hu B., Liu Y., Xu J., Yang G., Xu D., Chen C. Beyond PM2.5: the role of ultrafine particles on adverse health effects of air pollution. Biochim. Biophys. Acta - Gen. Subj. 2016;1860(12):2844–2855. doi: 10.1016/j.bbagen.2016.03.019. [DOI] [PubMed] [Google Scholar]
- Clay K., Lewis J., Severnini E. Pollution, infectious disease and mortality: evidence from the 1918 Spanish influenza pandemic. J. Econ. Hist. 2018;76(4):1179–1209. [Google Scholar]
- Coccia M. Factors determining the diffusion of COVID-19 and suggested strategy to prevent future accelerated viral infectivity similar to COVID. Sci. Total Environ. 2020;729 doi: 10.1016/j.scitotenv.2020.138474. [DOI] [PMC free article] [PubMed] [Google Scholar]
- Coccia M. How (Un)sustainable environments are related to the diffusion of COVID-19: the relation between coronavirus disease 2019, air pollutionWind Resource and Energy. Sustainability. 2020;2020(12):9709. [Google Scholar]
- Coccia M. The impact of first and second wave of the COVID-19 pandemic: comparative analysis to support control measures to cope with negative effects of future infectious diseases in society. Environ. Res. 2021;197 doi: 10.1016/j.envres.2021.111099. [DOI] [PMC free article] [PubMed] [Google Scholar]
- Coccia M. Preparedness of countries to face COVID-19 pandemic crisis: strategic positioning and factors supporting effective strategies of prevention of pandemic threats. Environ. Res. 2022;203 doi: 10.1016/j.envres.2021.111678. [DOI] [PMC free article] [PubMed] [Google Scholar]
- Cole M., Ozgen C., Strobl E. Air pollution exposure and Covid-19. Environ. Res. Econ. 2020;76:581–610. doi: 10.1007/s10640-020-00491-4. [DOI] [PMC free article] [PubMed] [Google Scholar]
- Conticini E., Frediani B., Caro D. Can atmospheric pollution be considered a co-factor in extremely high level of SARS-CoV-2 lethality in Northern Italy? Environ. Pol. 2020;261 doi: 10.1016/j.envpol.2020.114465. [DOI] [PMC free article] [PubMed] [Google Scholar]
- Cui Y., Zhang Z.-F., Froines J., Zhao J., Wang H., Yu S.-Z., Detels R. Air pollution and case fatality of SARS in the people's republic of China: an ecologic study. Environ. Health. 2003;2:15. doi: 10.1186/1476-069X-2-15. [DOI] [PMC free article] [PubMed] [Google Scholar]
- Frontera A., Cianfanelli L., Vlachos K., Landoni G., Cremona G. Severe air pollution links to higher mortality in COVID-19 patients: the “double-hit” hypothesis. J. Infect. 2020;81(2):255–259. doi: 10.1016/j.jinf.2020.05.031. [DOI] [PMC free article] [PubMed] [Google Scholar]
- Fronza R., Lusic M., Schmidt M., Lucic B. Spatial-temporal variations in atmospheric factors contribute to SARS-CoV-2 outbreak. Viruses. 2020;12:588. doi: 10.3390/v12060588. [DOI] [PMC free article] [PubMed] [Google Scholar]
- Glencross D.A., Ho T.-R., Camiña N., Hawrylowicz C.M., Pfeffer P.E. Air pollution and its effects on the immune system. Free Rad. Biol. Med. 2020;151:56–68. doi: 10.1016/j.freeradbiomed.2020.01.179. [DOI] [PubMed] [Google Scholar]
- Gupta A., Bherwani H., Gautam S., Anjum S., Musugu K., Kumar N., Anshul A., Kumar R. Air pollution aggravating COVID-19 lethality? Exploration in Asian cities using statistical models. Environ. Dev. Sustain. 2021;23:6408–6417. doi: 10.1007/s10668-020-00878-9. [DOI] [PMC free article] [PubMed] [Google Scholar]
- Horne B.D., Joy E.A., Hofmann M.G., Gesteland P.H., Cannon J.B., Lefler J.S., Blagev D.P., Korgenski E.K., Torosyan N., Hansen G.I., Kartchner D., Pope C.A., III Short-term elevation of fine particulate matter air pollution and acute lower respiratory infection. Am. J. Respir. Crit. Care Med. 2018;198(6):759–766. doi: 10.1164/rccm.201709-1883OC. [DOI] [PubMed] [Google Scholar]
- Kayalar Ö., Arı A., Babuççu G., Konyalılar N., Doğan Ö., Can F., Şahin Ü.A., Gaga E.O., Levent Kuzu S., Arı P.E., Odabaşı M., Taşdemir Y., Sıddık Cindoruk S., Esen F., Sakın E., Çalışkan B., Tecer L.H., Fıçıcı M., Altın A., Onat B., Ayvaz C., Uzun B., Saral A., Döğeroğlu T., Malkoç S., Üzmez Ö.Ö., Kunt F., Aydın S., Kara M., Yaman B., Doğan G., Olgun B., Dokumacı E.N., Güllü G., Uzunpınar E.S., Bayram H. Existence of SARS-CoV-2 RNA on ambient particulate matter samples: a nationwide study in Turkey. Sci. Total Environ. 2021;789 doi: 10.1016/j.scitotenv.2021.147976. [DOI] [PMC free article] [PubMed] [Google Scholar]
- Mehmood K., Saifullah Lqbal M., Abzar M.M. Can exposure to PM2.5 particles increase the incidence of coronavirus disease 2019? Sci. Total Environ. 2020;741:140441. doi: 10.1016/j.scitotenv.2020.140441. [DOI] [PMC free article] [PubMed] [Google Scholar]
- Miller M.R. Oxidative stress and the cardiovascular effects of air pollution. Free Radic. Biol. Med. 2020;151:69–87. doi: 10.1016/j.freeradbiomed.2020.01.004. [DOI] [PMC free article] [PubMed] [Google Scholar]
- Petit J.-E., Dupont J.-C., Favez O., Gros V., Zhang Y., Sciare J., Simon L., Truong F., Bonnaire N., Amodeo T., Vautard R., Haeffelin M. Response of atmospheric composition to COVID-19 lockdown measures during spring in the Paris region (France) Atmos. Chem. Phys. 2021;21:17167–17183. [Google Scholar]
- Renard J.-B., Marchand C. High resolution mapping of PM2.5 concentrations in Paris (France) using mobile pollutrack sensors network in 2020. Atmosphere. 2021;12:529. [Google Scholar]
- Renard J.-B., Michoud V., Giacomoni J. Vertical profiles of pollution particle concentrations in the boundary layer above Paris (France) from the optical aerosol counter LOAC onboard a touristic balloon. Sensors. 2020;20:1111. doi: 10.3390/s20041111. [DOI] [PMC free article] [PubMed] [Google Scholar]
- Robertson S., Miller M.R. Ambient air pollution and thrombosis. Part. Fib. Toxicol. 2018;15:1. doi: 10.1186/s12989-017-0237-x. [DOI] [PMC free article] [PubMed] [Google Scholar]
- Rohrer M., Flahault A., Stoffel M. Peaks of fine particulate matter may modulate the spreading and virulence of COVID-19. Earth Syst. Environ. 2020;4:789–796. doi: 10.1007/s41748-020-00184-4. [DOI] [PMC free article] [PubMed] [Google Scholar]
- Schraufnagel D.E., Balmes J.R., Cowl C.T., De Matteis S., Jung S.-H., Mortimer K., Perez-Padilla R., Rice M.D., Riojas-Rodriguez H., Sood A., Thurston G.D., To T., Vanker A., Wuebbles D.J. Air pollution and noncommunicable diseases a review by the Forum of International Respiratory Societies’ Environmental Committee, part 1: the damaging effects of air pollution. Chest. 2019;155(2):409–416. doi: 10.1016/j.chest.2018.10.042. [DOI] [PMC free article] [PubMed] [Google Scholar]
- Seaton A., Godden D., MacNee W., Donaldson K. Particulate air pollution and acute health effects. Lancet. 1995;345(8943):176–178. doi: 10.1016/s0140-6736(95)90173-6. [DOI] [PubMed] [Google Scholar]
- Sidell M.A., Chen Z., Huang B.Z., Chow T., Eckel S.P., Martinez M.P., Lurmann F., Thomas D.C., Gilliland F.D., Xiang A.H. Ambient air pollution and COVID-19 incidence during four 2020–2021 case surges. Environ. Res. 2022;208 doi: 10.1016/j.envres.2022.112758. [DOI] [PMC free article] [PubMed] [Google Scholar]
- Srivastava A. COVID-19 and air pollution and meteorology-an intricate relationship: a review. Chemosphere. 2021;263 doi: 10.1016/j.chemosphere.2020.128297. [DOI] [PMC free article] [PubMed] [Google Scholar]
- Travaglio M., Yu Y., Popovic R., Selley L., Leal N.S., Martins L.M. Links between air pollution and COVID-19 in England. Environ. Pollut. 2021;268 doi: 10.1016/j.envpol.2020.115859. [DOI] [PMC free article] [PubMed] [Google Scholar]
- WHO (World Health Organization) WHO Library Cataloguing-in-Publication Data; 2016. Ambient Air Pollution: A Global Assessment of Exposure and Burden of Disease, Report. [Google Scholar]
- Wu X., Nethery R.C., Sabath B.M., Braun D., Dominici F. Exposure to air pollution and COVID-19 mortality in the United States. Sci. Adv. 2020;6(45) doi: 10.1126/sciadv.abd4049. [DOI] [PMC free article] [PubMed] [Google Scholar]
- Yao Y., Pan J., Liu Z., Meng X., Wang W., Kan H., Wang W. No association of COVID-19 transmission with temperature or UV radiation in Chinese cities. Eur. Respir. J. 2020;55:2000517. doi: 10.1183/13993003.00517-2020. [DOI] [PMC free article] [PubMed] [Google Scholar]
- Yu I.T.S., Li Y., Wong T.W., Tam W., Chan A.T., Lee J.H.W., Leung D.Y.C., Ho T. Evidence of airborne transmission of the severe acute respiratory syndrome virus. New Engl. J. Med. 2004;350:1731–1739. doi: 10.1056/NEJMoa032867. [DOI] [PubMed] [Google Scholar]
- Zang S.-T., Jie Luan J., Li L., Yu H.-X., Chang Q., Zhao Y.-H., Wu Q_.J. Ambient air pollution and COVID-19 risk: Evidence from 35 observational studies. Environ. Res. 2022;204(B) doi: 10.1016/j.envres.2021.112065. [DOI] [PMC free article] [PubMed] [Google Scholar]
- Zoran M.A., Savastru R.S., Savastru D.M., Tautan M.N. Assessing the relationship between surface levels of PM2.5 and PM10 particulate matter impact on COVID-19 in Milan, Italy. Sci. Total Envir. 2020;738 doi: 10.1016/j.scitotenv.2020.139825. [DOI] [PMC free article] [PubMed] [Google Scholar]