

Abstract
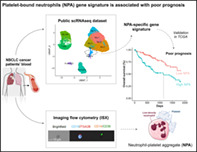
Beyond their critical role in hemostasis, platelets physically interact with neutrophils to form neutrophil‐platelet aggregates (NPAs), enhancing neutrophil effector functions during inflammation. NPAs may also promote disease worsening in various inflammatory diseases. However, characterization of NPAs in cancer remains totally unexplored. Using ImageStreamX (ISX) imaging flow cytometer, we were not only allowed able to detect CD15+ CD14− CD36+ ITGA2B+ NPAs in both healthy donors' (HDs) and cancer patients' bloods, but we also showed that NPAs result from the binding of platelets preferentially to low‐density neutrophils (LDNs) as opposed to normal‐density neutrophils (NDNs). By reanalyzing two independent public scRNAseq data of whole blood leukocytes from cancer patients and HDs, we could identify a subset of neutrophils with high platelet gene expression that may correspond to NPAs. Moreover, we showed that cancer patients' derived NPAs possessed a distinct molecular signature compared to the other neutrophil subsets, independently of platelet genes. Gene ontology (GO) term enrichment analysis of this NPAs‐associated neutrophil transcriptomic signature revealed a significant enrichment of neutrophil degranulation, chemotaxis and trans‐endothelial migration GO terms. Lastly, using The Cancer Genome Atlas (TCGA), we could show by multivariate Cox analysis that the NPAs‐associated neutrophil transcriptomic signature was associated with a worse patient prognosis in several cancer types. These results suggest that neutrophils from NPAs are systemically primed by platelets empowering them with cancer progression capacities once at tumor site. NPAs may therefore hold clinical utility as novel noninvasive blood prognostic biomarker in cancer patients with solid tumors.
Keywords: cancer, low‐density‐neutrophils, neutrophil‐platelet aggregates, neutrophils, platelets
What's new?
Platelets interact with peripheral blood neutrophils to form neutrophil‐platelet aggregates (NPAs), which enhance inflammatory processes in various diseases. The role of NPAs in cancer—a hallmark of which is inflammation—however, remains unexplored. Here, the authors combined flow cytometry and analyses of transcriptomic data of human circulating neutrophils to detect NPAs and investigate NPA formation. NPAs derived from cancer patients were found to possess a distinct molecular signature. Moreover, in different cancers, the NPA‐associated neutrophil transcriptomic signature was associated with worse prognosis. The findings suggest that NPAs could serve as non‐invasive markers to assess prognosis in patients with solid tumors.
Abbreviations
- ANC
absolute neutrophil count
- CPM
count per million
- GO
gene ontology
- HDs
healthy donors
- HNC
head and neck cancer
- HR
hazard ratio
- ISX
ImageStreamX
- LDNs
low‐density neutrophils
- LIHC
hepatocellular carcinoma cancer patients
- LUAD
lung adenocarcinoma
- LUSC
lung squamous cell carcinoma
- NDNs
normal‐density neutrophils
- NETs
neutrophil extracellular traps
- NLR
neutrophils‐to‐lymphocytes ratio
- NPAs
neutrophil‐platelet aggregates
- NSCLC
nonsmall‐cell lung cancer
- OS
overall survival
- PAAD
pancreatic adenocarcinoma cancer patients
- PCA
principal component analysis
- PCs
principal components
- PFI
progression‐free interval
- RBC
red blood cells
- RT
room temperature
- scRNAseq
single cell RNA sequencing
- ssGSEA
single sample Gene Set Enrichment Analysis
- TANs
tumor‐associated neutrophils
- TCGA
The Cancer Genome Atlas
- UMAP
uniform manifold approximation and projection
- UPS
undifferentiated pleomorphic sarcoma
1. BACKGROUND
Although, some recent evidences suggested that tumor‐associated neutrophils (TANs) could display antitumor properties, 1 , 2 , 3 a large body of evidence demonstrated that TANs could be protumoral and promote metastasis. 4 , 5 , 6 Protumor TANs can assist metastasis by blunting antitumor T‐cell responses, 4 and stimulating proliferation and invasiveness of metastatic tumor cells. 5 , 6 Accumulating evidence in mice and humans showed that blood neutrophils may also contribute to cancer progression. Numerous retrospective analysis across multiple different cancer types showed that an elevation in the absolute count of circulating neutrophils together with a decrease in the absolute count of circulating lymphocytes, both accounting for a high neutrophils‐to‐lymphocytes ratio (NLR) on blood, was associated with a worse prognosis in patients. 7 , 8 , 9 , 10 More recently, studies have shown that a subset of circulating neutrophils, named low‐density neutrophils (LDN) expanded in cancer patient's blood and was associated with worse prognosis, especially in nonsmall‐cell lung cancer (NSCLC) and head and neck cancer (HNC). 11 , 12 Moreover, LDN was found to display features of protumor neutrophils, such as increased T‐cell suppressive functions, as opposed to normal‐density neutrophils (NDN). 11 , 13 Nevertheless, LDN remains a heterogeneous population of cells including mature and immature neutrophils. 13 , 14 A subset of circulating LDN expressing the LOX‐1 scavenger receptor was reported to display higher T‐cell suppressive functions as compared to LOX‐1− LDN. 13 LOX‐1+ T‐cell suppressive neutrophils were recently reported to infiltrate lung tumors and were associated with a worse patient survival. 15 Besides studies in humans, recent evidence in mice demonstrated that the preprogramming of neutrophils in the periphery was required for acquisition of their tumor‐promoting functions once at tumor site 16 , 17 supporting the idea that tumor‐promoting TANs derived from a distinct subset of neutrophils preexisting in the periphery.
Beyond their critical role in hemostasis, platelets can bind to circulating leukocytes forming leukocyte‐platelet aggregates, enhancing their effector functions. For instance, platelets have been recently shown to interact with peripheral blood monocytes to activate antigen cross‐presentation. 18 In sepsis, in contrast to free neutrophils, NPAs (neutrophil‐platelet aggregates) produce higher amount of neutrophil extracellular traps (NETs) 19 , 20 , 21 and display increased phagocytic functions. 22 , 23 , 24 Furthermore, NPAs display enhanced trans‐endothelial migration capacity 25 , 26 therefore promoting neutrophil infiltration to site of injury and fueling pathological inflammation in various diseases. 21 , 27 , 28 , 29 However, to our knowledge, the characterization of NPAs in cancer patients remains unexplored.
In our study, we showed that neutrophils from NPAs represent a unique subset of activated neutrophils in cancer patients by combining ImageStreamX (ISX) imaging flow cytometry and analysis of public single cell transcriptomic data of human circulating neutrophils. In particular, we showed that LDN as opposed to NDN were preferentially involved in NPA formation. Finally, we could generate a specific gene signature of neutrophils in NPAs that we found associated with a worse prognosis in pancreatic adenocarcinoma patients and liver hepatocellular carcinoma patients.
2. MATERIALS AND METHODS
2.1. Human cohorts
Whole blood from a cohort of six metastatic NSCLC patients (Table S1) at the Léon Bérard Hospital (France) was collected in EDTA‐coated tubes (BB‐0033‐00050, CRB Centre Léon Bérard, Lyon, France). As an age and sex‐matched control cohort, whole blood from healthy donors (HD) was collected via the Etablissement Français du Sang (Table S1).
2.2. Preparation of whole blood, NDNs and LDNs‐enriched fractions for multispectral imaging flow cytometry (ImageStreamX, ISX)
Blood from NSCLC patients or HD was withdrawn in EDTA‐coated vacutainers 1 hour prior to the processing. Two tubes of 3 mL of blood were centrifuged at 120g (no brake) for 15 minutes at room temperature (RT) to separate platelet‐rich plasma from leukocyte‐enriched red pellet. Platelet‐rich plasma was discarded for both tubes. One out of the two tubes was used for whole blood staining while the other served for the separation of LDNs from NDNs. For such separation, leukocyte‐enriched red pellet was resuspended in 6 mL of PBS1X (5 mM EDTA) and then layered on the top of 3 mL of Ficoll (CMSMSL01‐01, EUROBIO), before being centrifuged at 600g for 20 minutes at RT (acceleration 5 and brake 1). LDNs‐enriched PBMC ring and NDNs‐enriched red pellet were washed with PBS1X, and pellets were resuspended in BD Pharm Lyse (555899) according to manufacturer's protocol to eliminate red blood cells. In parallel, whole blood leukocyte‐enriched red pellet was also resuspended in BD Pharm Lyse for the same purpose. After incubation, red blood cells (RBC)‐lysed leukocytes were washed twice with PBS1X (5 mM EDTA) were resuspended at a final concentration of 20.106 cells/ml prior to be stained. Samples were acquired on ImageStreamX (ISX) no more than 5 days following cell staining and fixation.
Two million cells per sample were stained for 30 minutes in the dark at 4°C in 100 μL staining buffer (PBS1X, 2% SVF, 5 mM EDTA) with antibodies directed against CD15 (561 584, Clone HI98), CD14 (562 335, MφP9), CD41a (559 777, HIP8) (all from BD), and CD36 (130‐110‐739, REA760) and CD62P (130‐105‐714, REA389) from Miltenyi Biotec. Cells were washed twice with PBS1X (5 mM EDTA, 2% fetal bovine serum [FBS]) before being fixed in 2% formaldehyde solution (252 549, Sigma‐Aldrich). After incubation at 4°C, cells were washed twice with PBS1X (5 mM EDTA, 2% FBS) and resuspended in a final volume of 180 μL PBS1X (5 mM EDTA, 2% FBS).
NPAs were imaged with ImageStreamX (ISX) imaging flow cytometer (Amnis Corporation‐Luminex, Seattle, WA) using 405, 488, 561, and 642 lasers and the 40X objective. Brightfield provided morphological and structural details of the cell. At least 300 000 RBC‐lysed blood cells from NSCLC patients or HDs separately, excluding debris and free‐platelet with low area, were collected for each sample. Since flow‐speed could influence the proportion of NPAs, 30 RBC‐lysed blood cells were acquired with a flow‐speed between 500 to 1000 events/second for each sample. Data were analyzed using IDEAS image analysis software (Amnis Corporation, Seattle, WA). A specific gating strategy, with multiple filtering steps was set up to identify noncoincidental viable NPAs (Figure S6). Such strategy aimed first at retaining only focused cells based on Gradient RMS values for each event. Remaining debris and free platelets with low area were discarded. Dead cells positive for Zombie NIR (Biolegend) viability marker were then eliminated. Neutrophils were selected as cells with a high expression of CD15 and a low expression of CD14 markers. Low area event on CD15 object mask were eliminated to exclude CD15+ debris or CD15+ insufficient quality staining for an accurate estimation of true NPAs. Platelet‐related events were then selected by gating on events positive for both ITGA2B and CD36 cell‐surface markers. A second filter was applied to narrow down the selection of platelet‐related events by only considering the ones with high ITGA2B intensity on ITGA2B‐related component with the largest area to remove residual platelet debris. To only retain noncoincidental NPAs, two distinct masks delimiting neutrophil‐related CD15 stained‐area and platelet‐related ITGA2B stained‐area were created. Noncoincidental NPAs were events for which neutrophil and platelet‐associated masks were overlapping with at least one pixel, and confirmed by image examination of random samples. Only the most‐focused platelet‐related events were considered by selecting events with high gradient RMS of ITGA2B marker on platelet area. Frequencies of NPAs were calculated on at least 100 noncoincidental NPAs for each NSCLC patients and HDs.
2.3. May‐Grünwald‐Giemsa staining
A blood smear from a drop of NSCLC patients' whole blood was performed on a glass slide. Blood smear was dried up for 10/15 minutes at RT. May‐Grünwald staining was layered on dried blood smear using Hema‐Tek Stain Pak Kits designed for the Bayer Hema‐Tek 2000 Slide Stainer. Pumps deliver fresh reagents (Stain, Buffer and Rinse solution) in precise volume. Slide was then taken out and completely dried at RT before being covered glasses and liquid mounting media using Tissue‐Tek Coverslipping Film. Slides are immediately available for being digitized on Pannoramic scan II slide scanner by 3DHistech (x40, Z Stack, Multilayer Mode 5*0,2um) and being visualized using case viewer software.
2.4. Bioinformatic analysis of public scRNAseq data of human whole blood leukocytes
2.4.1. ScRNAseq data of NSCLC patients' whole blood leukocytes (GSE127465)
ScRNAseq data of six NSCLC patients' whole blood leukocytes were downloaded from GEO as normalized count per million (CPM) gene expression matrix. Briefly, preprocessing of scRNAseq data performed by the authors 31 including the removal of: (i) dead cells identified by a mitochondrial gene content >20% among total gene transcribed; (ii) cells with poor quality transcriptome, as being cells with less than 300 counts; (iii) doublet cells performed with Scrublet. 32 We next performed analysis of CPM gene expression matrix from six NSCLC patients' whole blood leukocytes by using Seurat R package (version 3.1.1). We first removed genes that were not expressed in at least three cells and filtered‐out cells with less than 200 different transcribed‐genes (Seurat default parameters). Matrix was log‐transformed and scaled prior to principal component analysis (PCA) with ScaleData Seurat function. PCA was performed on the 2000 most‐variable genes, using RunPCA function. We used JackStraw function to determine the statistical significance of PCA scores that led us to retain the first nine principal components (PCs). We next define the number of clusters by using FindNeighbors and FindClusters functions that take into account the first nine PCAs and a resolution of 0.66, leading to 11 clusters. We ran the uniform manifold approximation and projection (UMAP) dimensional reduction technique, using RunUMAP function, and then display 2D UMAP projections. We used the authors major cell type annotations 31 based on the validated leukocyte gene signature matrix (LM22). 33
2.4.2. ScRNAseq data of healthy donors' whole blood leukocytes (GSE145230)
ScRNAseq data of three human males' and four human females' whole blood leukocytes were downloaded from GEO as normalized count per million (CPM) gene expression matrix. Preprocessing of scRNAseq data was performed identically as described above for GSE127465, except that doublet cells were removed based on UMI number and % of mitochondrial gene expression. 34 We next define the number of clusters by using FindNeighbors and FindClusters functions that take into account the first 19 PCAs and a resolution of 0.6, leading to 22 clusters. Cells were annotated by combining Clustifyr (version 1.0.0) 35 (using reference matrices from Seurat CBMC, Zilionis Blood datasets, 31 and MCP‐counter genes list 36 ) with SingleR (version 1.2.4) 37 annotation tools (Human Primary Cell Atlas used as reference).
2.4.3. Differential gene expression analysis
From Seurat object generated from GSE127465 CPM gene expression matrix, differential gene expression analysis between two distinct clusters was performed using FindAllMarkers function from Seurat R package. Only genes detected in at least 25% of cells and with a positive average log2 fold change of 0.25 were retained, but no cutoff value for the adjusted P‐value was used. Union function from dplyr R package (version 1.0.2) was used to get the union of upregulated genes (Figure 4B; Table S4) from multiple differential gene expression analysis. Setdiff function was used to get the exclusive list of upregulated genes of a given cluster by opposition to another one.
FIGURE 4.
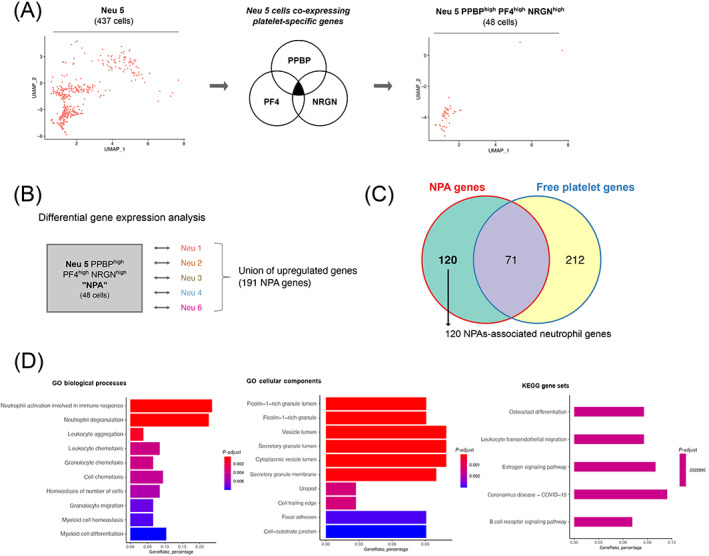
NPA gene signature is enriched for neutrophil degranulation, chemotaxis and trans‐endothelial migration GO terms, as opposed to the other neutrophil subsets. (A) Strategy to make the Neu 5 population more homogeneous (public scRNAseq data from NSCLC patients' whole blood leukocytes—GSE127465). Left panel represents the two dimensional‐UMAP projection plot of cells from Neu 5 cluster (comprising 437 cells), based on the UMAP parameters used to discriminate the major subsets of leukocytes. Middle panel shows the selection of Neu 5 cells based on the coexpressed high level of the three platelet specific genes (PPBP, PF4 and NRGN) above 1 log2 gene expression (CPM). Right panel represents the two dimensional‐UMAP projection plot of Neu 5 cells coexpressing PPBP, PF4 and NRGN genes (comprising 48 cells annotated Neu 5 PPBPhigh PF4high and NRGNhigh). Cells were plotted based on the UMAP parameters used to discriminate the major subsets of leukocytes. (B) Differential gene expression approach to get the union of upregulated genes in Neu 5 PPBPhigh PF4high NRGNhigh (annotated NPA cluster) as opposed to each of the remaining neutrophil clusters (Neu 1, Neu 2, Neu 3, Neu 4 and Neu 6). The statistical test used in the differential gene expression analysis was the Wilcoxon rank‐sum (Mann‐Whitney) test. (C) Venn diagram representing mutually and exclusive upregulated genes between the NPA cluster (union of upregulated genes in NPA cluster compared to each of the remaining neutrophil clusters—see Table S4) and the platelet cluster (Table S3). (D) Top 10 most‐enriched GO biological processes, cellular components and KEGG gene sets calculated based on the 120 specific upregulated genes in NPA compared to platelet cluster (Table S5) [Color figure can be viewed at wileyonlinelibrary.com]
2.4.4. Single sample Gene Set Enrichment Analysis (ssGSEA) on bulk transcriptomic data
SsGSEA from GSVA R package (version 1.32.0) was performed on public microarray data of in vitro stimulated and unstimulated neutrophils (GSE15139 and GSE49757). For both data sets, control probes, and probes with ambiguous gene symbol were removed. For probes matching to identical genes, mean expression value per gene was calculated on probes matching to that gene to retain only one gene expression value per gene. SsGSEA of the Raghavachari platelet signature and the “in house 11 genes” neutrophil signature (Table S2) was performed on each replicate of each group using GSVA R package. All ssGSEA scores were bar‐plotted with ggplot2 R package (version 3.2.1).
2.4.5. Single sample Gene Set Enrichment Analysis (ssGSEA) on scRNAseq data
ssGSEA from R escape package (version 0.99.9) was used for calculating an enrichment score for Raghavachari platelet signature and “in house 11 genes” neutrophils signature (Table S2) of all individual cells. Only cells with at least one count per gene present in Raghavachari or “in house 11 genes” signatures were considered for calculating the enrichment score. Resulting ssGSEA scores obtained for each cluster was plotted using ggviolin function from ggpubr R package (version 0.4.0).
2.4.6. Venn diagrams
Venn diagrams were generated by using the Venn and compute. Venn functions from the Vennerable package (version 3.1.0.9000).
2.4.7. MCP counter on scRNAseq data
Normalized CPM expression matrix for all cells was generated from Seurat object. MCP counter scores (mean expression of all genes for a given signature [in log2 TPM +1]) of our “In house 11 genes” neutrophil signature (Table S2) and the “16_gene_NPA_signature” (Table S6) were calculated for each individual cells using MCPcounter.estimate function from MCPcounter package (version 1.2.0). Comparison of mean MCP score between clusters was performed with the Stat_compare_means function from the ggpubr package (version 0.4.0) choosing nonparametric Wilcoxon rank‐sum (Mann‐Whitney) statistical test. Results were presented through violin plots that were generated with ggplot2 R package (version 3.3.2).
2.5. Survival analysis
TCGA pan‐cancer RSEM normalized log2 transformed gene expression data were downloaded from UCSC Xena Browser and log2 + 1 transformed. Updated clinical data with survival endpoints were retrieved from TCGA‐CDR paper (Cell 2018, https://doi.org/10.1016/j.cell.2018.02.052).
Immune signatures (including the “NPA_12”) were calculated as the mean expression of each individual gene. Patients were then stratified into three groups based on each signature's tercile values.
Survival analysis was performed using the survminer and survival R packages. For each cancer type, survival curves were estimated with Kaplan‐Meier and compared to the log‐rank test. Multivariate analyses considering age and tumor stage as cofounding factors were then performed using a cox model with P‐value correction using the Benjamini‐Hochberg method.
3. RESULTS
3.1. Identification of NPAs in peripheral blood of cancer patients and healthy donors (HDs)
NPAs from NSCLC patients and HDs' whole blood were identified as CD15+ CD14− neutrophils that were double positive for platelet glycoprotein 4 (CD36) and integrin alpha‐IIb (ITGA2B, also known as CD41a) by using ImageStreamX (ISX) imaging flow cytometer (Figure 1A,B). Moreover, we found CD36+ and ITGA2B+ platelets from NPAs also expressed P‐selectin (CD62P) (Figure 1B), known to influence neutrophil‐platelet binding. 30 , 38 We could also easily identify NPAs in unprocessed NSCLC patients' whole blood smear through May‐Grünwald‐Giemsa staining (Figure 1C). Because the frequency of NPAs was shown to be increased in the blood of patients with various pathologies as compared to HDs, 38 , 39 , 40 we next quantified by ISX the frequency of NPAs among neutrophils between NSCLC patients and HDs with the same gating strategy. Although the frequency of NPA between NSCLC patients (mean frequency = 1.48%) and HDs (mean frequency = 1.16%), was roughly the same, with no statistically significant difference (P value = .64), one NSCLC patient displayed more than a 3‐fold increase of NPA proportion (mean frequency = 4.59%) compared to the mean frequency of NPA in NSCLC patients and HDs (Figure 1D). Interestingly, among all six NSCLC patients analyzed, this patient with high percentage of NPAs also displayed by far the highest NLR value (34.56 as opposed to 7.21 for the others), mostly explained by a higher absolute neutrophil count (Table S1), and the highest tumor burden (7 vs 2 metastatic sites in the rest of the cohort) (Table S1).
FIGURE 1.
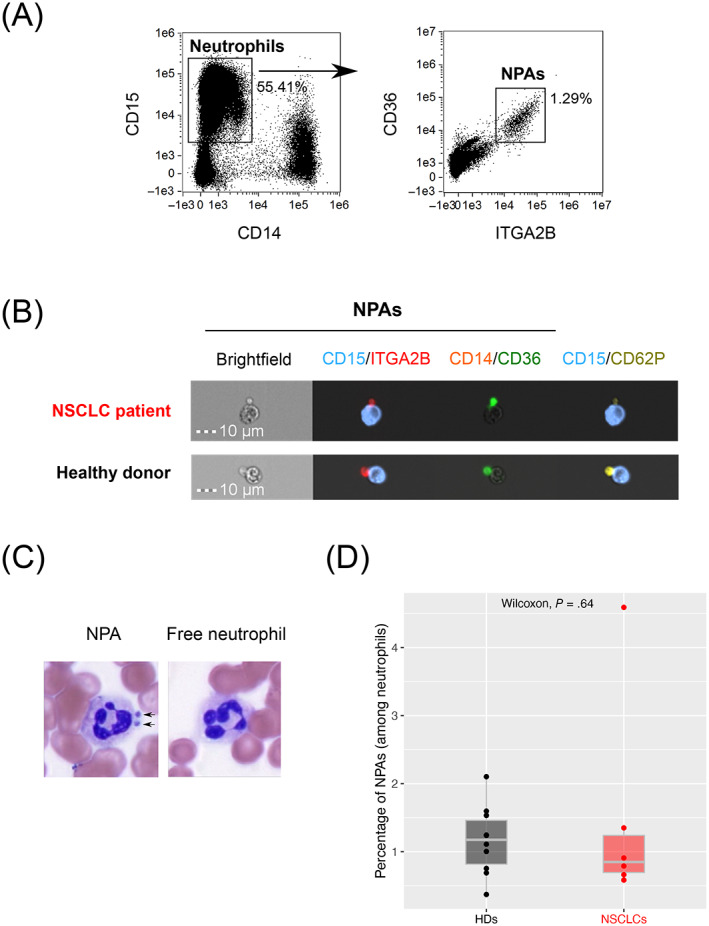
Identification of NPAs in both NSCLC patients and healthy donors' peripheral blood. (A) Gating strategy on ISX to identify CD36+ ITGA2B+ NPAs from CD15+ CD14− neutrophils in NSCLC patients' peripheral whole blood (one representative data of n = 6 NSCLC patients' blood). (B) Visualization of CD15+ CD14− CD36+ ITGA2B+ CD62P+ NPAs by ISX in NSCLC patients and HDs' peripheral blood. Images were taken with X40 objective. CD15: Neutrophil marker; CD14: Monocyte marker; ITGA2B, CD36, CD62P: Platelet markers. (C) May‐Grünwald‐Giemsa coloration on NSCLC patient's whole blood smear. X100 magnification. Dark arrows show the presence of platelets aggregated to neutrophil (NPAs). Neutrophil is evidenced by segmented nucleus in dark purple. Free neutrophil refers to neutrophil free of platelets. (D) Box plot representing the frequency of noncoincidental CD15+ CD14− CD36+ ITGA2B+ NPAs (among all neutrophils) in whole blood of NSCLC patients (n = 6) and HDs (n = 10), determined by ISX. Difference in terms of frequency of NPAs between NSCLC patients and HDs was assessed by the Wilcoxon rank‐sum (Mann‐Whitney) statistical test [Color figure can be viewed at wileyonlinelibrary.com]
3.2. Platelets preferentially bind to low‐density neutrophils (LDNs), rather than normal‐density neutrophils (NDNs) in cancer patients' blood
Given the well‐known detrimental role of LDNs in cancer, 11 , 12 , 13 , 14 , 41 , 42 we next analyzed a potential link between LDNs and NPAs. LDNs are known to be enriched in cancer patients' blood in comparison with HDs. 11 , 14 , 41 , 42 We could confirm such observations as we found a significant increase (P‐value .0062) in the absolute number of LDNs per ml of blood in NSCLC patients as compared to HDs (Figure 2A).
FIGURE 2.
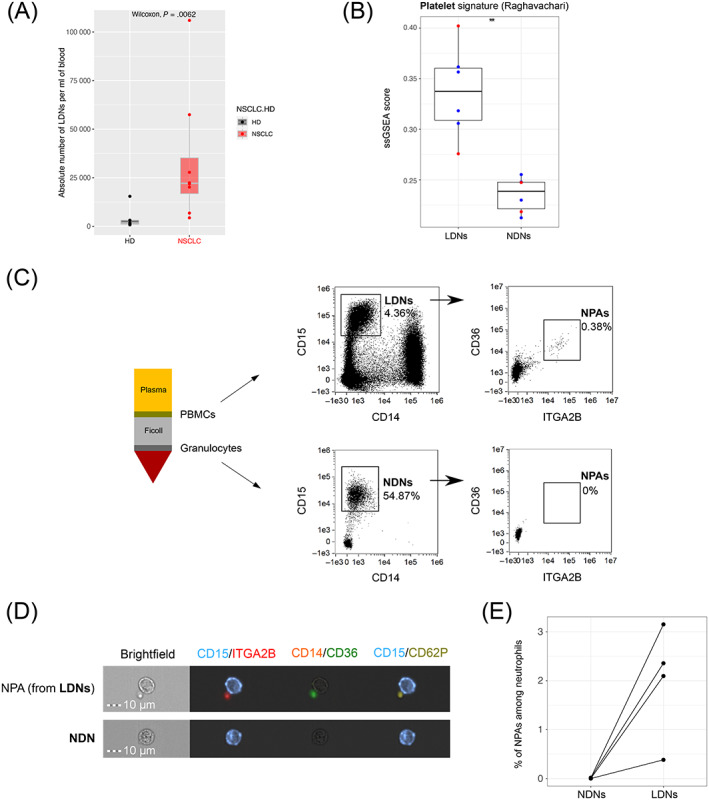
NPAs define a subset of LDNs not present in NDNs. (A) Box plot representing the absolute number of LDNs (among PBMCs) per ml of whole blood in NSCLC patients (n = 8) and HDs (n = 5), determined by flow cytometry. Difference in absolute number of LDNs between NSCLC patients and HDs was assessed by the Wilcoxon rank‐sum (Mann‐Whitney) statistical test. (B) Box plot representing ssGSEA enrichment scores of the Raghavachari platelet signature (Table S2) across LDNs and patients' matched NDNs from four HNC (blue dots) and two NSCLC (red dots) cancer patients (GSE79404). Differential enrichment of platelet signature between LDN and NDN groups was assessed by the Wilcoxon rank‐sum (Mann‐Whitney) statistical test. P‐value was displayed on graphs, **P ≤ .01. (C) Schematic representation of Ficoll density gradient centrifugation of human whole blood showing the separation of the low‐density fraction (containing PBMCs) from the normal‐density fraction (containing mostly granulocytes). Both fractions from NSCLC patients' blood were analyzed by ISX, to identify CD15+ CD14− LDNs (in the low‐density fraction) and CD15+ CD14− NDNs (in the normal‐density fraction). From either LDNs or NDNs gates, all CD36+ ITGA2B+ events were gated as “NPAs.” (D) Visualization by ISX in NSCLC patients of noncoincidental CD36+ ITGA2B+ CD62P+ NPAs from LDN gate in the PBMC fraction and NDN gate in the granulocyte fraction. Images were taken with X40 objective. CD15: Neutrophil marker; CD14: Monocyte marker; ITGA2B, CD36, CD62P: Platelet markers. (E) Dot plot reflecting the frequencies of noncoincidental CD15+ CD14− CD36+ ITGA2B+ NPAs among NDNs and LDNs determined by ISX, across n = 4 NSCLC patients [Color figure can be viewed at wileyonlinelibrary.com]
To first test if NPAs could be a subset of LDNs, we then performed a single sample Gene Set Enrichment Analysis (ssGSEA) on publicly available transcriptomic data of bulk LDNs and bulk NDNs from NSCLC and Head and Neck Cancer (HNC) patients' blood (GSE79404). We showed that the published platelet‐specific gene signature “Raghavachari” 43 (Table S2) was significantly (P‐value = .0022) more enriched in LDNs than in NDNs (Figure 2B).
We next isolated LDNs and NDNs (Figure 2C). Using ISX, we could visualize CD15+ CD14− CD36+ ITGA2B+ CD62P+ NPAs from LDNs but not from NDNs (Figure 2C,D). NPAs represented around 2% of LDNs but were negligible in the NDN population (Figure 2C‐E). Collectively, these results demonstrate that platelets are preferentially bound to LDNs rather than NDNs.
3.3. Identification of NPAs in public scRNAseq datasets from whole blood leukocytes in both cancer patients and HDs
We next aimed at characterizing NPAs from cancer patients at the transcriptomic level. Indeed, given the small size of platelets, we hypothesized that NPAs could be isolated as a single cell (Figure 1B), just like free neutrophil, and therefore be present in scRNAseq data. For this purpose, we took advantage of a recently published scRNAseq dataset of NSCLC patients' whole blood leukocytes (GSE127465). 31 Therefore, for our analysis we used normalized counts tables and kept author's major cell type annotations to identify blood cell populations. We could recluster all leukocytes (Figure 3A) and distinguished six clusters of neutrophils (named Neu 1, Neu 2, Neu 3, Neu 4, Neu 5 and Neu 6 (Figure 3B). Interestingly, we observed that Neu 5 cluster seemed to be distinct from the other neutrophil clusters, through its close proximity with the platelet cluster (Figure 3B). Using our own neutrophil‐specific gene signature “in house 11 genes” (Table S2) generated by intersecting multiple published neutrophil gene signatures, we showed that the bulk of neutrophils had a MCP counter score (mean abundance score = 0.71) significantly greater to platelets, monocytes, B cells/pDC, T cells and NK cells (mean abundance score = 0.15, 0.13, 0.05, 0.05, 0.09, respectively) (Figure 3C), thus validating the specificity of this signature. Moreover, neutrophil‐specific genes (CSF3R, CXCR2 and FCGR3B) were expressed at the highest level in all six clusters of neutrophils, including Neu 5 cluster (Figure 3E). We then evaluated the ssGSEA enrichment score of the published platelet‐specific gene signature “Raghavachari” (Table S2) 33 across all clusters identified. Platelet cluster was by far the most enriched cell type for the platelet‐specific gene signature (mean ssGSEA score = 0.28) as compared to neutrophils, monocytes, B cells/pDC, T cells and NK cells (mean ssGSEA score = −0.32, −0.19, −0.30, 0.31, −0.30, respectively) (Figure 3D), validating the specificity of this signature. Looking at the gene level, PF4, PPBP and NRGN (Table S3) platelet genes were in the five most‐differentially upregulated genes (Table S4) able to discriminate the Neu 5 cluster from the other neutrophils and immune cell clusters (Figure 3F). In conclusion, the Neu 5 cluster of platelet gene‐expressing neutrophils seems to correspond to NPAs.
FIGURE 3.
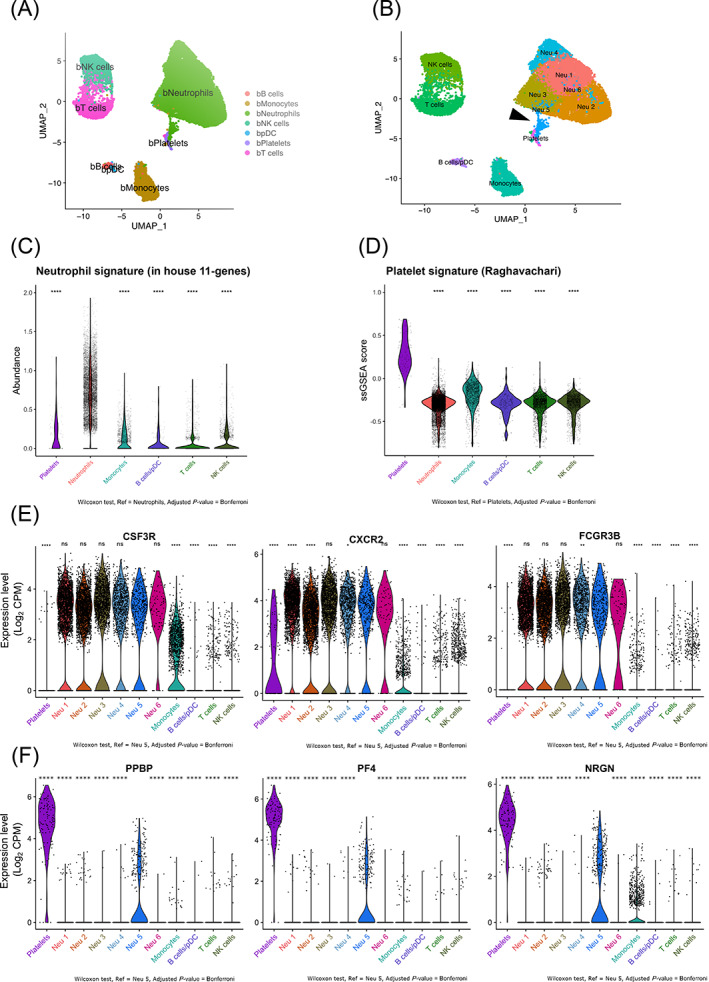
Identification of a cluster of neutrophils expressing platelet genes in public scRNAseq data from NSCLC patients' peripheral blood leukocytes. (A and B) Two dimensional‐UMAP representation of reclustered NSCLC patients' whole blood leukocytes from scRNAseq data (GSE127465). (A) Major immune cell types were labeled using Zilionis et al. annotation. (B) Whole clustering of NSCLC patients' whole blood leukocytes yielding 11 clusters that were labeled based on the type of immune cell. The six clusters of neutrophils were annotated as follow: Neu 1, Neu 2, Neu 3, Neu 4, Neu 5 and Neu 6. Dark arrows show Neu 5 neutrophil cluster of interest displaying high expression of platelet genes (see differential gene expression analysis Table S3). (C) Violin plot representing MCP counter abundance score per cell of the in “house 11 genes” neutrophil signature (Table S2) across all major blood immune cell types. (D) Violin plot representing ssGSEA enrichment score per cell of the Raghavachari platelet signature (Table S2) across all major blood immune cell types. (E) Violin plots representing the log2 gene expression (count per million, CPM) of neutrophil‐specific genes (CXCR2, CSF3R and FCGR3B) (Table S2) across all clusters of blood immune cells. (F) Violin plots representing the log2 gene expression (CPM) of platelet‐specific genes (PF4, PPBP and NRGN) (Table S3) across clusters of blood immune cells. In (C), (E) and (F) P values were calculated with Wilcoxon test, taking Neu 5 cluster as the population of reference for each pairwise comparison with other clusters. In (D) P values were calculated with Wilcoxon test, taking Platelet cluster as the population of reference for each pairwise comparison with other clusters. P values were adjusted with Bonferroni test. Adjusted P‐values (Adj P) were displayed on graphs, ****Adj P ≤ .0001, ***Adj P ≤ .001, ** Adj P ≤ .01, * Adj P ≤ .05, ns = Adj P > .05 [Color figure can be viewed at wileyonlinelibrary.com]
To validate that this Neu 5 cluster of platelet gene‐expressing neutrophils containing NPAs was not exclusive to this particular scRNAseq dataset, we next investigated for the presence of platelet gene‐expressing neutrophils in a public scRNAseq dataset of HDs' whole blood leukocytes (GSE145230). By performing the same analysis as for the NSCLC patients scRNAseq dataset (GSE127465), we were able to identify a cluster of neutrophils (Neu 17) located in between the platelet cluster and the remaining neutrophil clusters (Figure S1A,B). The neutrophil‐specific gene signature “in house 11 genes” (Table S2) was once again proven to be specific to neutrophils (mean abundance score = 0.45) as compared to platelets, monocytes, B cells/pDC, T cells and NK cells (mean abundance score = 0.02, 0.06, 0.01, 0.01, 0.01, respectively) (Figure S1C). The same was true for the platelet‐specific gene signature “Raghavachari” (Table S2) whose mean ssGSEA score (0.65) was significantly greater in platelet cluster than in neutrophils, monocytes, B cells/pDC, T cells and NK cells (mean ssGSEA score = 0.23, 0.38, 0.30, 0.29, 0.35, respectively) (Figure S1D). Consistent with what we previously found in the NSCLC patients' scRNAseq dataset, a fraction of Neu 17 cells was expressing high level of neutrophil (Figure S1E) and platelet‐specific genes (Figure S1F), suggesting that the identification of platelet gene‐expressing neutrophils could be generalized to any humans' whole blood scRNAseq datasets.
In order to rule out that upregulation of platelet genes in neutrophils is not a consequence of neutrophil activation, we next tested whether the enrichment of the platelet‐specific genes signature “Raghavachari” (Table S2) was increased upon neutrophil activation. We used public transcriptomic data of in vitro activated neutrophils by either GM‐CSF 44 or plasma from septic patients 45 and we show that the enrichment score of the platelet signature in neutrophils did not significantly differ upon activation as compared to controls (Figure S2). The expression of platelet genes in Neu 5 (GSE127465) or Neu 17 (GSE145230) clusters seems therefore not to result from neutrophil activation. Collectively, all these results strongly suggest that Neu 5 and or Neu 17 neutrophil cluster displaying a high expression of platelet genes most likely contained NPAs.
3.4. Gene signature of neutrophils from NPAs reveals enhanced degranulation, chemotaxis and trans‐endothelial migration capacities
To go deeper into the characterization of NPAs from NSCLC patients' whole blood leukocytes at the mRNA level, we focused our analysis on NSCLC patients' scRNAseq dataset (GSE127465). We noticed that only a fraction of cells of the Neu 5 cluster expressed platelet specific genes (PF4, PPBP and NRGN) (Figure 3F). When we reprojected cells for each individual neutrophil cluster, keeping the same UMAP parameters used to discriminate each individual subset of leukocytes, we could show that the Neu 5 cluster was more heterogeneous than the other neutrophil clusters based on visual cell dispersion (Figures 4A and S3). We selected the 48 cells coexpressing the three platelet specific genes (PF4, PPBP and NRGN) at a level above 1 log2 CPM (Figure 4A) (named “Neu 5 PPBPhigh PF4high NRGNhigh”) out of the 437 of the whole Neu 5 cluster. 48 cells out of the 8873 neutrophils analyzed represents 0,54% which is consistent with the median frequency of NPAs among all neutrophils (0.85%) found in our cohort of NSCLC patients (Figure 1D and Table S1).
To next determine if neutrophils from the NPA cluster were distinct from any other subset of neutrophils, we first performed a differential gene expression analysis of the NPA cluster (Neu 5 PPBPhigh PF4high NRGNhigh cells) in comparison to each individual neutrophil clusters (Figure 4B). We then took the union of upregulated genes in NPA cluster from each pairwise comparison, therefore yielding 191 genes. We then removed the platelet genes (Figure 4C) and identified 120 nonplatelet genes discriminating NPAs‐derived neutrophils from any other subset of neutrophils.
We next performed a pathway analysis and found a significant enrichment of neutrophil degranulation/chemotaxis‐related gene ontology (GO) biological process, secretory granules‐related GO cellular component and trans‐endothelial migration‐related KEGG gene set (Figure 4D). Collectively, these data demonstrate that NPAs‐derived neutrophils display enhanced degranulation, chemotaxis and trans‐endothelial migration functionalities.
3.5. Specific NPAs‐associated neutrophil signature is associated with a worse prognosis in pancreatic adenocarcinoma and liver hepatocellular carcinoma patients
Next we addressed the prognostic significance of neutrophils from NPAs across the different tumor types available in The Cancer Genome Atlas (TCGA). The first step was to generate a specific NPAs‐associated neutrophil signature excluding any other genes expressed in the other nonneutrophil blood immune cell type and platelets (Figure 5A) yielding 16 nonplatelet NPAs‐associated neutrophils specific genes (Figure 5B). Using scRNAseq data from human NSCLC tumor samples (discovery dataset) matching previously‐used patients' whole bloods, 31 we then eliminated RBPJ, IDH2, HELLPAR and CCNI that were highly expressed by multiple other tumor‐associated cell types (Figure S4), thus yielding a final 12‐genes NPAs‐associated neutrophil signature (Figure 5B). We next validated the specificity of this new NPAs‐associated neutrophil signature in the discovery dataset (scRNAseq dataset from NSCLC tumors) by showing that cells coexpressing at least 3 out of the 12‐genes NPA‐associated neutrophil signature were significantly more enriched in tumor‐associated neutrophils than any other major cell types present in the tumor microenvironment (Figure 5C).
FIGURE 5.
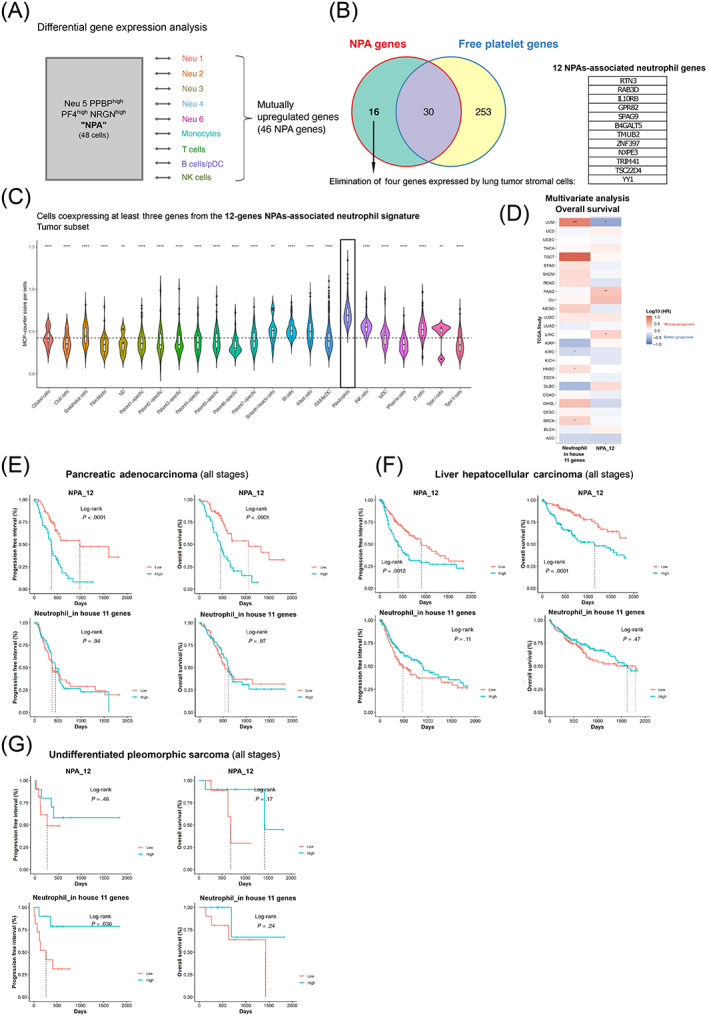
Specific NPA gene signature is associated with a worse prognosis in pancreatic adenocarcinoma and liver hepatocellular carcinoma patients. (A) Differential gene expression approach was used to get the list of mutually upregulated genes in Neu 5 PPBPhigh PF4high NRGNhigh (annotated NPA cluster) across all pairwise comparison with the remaining neutrophil clusters (Neu 1, Neu 2, Neu 3, Neu 4 and Neu 6) and nonneutrophil clusters (Monocytes, T cells, B cells/pDC and NK cells) based on public scRNAseq data from NSCLC patients' whole blood leukocytes—GSE127465. The statistical test used in the differential gene expression analysis was the Wilcoxon rank‐sum (Mann‐Whitney) test. (B) Venn diagram representing mutually and exclusive upregulated genes between the NPA cluster (mutually upregulated genes in NPA cluster across all pairwise comparison with the remaining neutrophil clusters and nonneutrophil clusters—see Table S6) and the platelet cluster (Table S3), yielding 16 upregulated genes specific to NPAs as compared to free platelet cluster. Four genes out of the 16, were removed as we they were highly expressed by lung tumor stromal cells (based on public scRNAseq data from human NSCLC tumors (GSE127465)), giving rise to the 12 gene NPA signature (listed in a table). (C) Violin plot representing the MCP counter score per cell for each stromal nonimmune cell types (Ciliated cells, Club cells, Endothelial cells, Fibroblasts, Smooth muscle cells, Type I pneumocytes and Type II pneumocytes), stromal immune cell types (B cells, Mast cells, Monocytes/Macrophages/DC (Dendritic Cells), Neutrophils, NK (Natural Killer) cells, pDC (Plasmacytoid Dendritic cells), Plasma cells and T cells) and patient‐specific tumor cell clusters, based on public scRNAseq data from human NSCLC tumors (GSE127465). All cell types were labeled based on author's annotations (GSE127465). (D) Heatmap summarizing results of the multivariate Cox analysis of prognostic values (OS) of various immune signatures across all available TCGA cohorts. Y axis correspond to TCGA cohorts. Each line corresponds to a particular cancer type annotated with the TCGA short name. X axis corresponds to the canonical neutrophil signature (annotated “in house 11 genes”—see Table S2) and the 12‐genes NPAs‐associated neutrophil signature (annotated “NPA_12”—see Figure 5B). HR corresponds to the hazard ratio expressed in log10. Positive HR values (in red) correspond to a worse prognosis and negative HR values (in blue) correspond to a better prognosis. * refers to an adjusted P‐value <.05. ** refers to an adjusted P‐value <.01. (E‐G) Univariate survival analysis in pancreatic adenocarcinoma (PAAD), Liver Hepatocellular Carcinoma (LIHC) and undifferentiated pleomorphic sarcoma (UPS) cancer patients (all stages) using Kaplan‐Meier method. Cohort of PAAD, LIHC and UPS cancer patients were cut at tercile values based on mean expression of “in house 11 genes” or “NPA_12” signature, yielding two groups (highest tercile or lowest tercile for expression of the signature of interest) [Color figure can be viewed at wileyonlinelibrary.com]
We next evaluated the prognostic value of the 12‐genes NPAs‐associated neutrophil signature with a pan‐cancer approach in the TCGA database (Figure 5B). For comparison purposes, we interrogated the prognostic value of conventional neutrophils by using our neutrophil signature “in house 11 genes” (Table S2) that we proved to be highly specific to neutrophils in two independent scRNAseq datasets (Figures 5C and S1C). By performing a multivariate Cox analysis, we did not find any association between the NPAs‐associated neutrophil signature and the prognosis of either types of NSCLC cancer patients, lung squamous cell carcinoma (LUSC) and lung adenocarcinoma (LUAD) (Figure 5D). Nevertheless, we could find that the signature was statistically associated with a worse progression‐free interval (PFI) (P‐value <.001, Hazard Ratio [HR] = 2.9) and overall survival (OS) (P‐value <.001, HR = 2.6) in pancreatic adenocarcinoma cancer patients (PAAD) (Figures 5D and S5A), as well as in liver hepatocellular carcinoma cancer patients (LIHC) (PFI: P‐value = .063, HR = 1.45; OS: P‐value = .004, HR = 2.1) (Figures 5D and S5B). The canonical neutrophil signature “in house 11 genes” could not recapitulate such significant prognostic values in PAAD and LIHC reinforcing the idea that NPAs‐associated neutrophils is a unique population of neutrophils with different clinical outcomes (Figure 5D). Kaplan‐Meier univariate analysis also showed the poorer prognostic values of the 12‐genes NPAs‐associated neutrophil signature in PAAD (Figure 5E) and LIHC cancer patients (Figure 5F). The canonical neutrophil signature “in house 11 genes” did not show any statistically significant association with prognosis in PAAD cancer patients (Figure 5E), nor in LIHC cancer patients (Figure 5F). This implies again that NPAs‐associated neutrophils are distinct from canonical neutrophils. Interestingly, conventional neutrophil signature was recently reported to be associated with better clinical outcome in a subtype of sarcoma, known as undifferentiated pleomorphic sarcoma (UPS). 3 We confirmed such finding as we found that a high expression of our neutrophil signature “in house 11 genes” correlated with a significant better PFI (P‐value = .036), but not a significant greater OS (P‐value = .24) in UPS patients (Figure 5G). Nevertheless, in such patients, the 12‐genes NPAs‐associated neutrophil signature did not show any statistically significant association with prognosis, ruling out the fact that good prognosis neutrophils in UPS are NPAs. Collectively, our results therefore suggest that a subset of neutrophils, corresponding to NPAs‐associated neutrophils, when present in tumors may be detrimental in PAAD and LIHC cancer patients.
4. DISCUSSION
To our knowledge, our study is the first to report the identification and characterization of NPAs at the transcriptomic level, based on scRNAseq data from human whole blood leukocytes. Based on their transcriptomic profile, we found that neutrophils bound to NPAs displayed enhanced degranulation, chemotaxis and trans‐endothelial migration features. Our results collectively showed that neutrophils from NPAs represent a distinct subset of neutrophils, related to LDNs. Lastly, using TCGA database, we showed that our specific NPAs‐associated neutrophil signature was associated with a worse prognosis in PAAD and LIHC cancer patients. Hence, NPAs may hold clinical utility as novel noninvasive blood prognostic biomarker in cancer patients with solid tumors.
Using ISX, we were able to distinguish and quantify accurately NPAs in our cohort of NSCLC cancer patients and HDs. Although we did not find a significant difference in the percentage of NPAs between NSCLC cancer patients and HD, one NSCLC patient displayed more than a 3‐fold increase of NPA proportion compared to the mean frequency of NPAs in NSCLC patients and HDs (Figure 1D). Interestingly, this patient also displayed the highest number of different metastatic sites (Table S1), as well as an extremely high NLR value of 34.56 (Table S1). This is consistent with the poorer clinical outcome of patients with elevated NLR values, including NSCLC patients. 46 This high NLR value was mostly explained by a massive increase in the absolute neutrophil count (ANC), rather than a decrease in the absolute lymphocyte count. Mounting evidence have shown that high ANC alone, was also significantly associated with poorer prognosis in NSCLC cancer patients, 47 , 48 including in response to immune checkpoint inhibitors (ICIs). 49 , 50 , 51 It would be of great interest in future studies to determine if the percentage of circulating NPAs, in comparison to the other cost‐effective and noninvasive NLR and ANC, is more accurately associated with response to immunotherapy.
By performing a Ficoll density gradient, we showed that NPAs define a subset of LDNs but are absent in NDN fraction, illustrating that platelets preferentially bind to LDN in contrast to NDN (Figure 2C‐E). Several studies have reported a link between LDNs and cancer progression. 46 Many research groups indeed reported that LDNs displayed enhanced T‐cell suppressive properties, expanded in cancer patients' blood as opposed to healthy donors. 11 , 12 , 13 , 14 , 52 Recent evidence have shown that high LDN expansion in cancer patients' blood was associated with worse prognosis, 11 , 12 including NSCLC patients. 12 Nevertheless, it remains to be known why platelets bind preferentially to LDNs. The lower density of neutrophil bound to platelet may be a consequence of platelet binding. Since NDN activation is sufficient to convert NDNs into LDNs, 41 one can hypothesize that platelets interacting with NDN activate and convert them into LDNs. It is also likely that platelets may behave as floats changing NDNs' density and retaining them at the surface of the Ficoll gradient, explaining their recovery within peripheral blood mononuclear cells. Although we did not document a significant increase of NPAs frequency in patient, likely as a consequence of the small size of the cohort, the fact that LDNs increase in cancer patients strongly suggests that the frequency of NPAs also increases in cancer patients.
Although unexpected, our study identified a yet unreported new subset of neutrophils in scRNAseq data with high platelet gene expression that most likely correspond to NPAs. We ruled out the possibility that platelet genes could be expressed by a subset of activated neutrophils as we did not find enrichment of platelet signature in stimulated neutrophils (Figure S2). Moreover, it is also unlikely that neutrophils expressing platelet genes correspond to a common progenitor of megakaryocyte (platelet‐producing cell) and neutrophils, as the closest common progenitor between the two is the common myeloid progenitor (CMP), which gives rise to all myeloid cells. 53 High expression of neutrophil‐specific genes at this stage of differentiation is therefore unlikely to occur. Taken together, platelet genes are more likely to be expressed exogenously by neutrophils through aggregated‐platelets. It is, however, plausible that platelets could have been isolated in the same droplet than neutrophils, without any interaction. The potential random contamination of platelets during single cell isolation of immune cells would have yielded cluster of cells expressing platelet‐specific genes in all immune cell types. However, expression of platelet specific genes was mostly observed in neutrophils as opposed to other major immune cell types (Figure 3F). To note that some monocytes also displayed expression of platelet specific genes which is consistent with the fact that platelets may also aggregate with circulating monocytes. 18 Interestingly, we found that the frequency of neutrophil coexpressing the three platelet specific genes (PF4, PPBP and NRGN) was very similar to the one we accurately determined by ISX in our cohort of NSCLC patients. This further supports that the cluster of neutrophils with high expression of platelet genes identified in Zilionis' scRNAseq dataset (GSE127465) corresponds to NPAs.
In contrast to the other subsets of circulating neutrophils, we found that neutrophils from NPAs displayed enhanced degranulation, chemotaxis and trans‐endothelial migration features, based on the specific transcriptomic signature of NPAs. This is consistent with previous reports showing that platelet binding to neutrophils boosted their potential to release granules, 22 increased their capacity to transmigrate through endothelial cells 25 , 26 to exacerbate inflammation thereby promoting disease progression. 21 , 27 , 28 , 29 One can speculate that if neutrophils from NPAs display higher transmigration potential, they would infiltrate tumors more efficiently and then fuel tumor growth and metastasis.
We found that NPA signature was highly detected in few tumor types in the TCGA data base and was strongly associated with a poorer prognosis in PAAD and LIHC cancer patients. This is consistent with the tumor‐promoting role of TAN documented in pancreatic 54 , 55 and liver 56 cancer. Interestingly, we found that the canonical neutrophil signature “in house 11 genes” could not recapitulate such significant poorer prognostic values in PAAD and LIHC, reinforcing the idea that neutrophil from NPA would account for most of tumor‐promoting role of TAN in such cancer types. Moreover, we provided evidence that NPAs‐associated neutrophils more likely resemble LDNs (Figure 2) that are described to possess tumor‐promoting functions, 11 , 13 supporting the idea that NPAs‐associated neutrophils once becoming TANs after tumor infiltration would fuel tumor growth.
Beyond their potential role in cancer, recent studies have reported an increase in the percentage of circulating NPAs in COVID‐19 patients in contrast to HDs. 57 , 58 Interestingly, patients who had severe forms of COVID‐19 displayed a significant higher level of NPAs in contrast to patients who had moderate forms. 58 We showed that NPAs displayed enhanced degranulation/activation, based on their specific transcriptomic signature (Figure 4D). This is in accordance with a recent report showing in bulk granulocyte RNAseq data from COVID‐19 patients an increase expression of granulocyte activation‐associated factors in severe COVID‐19 patients in contrast to mild ones. 59 Whether NPAs may not just be a consequence but also a cause of COVID‐19 severity remains to be investigated in future studies.
CONFLICT OF INTEREST
All authors declare that they have no competing interests.
AUTHOR CONTRIBUTIONS
Conceptualization: Pacôme Lecot, Christophe Caux and Marie‐Cécile Michallet; methodology: Pacôme Lecot, Maude Ardin, Sébastien Dussurgey, Manuela Pereira Abrantes, Vincent Alcazer, Lyvia Moudombi, Margaux Hubert, Hector Hernandez‐Vargas, Alain Viari, Christophe Caux and Marie‐Cécile Michallet; formal analysis: Pacôme Lecot, Maude Ardin, Sébastien Dussurgey, Vincent Alcazer, Lyvia Moudombi and Margaux Hubert; investigation: Pacôme Lecot, Maude Ardin, Sébastien Dussurgey, Vincent Alcazer, Lyvia Moudombi, Margaux Hubert, Aurélie Swalduz, Hector Hernandez‐Vargas, Alain Viari, Christophe Caux and Marie‐Cécile Michallet; resources: Aurélie Swalduz, Christophe Caux and Marie‐Cécile Michallet; writing—original draft: Pacôme Lecot; writing—review and editing: Maude Ardin, Sébastien Dussurgey, Vincent Alcazer, Lyvia Moudombi, Christophe Caux and Marie‐Cécile Michallet; visualization: Pacôme Lecot, Maude Ardin, Sébastien Dussurgey, Vincent Alcazer, Lyvia Moudombi and Margaux Hubert; supervision: Christophe Caux and Marie‐Cécile Michallet; funding acquisition: Pacôme Lecot, Alain Viari, Christophe Caux and Marie‐Cécile Michallet. All authors read and approved the final manuscript. The work reported in the study has been performed by the authors, unless clearly specified in the text.
ETHICS STATEMENT
Metastatic NSCLC patients (Table S1) included in the LIBIL clinical trial (NCT02511288) at the Léon Bérard Hospital as well as healthy donors from Etablissement Français du Sang provided informed consent regarding the use of their blood for research purpose. The LIBIL protocol was approved by the Comité de Protection des Personnes Ouest VI, ref: CPP Ouest 6‐CPP 1023‐HPS2.
Supporting information
Table S1 Blood‐related biological information and clinical features of NSCLC patients and healthy donors
Table S2 Platelet and neutrophil‐specific signatures.
Table S3 List of upregulated genes in free platelet cluster as compared to all other leukocytes.
Table S4 List of upregulated genes in Neu 5 as compared to all other leukocytes.
Table S5 Platelet gene‐free specific NPA signature as opposed to the remaining neutrophil clusters.
Appendix S1: Supporting Information.
ACKNOWLEDGEMENTS
We thank Laurie Tonon, Janice Kielbassa, Antoine Debiesse, Jenny Valladeau‐Guilemond, Roxane Pommier and Elisa Gobbini for careful reading of the manuscript, helpful comments and suggestions. We thank all members of the Caux team for their help and critical scientific comments. We want to thank the staff of the core facilities at the Cancer Research Center of Lyon (CRCL) for technical assistance, especially the cytometry core facility, the biological resource center (BRC) of the Centre Léon Bérard (CLB) for providing human samples, and the cytology lab (Emilie Josserand, Amandine Boyer) for helping us in performing May‐Grünwald‐Giemsa staining. We also thank Sarah Barrin and Justine Berthet for helping us taking images.
Lecot P, Ardin M, Dussurgey S, et al. Gene signature of circulating platelet‐bound neutrophils is associated with poor prognosis in cancer patients. Int J Cancer. 2022;151(1):138‐152. doi: 10.1002/ijc.33991
Funding informationThis work was supported by the Agence Nationale de la Recherche (contracts: ANR‐11‐EQPX‐0035 PHENOCAN) as well as the CELPHEDIA Infrastructure (http://www.celphedia.eu/), especially the center AniRA in Lyon, for the use of ImageStreamX. P. Lecot was supported by grants from the French Government PhD Fellowship (2016‐2019), and 1‐year extension Ph.D. Fellowship from Ligue Nationale contre le cancer (2019/2020). We also want to thank the Plan Cancer (INCa‐ITMO Cancer), the Ligue contre le Cancer (Régionale Auvergne‐Rhône‐Alpes, Comité du Rhône), the Ruban Rose association, the Institut Convergence PLAsCAN (ANR‐17‐CONV‐0002) the LABEX DEVweCAN (ANR‐10‐LABX‐0061) of the University of Lyon and the RHU MyPROBE (ANR‐17‐RHUS‐0008), both within the program Investissements d'Avenir organized by the French National Research Agency (ANR), and the LYRICAN (grant INCa‐DGOS‐Inserm_12563).
DATA AVAILABILITY STATEMENT
Data sources and handling of the publicly available datasets used in our study are described in the Materials and Methods and in Tables S1 to S6. Further details and other data that support the findings of our study are available from the corresponding author upon request.
REFERENCES
- 1. Blaisdell A, Crequer A, Columbus D, et al. Neutrophils oppose uterine epithelial carcinogenesis via debridement of hypoxic tumor cells. Cancer Cell. 2015;28:785‐799. [DOI] [PMC free article] [PubMed] [Google Scholar]
- 2. Singhal S, Bhojnagarwala PS, O'Brien S, et al. Origin and role of a subset of tumor‐associated neutrophils with antigen‐presenting cell features in early‐stage human lung cancer. Cancer Cell. 2016;30:120‐135. [DOI] [PMC free article] [PubMed] [Google Scholar]
- 3. Ponzetta A, Carriero R, Carnevale S, et al. Neutrophils driving unconventional T cells mediate resistance against murine sarcomas and selected human tumors. Cell. 2019;178:346‐360.e24. [DOI] [PMC free article] [PubMed] [Google Scholar]
- 4. Coffelt SB, Kersten K, Doornebal CW, et al. IL17‐producing γδ T cells and neutrophils conspire to promote breast cancer metastasis. Nature. 2015;522:345‐348. [DOI] [PMC free article] [PubMed] [Google Scholar]
- 5. Wculek SK, Malanchi I. Neutrophils support lung colonization of metastasis‐initiating breast cancer cells. Nature. 2015;528:413‐417. [DOI] [PMC free article] [PubMed] [Google Scholar]
- 6. Albrengues J, Shields MA, Ng D, et al. Neutrophil extracellular traps produced during inflammation awaken dormant cancer cells in mice. Science. 2018;361:eaao4227. [DOI] [PMC free article] [PubMed] [Google Scholar]
- 7. Templeton AJ, McNamara MG, Šeruga B, et al. Prognostic role of neutrophil‐to‐lymphocyte ratio in solid tumors: a systematic review and meta‐analysis. J Natl Cancer Inst. 2014;106:dju124. [DOI] [PubMed] [Google Scholar]
- 8. Paramanathan A, Saxena A, Morris DL. A systematic review and meta‐analysis on the impact of pre‐operative neutrophil lymphocyte ratio on long term outcomes after curative intent resection of solid tumours. Surg Oncol. 2014;23:31‐39. [DOI] [PubMed] [Google Scholar]
- 9. Vano Y‐A, Oudard S, By M‐A, et al. Optimal cut‐off for neutrophil‐to‐lymphocyte ratio: fFact or fFantasy? A prospective cohort study in metastatic cancer patients. PLoS One. 2018;13:e0195042. [DOI] [PMC free article] [PubMed] [Google Scholar]
- 10. Nakamura Y, Watanabe R, Katagiri M, et al. Neutrophil/lymphocyte ratio has a prognostic value for patients with terminal cancer. World J Surg Oncol [Internet]. 2016;14:148 Accessed April 24, 2019. https://www.ncbi.nlm.nih.gov/pmc/articles/PMC4867538/ [DOI] [PMC free article] [PubMed] [Google Scholar]
- 11. Lang S, Bruderek K, Kaspar C, et al. Clinical relevance and suppressive capacity of human myeloid‐derived suppressor cell subsets. Clin Cancer Res. 2018;24:4834‐4844. [DOI] [PubMed] [Google Scholar]
- 12. Shaul ME, Eyal O, Guglietta S, et al. Circulating neutrophil subsets in advanced lung cancer patients exhibit unique immune signature and relate to prognosis. FASEB J. 2020;34:4204‐4218. [DOI] [PubMed] [Google Scholar]
- 13. Condamine T, Dominguez GA, Youn J‐I, et al. Lectin‐type oxidized LDL receptor‐1 distinguishes population of human polymorphonuclear myeloid‐derived suppressor cells in cancer patients. Sci Immunol. 2016 Aug;1(2):aaf8943. [DOI] [PMC free article] [PubMed] [Google Scholar]
- 14. Sagiv JY, Michaeli J, Assi S, et al. Phenotypic diversity and plasticity in circulating neutrophil subpopulations in cancer. Cell Rep. 2015;10:562‐573. [DOI] [PubMed] [Google Scholar]
- 15. Si Y, Merz SF, Jansen P, et al. Multidimensional imaging provides evidence for down‐regulation of T cell effector function by MDSC in human cancer tissue. Sci Immunol. 2019 Oct;4(40):eaaw9159. [DOI] [PubMed] [Google Scholar]
- 16. Engblom C, Pfirschke C, Zilionis R, et al. Osteoblasts remotely supply lung tumors with cancer‐promoting SiglecFhigh neutrophils. Science. 2017 Dec;358(6367):eaal5081. [DOI] [PMC free article] [PubMed] [Google Scholar]
- 17. Wu C, Ning H, Liu M, et al. Spleen mediates a distinct hematopoietic progenitor response supporting tumor‐promoting myelopoiesis. J Clin Invest. 2018;128:3425‐3438. [DOI] [PMC free article] [PubMed] [Google Scholar]
- 18. Han P, Hanlon D, Arshad N, et al. Platelet P‐selectin initiates cross‐presentation and dendritic cell differentiation in blood monocytes. Sci Adv. 2020;6:eaaz1580. [DOI] [PMC free article] [PubMed] [Google Scholar]
- 19. McDonald B, Urrutia R, Yipp BG, Jenne CN, Kubes P. Intravascular neutrophil extracellular traps capture bacteria from the bloodstream during sepsis. Cell Host Microbe. 2012;12:324‐333. [DOI] [PubMed] [Google Scholar]
- 20. Clark SR, Ma AC, Tavener SA, et al. Platelet TLR4 activates neutrophil extracellular traps to ensnare bacteria in septic blood. Nat Med. 2007;13:463‐469. [DOI] [PubMed] [Google Scholar]
- 21. Caudrillier A, Kessenbrock K, Gilliss BM, et al. Platelets induce neutrophil extracellular traps in transfusion‐related acute lung injury. J Clin Invest. 2012;122:2661‐2671. [DOI] [PMC free article] [PubMed] [Google Scholar]
- 22. Peters MJ, Dixon G, Kotowicz KT, Hatch DJ, Heyderman RS, Klein NJ. Circulating platelet‐neutrophil complexes represent a subpopulation of activated neutrophils primed for adhesion, phagocytosis and intracellular killing. Br J Haematol. 1999;106:391‐399. [DOI] [PubMed] [Google Scholar]
- 23. Assinger A, Laky M, Schabbauer G, et al. Efficient phagocytosis of periodontopathogens by neutrophils requires plasma factors, platelets and TLR2. J Thromb Haemost. 2011;9:799‐809. [DOI] [PubMed] [Google Scholar]
- 24. Hurley SM, Kahn F, Nordenfelt P, Mörgelin M, Sørensen OE, Shannon O. Platelet‐dependent neutrophil function is dysregulated by M protein from Streptococcus pyogenes . Infect Immun. 2015;83:3515‐3525. [DOI] [PMC free article] [PubMed] [Google Scholar]
- 25. Lam FW, Burns AR, Smith CW, Rumbaut RE. Platelets enhance neutrophil transendothelial migration via P‐selectin glycoprotein ligand‐1. Am J Physiol Heart Circ Physiol. 2011;300:H468‐H475. [DOI] [PMC free article] [PubMed] [Google Scholar]
- 26. Badrnya S, Butler LM, Söderberg‐Naucler C, Volf I, Assinger A. Platelets directly enhance neutrophil transmigration in response to oxidised low‐density lipoprotein. Thromb Haemost. 2012;108:719‐729. [DOI] [PubMed] [Google Scholar]
- 27. Sreeramkumar V, Adrover JM, Ballesteros I, et al. Neutrophils scan for activated platelets to initiate inflammation. Science. 2014;346:1234‐1238. [DOI] [PMC free article] [PubMed] [Google Scholar]
- 28. García‐Prieto J, Villena‐Gutiérrez R, Gómez M, et al. Neutrophil stunning by metoprolol reduces infarct size. Nat Commun. 2017;8:14780. [DOI] [PMC free article] [PubMed] [Google Scholar]
- 29. Hou Q, Liu F, Chakraborty A, et al. Inhibition of IP6K1 suppresses neutrophil‐mediated pulmonary damage in bacterial pneumonia. Sci Transl Med. 2018 Apr;10(435):eaal4045. [DOI] [PMC free article] [PubMed] [Google Scholar]
- 30. Mauler M, Seyfert J, Haenel D, et al. Platelet‐neutrophil complex formation—a detailed in vitro analysis of murine and human blood samples. J Leukoc Biol. 2016;99:781‐789. [DOI] [PubMed] [Google Scholar]
- 31. Zilionis R, Engblom C, Pfirschke C, et al. Single‐cell transcriptomics of human and mouse lung cancers reveals conserved myeloid populations across individuals and species. Immunity. 2019;50:1317‐1334.e10. [DOI] [PMC free article] [PubMed] [Google Scholar]
- 32. Wolock SL, Lopez R, Klein AM. Scrublet: computational identification of cell doublets in single‐cell transcriptomic data. Cell Syst. 2019;8:281‐291.e9. [DOI] [PMC free article] [PubMed] [Google Scholar]
- 33. Newman AM, Liu CL, Green MR, et al. Robust enumeration of cell subsets from tissue expression profiles. Nat Methods. 2015;12:453‐457. [DOI] [PMC free article] [PubMed] [Google Scholar]
- 34. Gupta S, Nakabo S, Blanco LP, et al. Sex differences in neutrophil biology modulate response to type I interferons and immunometabolism. Proc Natl Acad Sci USA. 2020;117:16481‐16491. [DOI] [PMC free article] [PubMed] [Google Scholar]
- 35. Fu R, Gillen AE, Sheridan RM, et al. cclustifyr: an R package for automated single‐cell RNA sequencing cluster classification. F1000Res. 2020;9:223. [DOI] [PMC free article] [PubMed] [Google Scholar]
- 36. Becht E, Giraldo NA, Lacroix L, et al. Estimating the population abundance of tissue‐infiltrating immune and stromal cell populations using gene expression. Genome Biol. 2016;17:218. [DOI] [PMC free article] [PubMed] [Google Scholar]
- 37. Aran D, Looney AP, Liu L, et al. Reference‐based analysis of lung single‐cell sequencing reveals a transitional profibrotic macrophage. Nat Immunol. 2019;20:163‐172. [DOI] [PMC free article] [PubMed] [Google Scholar]
- 38. Polanowska‐Grabowska R, Wallace K, Field JJ, et al. P‐selectin‐mediated platelet‐neutrophil aggregate formation activates neutrophils in mouse and human sickle cell disease. Arterioscler Thromb Vasc Biol. 2010;30:2392‐2399. [DOI] [PMC free article] [PubMed] [Google Scholar]
- 39. Ueno K, Nomura Y, Morita Y, Eguchi T, Masuda K, Kawano Y. Circulating platelet‐neutrophil aggregates play a significant role in Kawasaki disease. Circ J. 2015;79:1349‐1356. [DOI] [PubMed] [Google Scholar]
- 40. Herster F, Bittner Z, Codrea MC, et al. Platelets aggregate with neutrophils and promote skin pathology in psoriasis. Front Immunol. 2019;10:1867. [DOI] [PMC free article] [PubMed] [Google Scholar]
- 41. Rodriguez PC, Ernstoff MS, Hernandez C, et al. Arginase I‐producing myeloid‐derived suppressor cells in renal cell carcinoma are a subpopulation of activated granulocytes. Cancer Res. 2009;69:1553‐1560. [DOI] [PMC free article] [PubMed] [Google Scholar]
- 42. Trellakis S, Bruderek K, Dumitru CA, et al. Polymorphonuclear granulocytes in human head and neck cancer: enhanced inflammatory activity, modulation by cancer cells and expansion in advanced disease. Int J Cancer. 2011;129:2183‐2193. [DOI] [PubMed] [Google Scholar]
- 43. Raghavachari N, Xu X, Harris A, et al. Amplified expression profiling of platelet transcriptome reveals changes in arginine metabolic pathways in patients with sickle cell disease. Circulation. 2007;115:1551‐1562. [DOI] [PMC free article] [PubMed] [Google Scholar]
- 44. Daryadel A, Yousefi S, Troi D, et al. RhoH/TTF negatively regulates leukotriene production in neutrophils. J Immunol. 2009;182:6527‐6532. [DOI] [PubMed] [Google Scholar]
- 45. Khaenam P, Rinchai D, Altman MC, et al. A transcriptomic reporter assay employing neutrophils to measure immunogenic activity of septic patients'’ plasma. J Transl Med. 2014;12:65. [DOI] [PMC free article] [PubMed] [Google Scholar]
- 46. Lecot P, Sarabi M, Pereira Abrantes M, et al. Neutrophil heterogeneity in cancer: from biology to therapies. Front Immunol. 2019;10:2155. [DOI] [PMC free article] [PubMed] [Google Scholar]
- 47. Schernberg A, Mezquita L, Boros A, et al. Neutrophilia as prognostic biomarker in locally advanced stage III lung cancer. PLoS One [Internet]. 2018;13:e0204490 Accessed June 16, 2020. https://www.ncbi.nlm.nih.gov/pmc/articles/PMC6179235/ [DOI] [PMC free article] [PubMed] [Google Scholar]
- 48. Soyano AE, Dholaria B, Marin‐Acevedo JA, et al. Peripheral blood biomarkers correlate with outcomes in advanced non‐small cell lung cancer patients treated with anti‐PD‐1 antibodies. J Immunother Cancer. 2018;6:129. [DOI] [PMC free article] [PubMed] [Google Scholar]
- 49. Ameratunga M, Chénard‐Poirier M, Moreno Candilejo I, et al. Neutrophil‐lymphocyte ratio kinetics in patients with advanced solid tumours on phase I trials of PD‐1/PD‐L1 inhibitors. Eur J Cancer. 2018;89:56‐63. [DOI] [PubMed] [Google Scholar]
- 50. Diem S, Schmid S, Krapf M, et al. Neutrophil‐to‐lymphocyte ratio (NLR) and platelet‐to‐lymphocyte ratio (PLR) as prognostic markers in patients with non‐small cell lung cancer (NSCLC) treated with nivolumab. Lung Cancer. 2017;111:176‐181. [DOI] [PubMed] [Google Scholar]
- 51. Capone M, Giannarelli D, Mallardo D, et al. Baseline neutrophil‐to‐lymphocyte ratio (NLR) and derived NLR could predict overall survival in patients with advanced melanoma treated with nivolumab. J Immunother Cancer. 2018;6:74. [DOI] [PMC free article] [PubMed] [Google Scholar]
- 52. Rodriguez PC, Quiceno DG, Zabaleta J, et al. Arginase I production in the tumor microenvironment by mature myeloid cells inhibits T‐cell receptor expression and antigen‐specific T‐cell responses. Cancer Res. 2004;64:5839‐5849. [DOI] [PubMed] [Google Scholar]
- 53. Weiskopf K, Schnorr PJ, Pang WW, et al. Myeloid cell origins. Microbiol Spectr. 2016 Oct;4(5):10.1128/microbiolspec.MCHD‐0031‐2016. [DOI] [PMC free article] [PubMed] [Google Scholar]
- 54. Steele CW, Karim SA, Leach JDG, et al. CXCR2 inhibition profoundly suppresses metastases and augments immunotherapy in pancreatic ductal adenocarcinoma. Cancer Cell. 2016;29:832‐845. [DOI] [PMC free article] [PubMed] [Google Scholar]
- 55. Nywening TM, Belt BA, Cullinan DR, et al. Targeting both tumour‐associated CXCR2+ neutrophils and CCR2+ macrophages disrupts myeloid recruitment and improves chemotherapeutic responses in pancreatic ductal adenocarcinoma. Gut. 2018;67:1112‐1123. [DOI] [PMC free article] [PubMed] [Google Scholar]
- 56. Zhou S‐L, Zhou Z‐J, Hu Z‐Q, et al. Tumor‐associated neutrophils recruit macrophages and T‐regulatory cells to promote progression of hepatocellular carcinoma and resistance to sorafenib. Gastroenterology. 2016;150:1646‐1658.e17. [DOI] [PubMed] [Google Scholar]
- 57. Manne BK, Denorme F, Middleton EA, et al. Platelet gene expression and function in patients with COVID‐19. Blood. 2020;136:1317‐1329. [DOI] [PMC free article] [PubMed] [Google Scholar]
- 58. Le Joncour A, Biard L, Vautier M, et al. Neutrophil‐platelet and monocyte‐platelet aggregates in COVID‐19 patients. Thromb Haemost. 2020;120:1733‐1735. [DOI] [PMC free article] [PubMed] [Google Scholar]
- 59. Aschenbrenner AC, Mouktaroudi M, Krämer B, et al. Disease severity‐specific neutrophil signatures in blood transcriptomes stratify COVID‐19 patients. Genome Med. 2021;13:7. [DOI] [PMC free article] [PubMed] [Google Scholar]
Associated Data
This section collects any data citations, data availability statements, or supplementary materials included in this article.
Supplementary Materials
Table S1 Blood‐related biological information and clinical features of NSCLC patients and healthy donors
Table S2 Platelet and neutrophil‐specific signatures.
Table S3 List of upregulated genes in free platelet cluster as compared to all other leukocytes.
Table S4 List of upregulated genes in Neu 5 as compared to all other leukocytes.
Table S5 Platelet gene‐free specific NPA signature as opposed to the remaining neutrophil clusters.
Appendix S1: Supporting Information.
Data Availability Statement
Data sources and handling of the publicly available datasets used in our study are described in the Materials and Methods and in Tables S1 to S6. Further details and other data that support the findings of our study are available from the corresponding author upon request.