
FIGURE 6.
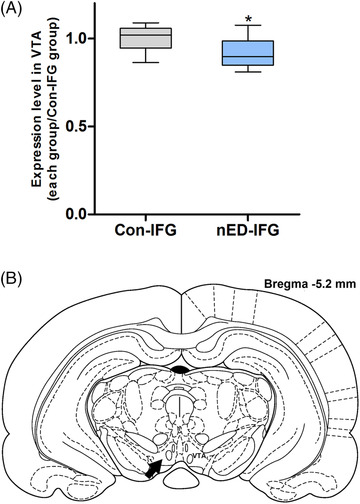
(A) Semi‐quantification results of tyrosine hydroxylase (TH) expression levels in FluoroGold‐labeled cells in the ventral tegmental area (VTA). The percentage of FluoroGold + TH‐positive cells/total cells was calculated. Expression levels are presented as fold‐changes relative to those of the control group for central infused of FluoroGold for immunofluorescence analysis (Con‐IFG). Whiskers: maximum and minimum. * p < 0.05; ** p < 0.005 different from the Con‐IFG group. (B) Schematic representation of the rat brain showing the position of the VTA (indicated by an arrow)