

Abstract
Abstract
Beverage color significantly affects perceived sensory quality and consumer preference. Although the color of coffee beans is well known to vary strongly with roast level, little work has examined how roast level and brewing conditions affect the color of the final beverage. Here, we report that the color of full immersion brewed coffee is significantly affected by both roast level and brewing temperature. Coffees from three different origins were each roasted to three different levels (light, medium, and dark) and then brewed at three different temperatures (4, 22, and 92°C). Each sample was brewed toward full extraction and then diluted to precisely 2% total dissolved solids so that differences in concentration would not confound color measurements. Absorbance spectra (UV‐vis) and color tristimulus values (L*a*b*) were then collected and analyzed. We find that roast level had the strongest impact on brew color, and that brew temperature had a significant impact on color for light and medium roasts, with less impact on dark roasts. Qualitatively, the cold brewed coffees tended to be redder, while the hot brewed coffees were blacker. The results suggest that there is an opportunity to manipulate and brand brewed coffee color through judicious choices of roast level and brewing temperature.
Practical Application
Color serves as an indicator of coffee quality and potentially could affect perceived sensory characteristics. Our results suggest that appropriate control of roast level and brew temperature could yield desired colors for novel coffee products.
Keywords: brew temperature, coffee, cold brew, color, roast level
1. INTRODUCTION
Coffee bean color serves as a robust and valuable indicator of roast level in the coffee industry (Da Porto et al., 1991). Color measurements, whether on the Agtron Gourmet scale (Staub, 1995) or in the form of tristimulus color values, such as the C.I.E. (International Commission on Illumination) L*a*b* (Lawless & Heymann, 2010a), are often included alongside qualitative roast determinations (“light,” “medium,” “dark,” etc.) as a means of quantifying the color of the roast (Bicho et al., 2012; Da Porto et al., 1991; Nicoli et al., 1997; Sacchetti et al., 2009). Da Porto et al., 1991 examined how color of whole and ground coffee beans changes with roast in the C.I.E. L*a*b* color space—as roast level increased, L*a*b* values increased up until a light‐medium level roast, and then began to rapidly decrease (Da Porto et al., 1991). Similar findings were reported by Nicoli et al. (1997), who quantified how increased roasting times led to increased degrees of browning. The color of the grounds remains an important quantitative measure of roast even when examining other physicochemical aspects of coffee such as antioxidant activity and volatile compounds (Cangussu et al., 2020; Lee et al., 2013; Nicoli et al., 1997; Sacchetti et al., 2009).
Qualitatively, color can affect perceived sensory characteristics (Lawless & Heymann, 2010a). Color is typically the first assessment of quality a consumer makes, making color a primary indicator of perceived quality (Ferreira et al., 2020; Lawless & Heymann, 2010a; Mazzafera et al., 1988). Moreover, the color and appearance of the product serves as a cue for changes in aroma and flavor such as the browning that occurs during the coffee roasting process (Cangussu et al., 2020; Lawless & Heymann, 2010a).
While the color of coffee beans versus roast level has been measured extensively, the color of the resulting brew has received less attention. In early work, Pangborn tested how visual attributes, such as color intensity, turbidity, iridescence, and sediment, can vary alongside flavor attributes, such as strength (i.e., total dissolved solids [TDS]), bitterness, or burnt flavor, and revealed that across different brew temperatures and holding times, color intensity and strength were rated proportionally (Pangborn, 1982). More recent work has corroborated this result. Color was subjectively measured on a scale of one to five by untrained panelists to examine the correlation between perceived color and roast times (Anisa et al., 2017). Kalschne et al. (2019) reported that across different types of coffee, color was the most appreciated attribute, solidifying subjective judgments of color as central to consumers’ perception of their beverage. Moreover, color has been labeled a defining characteristic during Free‐Choice Profiling of brews made from beans grown in different planting designs (dos Santos Scholz et al., 2018), emphasizing its role in the perceived quality of the beverage.
Notably, this prior work focused on subjective perceptions of coffee brew color. Work by Dmowski and Dabrowska (2014) examined the impact of roast on the color of coffee beverage as measured by a colorimeter, but they found no significant difference in color between the three very similar roast levels chosen (Dmowski & Dabrowska, 2014). To date, there is no published work that quantitatively and systematically focuses on the actual color of the brew. It is unclear how roast level translates to the coffee brew itself, nor how brew temperature can further impact the color of the final cup.
In this study, we measured the color of Toddy‐style full immersion brewed coffee across multiple origins, roast levels, and brew temperatures. Color was examined both qualitatively, using photography and absorbance spectra, and quantitatively using the Agtron Gourmet scale (Staub, 1995) and C.I.E. L*a*b* color measures. The experiments were designed to elucidate how the color of the coffee brew is influenced by roast level and brew temperature for coffees from different, representative origins.
2. MATERIALS AND METHODS
2.1. Experimental design
To systematically investigate what affects the color of brewed coffee, we used a classic factorial experimental design (Lawless & Heymann, 2010b) to examine a wide range of parameters. Green coffees from three different origins were each roasted to three different degrees of roast level, and then each of those was brewed at three temperatures, resulting in 3 × 3 × 3 = 27 unique sample types. Each sample was then assessed with physical measurements (TDS, titratable acidity [TA], and pH) and colorimetric measurements (Agtron Gourmet Scale, C.I.E. L*a*b*, and UV‐vis absorbance). Each of the 27 sample types was prepared in triplicate to allow for full statistical analysis.
2.2. Coffee
Green Coffea arabica coffee beans from three different origins were used: El Salvador Cerro Las Ranas Honey (ELS), Ethiopia Guji Washed organic (ETH), and Sumatra Fair‐Trade Organic Takengon (SUM). These three origins were chosen to be representative of three important classes of postharvest processing. The ETH was “washed,” where the mucilage is removed via fermentation immediately after depulping; the ELS was “honey processed,” where some fruit pulp and mucilage remains on the parchment during drying; and the SUM was “wet‐hulled” as typical in Sumatra where the parchment is stripped from the bean prior to drying. These types of coffees are widely recognized to have very distinct flavor profiles (Illy & Viani, 1995).
The green coffees were roasted over the course of 3 days in January 2021, one origin per day, on a Probatino P5 (Probat GmbH, Emmerich am Rhein, Germany). Each coffee was roasted to three different levels, representing a typical “light,” “medium,” or “dark” roast as represented by percent weight loss from the green coffee as well as target score on the Agtron Gourmet Scale published by the SCA (Staub, 1995). Representative roast profiles and detailed roast metrics are provided in Supporting information Figure S1 and Table S1, respectively. After roasting, the beans were degassed for a week before being packed into vacuum‐sealed bags of 300 g each. The sealed bags were stored in a freezer at −20°C. Bags were removed and allowed to defrost for 24 h at room temperature in advance of brewing.
2.3. Brewing procedure
Coffee was ground immediately before each brew using a Mahlkönig Guatemala Lab Grinder (Mahlkönig USA, Durham, NC, USA) at grind size setting 4 with a median particle size of 972.01 ± 18.56 µm (see Liang et al., 2021 for grind size distribution). Nestlé pure life purified water with pH 7.46 was used for all brews (Nestlé Waters North America, 2019). Prior to brewing, the water was brought to room temperature (22°C) for both the 4 and 22°C brews. The 4°C brews used 22°C water but were immediately placed in the fridge after the water was added to the grounds. For the 92°C brews, water was heated to 92°C using a Bonavita 1.7‐L variable temperature electric kettle (Bonavita World, Woodinville, WA). A brew ratio of 5 was used for all brews, with 100 g of coffee grounds to 500 g of water (“Cold Brew System Brewing Guide,” 2020).
Each brew was carried out in a Toddy Cupping Kit using the supplied traditional paper filters (Toddy LLC., Loveland CO, USA). Three Toddy Cupping kits were used for each sample to brew a sufficient volume of coffee for analysis using a standard full‐immersion brew methodology (Figure 1). The paper filters were filled with 100 g of room‐temperature ground coffee, and the water of appropriate temperature was poured into the open filter bag. Then, the coffee grounds immersed in water were stirred by hand at approximately two rotations per second (approximate angular velocity of 12 radians per second) for a duration of 30 s to fully wet the grounds. Each brew continued, without further agitation, until an equilibrium concentration was reached as measured by sampling the TDS of the brew. For the hot brew, equilibrium was reached after about 1 h; for the room‐temperature brew, equilibrium was reached after approximately 12 h; for the fridge temperature brew, equilibrium was reached after approximately 24 to 36 h depending on roast level. The ambient temperature was controlled within ±1°C for the room‐temperature and fridge‐temperature brews. After reaching equilibrium, the filter bag of coffee grounds was removed and allowed to drain by gravity through a dripper back into the brew until it stopped dripping.
FIGURE 1.
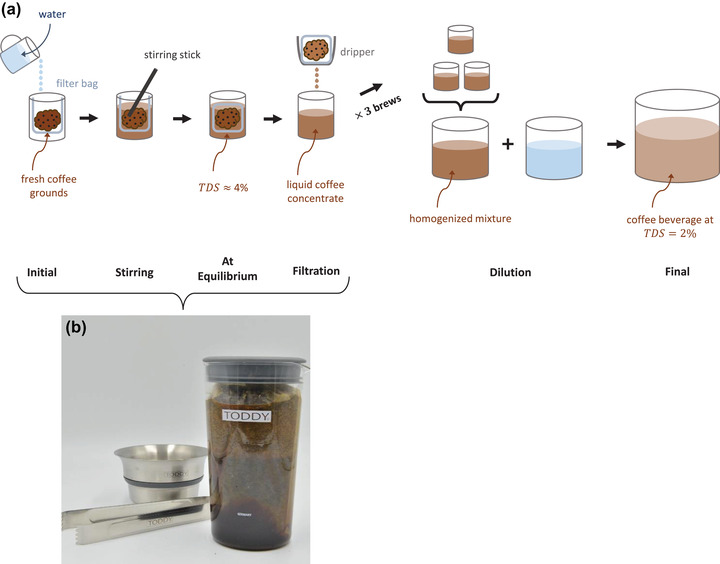
(a) Representative diagram of Toddy‐style full immersion brew process, with subsequent homogenization and dilution. (b) Photo of Toddy cupping system, with dripper and tongs at left
Each of the three cupping kits was then homogenized into one larger sample (to provide enough coffee for complementary sensory experiments not described here). The homogenized mixture was then diluted to 2% TDS for uniform analysis. The mass of the coffee liquid and the TDS were measured before and after dilution. The procedure was carried out in triplicate for each sample type, for a total of 3 origins × 3 roasts × 3 brew temperatures × 3 trial replicates = 81 samples (comprising 243 individual brews, homogenized across sets of three). Samples were stored in the refrigerator for approximately 48 h until colorimetric analysis.
2.4. TDS, pH, and titratable acidity measurements
The TDS of the coffee brew was measured at room temperature using a digital refractometer (VST, Inc.). Prior to experimental measurements, the refractometer was zeroed with distilled water. Calibration of the refractometer was carried out according to the procedure described by Liang et al. (2021). The pH of the brewed coffees samples after dilution was measured with a Mettler Toledo SevenCompact Duo S213 pH/Conductivity Meter (Mettler‐Toledo LLC). TA was then measured by adding 0.1 M NaOH dropwise from a burette while 50 mL sample of coffee was stirred, until reaching a pH of 8.24 ± 0.06. TA is expressed in mL NaOH/50 mL coffee.
2.5. L*a*b* measurements
Colorimetric analysis was performed on each diluted brew once it reached ambient temperature (22°C) after being stored in the refrigerator for approximately 48 h. Results are expressed on the C.I.E. L*a*b* scale L* (lightness), a* (red‐green value), and b* (yellow‐blue value) (Lawless & Heymann, 2010a). A 50 mL aliquot of each sample was transferred into a glass petri dish placed on top of white printer paper, and the L*a*b* values were measured. The L*a*b* values of the coffee beans and grounds were also measured. For color analysis, 50 g of coffee beans or grounds were placed in a glass petri dish atop a white piece of paper. Color analyses were carried out on the brew using a tristimulus colorimeter at a 2° observation angle and under D65 lighting (Konica Minolta CR 400 Chroma Meter, Minolta, Osaka, Japan). The instrument was standardized against a white tile before each measurement. Color was expressed on the C.I.E. L*a*b* scale. Three measurement replicates were carried out for each sample.
2.6. UV‐Vis measurements
To obtain the entire absorbance spectrum for each coffee sample, 1.5 mL of the diluted brew was analyzed in a Shimazdu PharmaSpec UV‐1700 spectrophotometer (Shimadzu, Kyoto, Japan). The instrument was calibrated and baselined prior to measurements. The absorbance spectrum was measured for each sample over the visible range (350–750 nm) of the electromagnetic spectrum. Three measurement replicates were carried out for each sample.
2.7. Data and statistical analysis
The L*a*b* values and UV‐Vis absorbance spectra were averaged over three measurement replicates within each trial replicate for a total of 9 measurements for each sample type. Variability between measurement replicates was very small—the coefficient of variation was less than 10%. Further statistical analyses of the three trial replicates were carried out using R version 4.0.2 (R Core Team, 2020). The L*a*b* values were analyzed using ANOVA, and then differentiated into groups using Fischer's LSD test with package agricolae. Additionally, the values for each sample were plotted in a 3D space using the package plot3Drgl and plot3d. The regression line in the 3D plot was calculated based on the principle axis of the point cloud using function prcomp(). The line was plotted as extending from the center of the principle component (PC) to either the minimum or maximum PC value times the loadings of the PC. The equation of the regression line is presented in Cartesian, two‐point format along with the direction vector. Package ggplot2 was used to graphically represent the L*a*b* values and absorbance spectra. Lastly, the L*a*b* values were converted to hexadecimal codes (Loncar, n.d.) to visually represent the tristimulus values.
3. RESULTS AND DISCUSSION
Photos of the coffee grounds showcase the difference in color among the three roast levels (Figure 2). Between the three origins (El Salvador, Ethiopia, and Sumatra) the color remained similar within the same roast level. The biggest variation of color came from the roast; as expected, light roasts were the lightest in color and dark roasts were the darkest.
FIGURE 2.
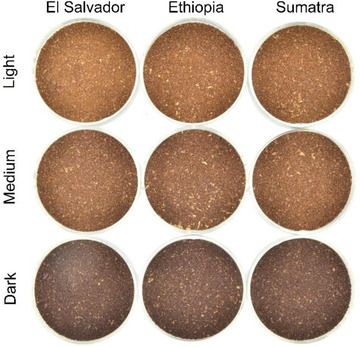
True‐color image with a natural white balance of the coffee grounds used in this study, part of the 3 × 3 × 3 factorial design. From left to right: El Salvador, Ethiopia, Sumatra. From top to bottom: light roast, medium roast, dark roast. Each sample of grounds is placed in a 4‐cm diameter glass petri dish
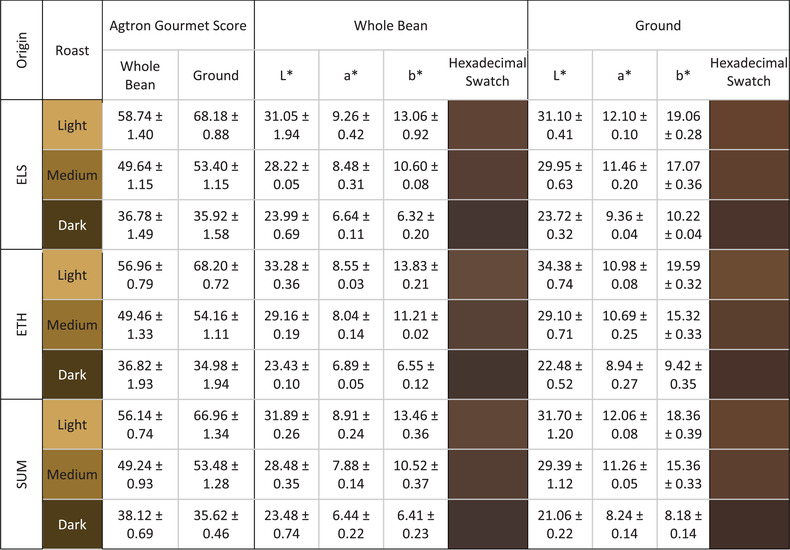
Quantification of the colors corroborates these qualitative impressions (Table 1). The Agtron Gourmet scores for whole beans were approximately 38 for dark roast, 48 for medium roast, and 58 for light roast, regardless of origin. Both the whole bean and the grounds were measured in the L*a*b* color space, and a representative hexadecimal swatch is included in Table 3.1 next to the tristimulus values; this swatch is a visual representation of the L*a*b* values, and we emphasize that the visual representation might differ on different computer monitors or printouts. Consistent with the qualitative impressions, the light roast for each origin had the highest L*a*b* values, with L* near 31 for light roasts, near 28 for medium roasts, and near 23 for dark roasts, again regardless of origin. Similar decreases in a* and b* are observed with roast level. Separate measurements of the ground coffee exhibited qualitatively similar trends as the whole beans, albeit with significantly higher values than in the whole beans (p < 0.1, < 0.001, < 0.01 for L*, a*, and b*, respectively), except for dark roasts which tended to be more uniform.
TABLE 1.
Agtron and L*a*b* values of whole roasted beans and coffee grounds. Values reported as mean ± one standard deviation, with n = 5 measurement replicates for Agtron Gourmet Score (Staub, 1995) and n = 3 measurement replicates for L*a*b* values
|
Colors in “Roast” column are only illustrative; colors in “Hexadecimal Swatch” columns correspond to the equivalent L*a*b* values.
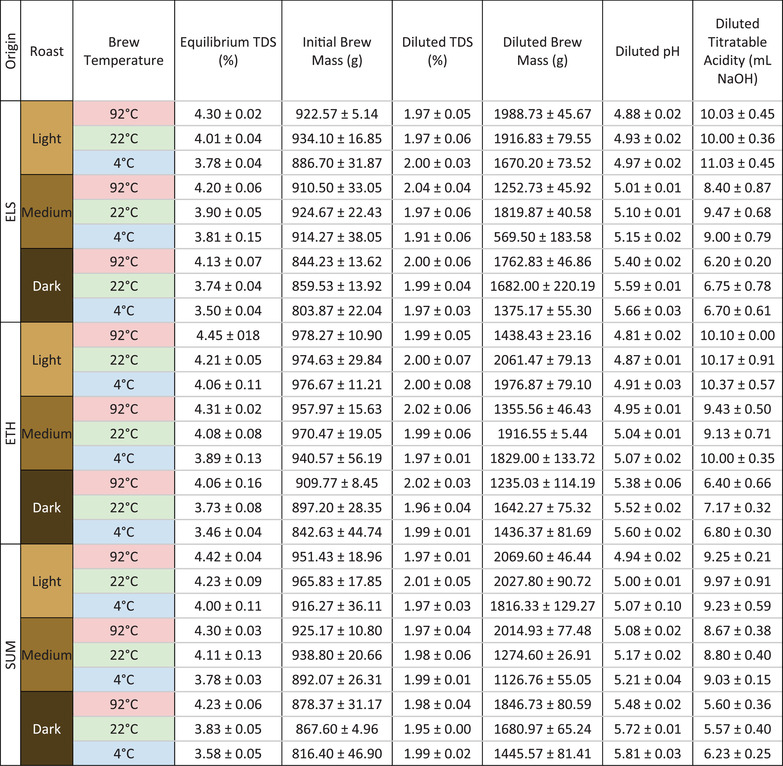
Turning attention to the brewed coffee, the physical characteristics of each brew are outlined in Table 2, including the equilibrium TDS, the brew mass (i.e., the mass of brewed coffee obtained following filtration), the equilibrium pH, and the equilibrium TA. Also tabulated are the measured TDS following dilution to a target of 2% TDS and the final brew mass after dilution.
TABLE 2.
Physical and chemical measurements for each of the brews, shown as mean ± one standard deviation for n = 3 trial replicates
|
Color values in “Roast” and “Brew Temperature” columns are illustrative only.
In general, hot temperature brews tended to have higher equilibrium TDS than their room or fridge temperature counterparts (Figure 3). The roast level also strongly influenced equilibrium TDS; dark roasts had slightly lower TDS values than light or medium roast at all temperatures (Figure 3a). Brew temperature had less impact on the delivered mass (Figure 3b), with the darker roast levels yielding less brew, presumably because of increased retention of liquid within the spent grounds. Consistent with prior observations (Batali et al., 2021), roast level also strongly influenced the pH and TA, where brews of the same roast had similar pH levels and total TA regardless of origin. Dark roasts were the least acidic, and light roasts were the most acidic (Figure 3c and d). To control for any effect differing levels of TDS on the color, all brews were diluted to a target of 2% TDS; as indicated in Table 2, when averaged over all samples the diluted TDS was 1.98% with a standard deviation of 0.04%.
FIGURE 3.
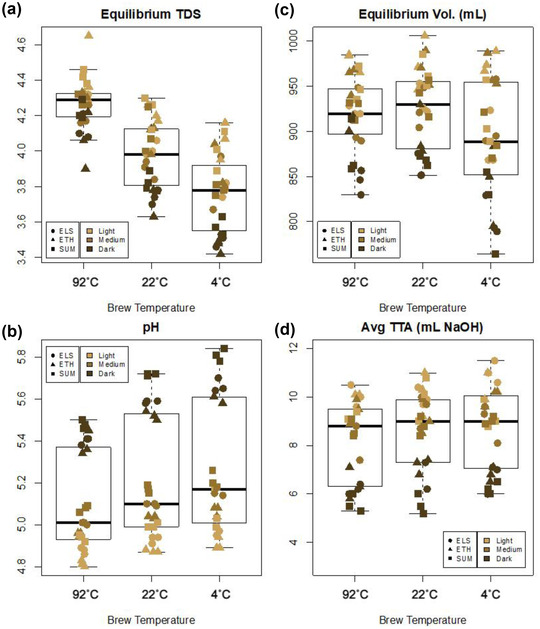
Brew characteristics of the 81 different brews, separated by brew temperature. The equilibrium TDS (a) and equilibrium brew mass (b), were measured prior to dilution. The pH (c) and titratable acidity (d) were measured after dilution
After taking care to dilute the brews to the same TDS, it was readily apparent that the brews varied significantly in color. Figure 4 shows representative photos of the brews when poured into glass test tubes or coffee mugs. These six samples (of the 27 total sample types) were chosen to represent the spectrum of color present in the coffee brews. Qualitatively, the lightest brew, Sumatra light roast brewed at 22°C, looked orange in appearance, especially compared to the brown‐black of the El Salvador dark roast brewed at 92°C. In general, the cold brews (22 and 4°C) were more reddish in appearance than the hot (92°C) brews, which were browner. Additionally, the darker the roast, the darker the color of the brew, as shown in the comparison between a light, medium, and dark roast brewed, all brewed at 92°C (tubes 1–3, Fig. 4a).
FIGURE 4.
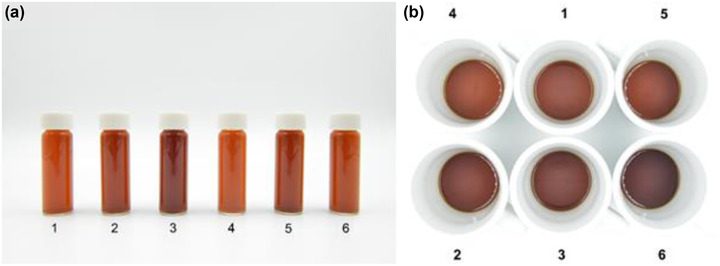
True color images, using a natural white balance, of six representative brews placed as (a) 5 mL in glass vials or (b) 20 mL in white ceramic mugs. Number codes indicate: 1: ETH Light 92˚C; 2: ELS Medium 92˚C; 3: ELS Dark 92˚C; 4: SUM Light 22˚C; 5: ETH Medium 4˚C; 6: SUM Dark 4˚C
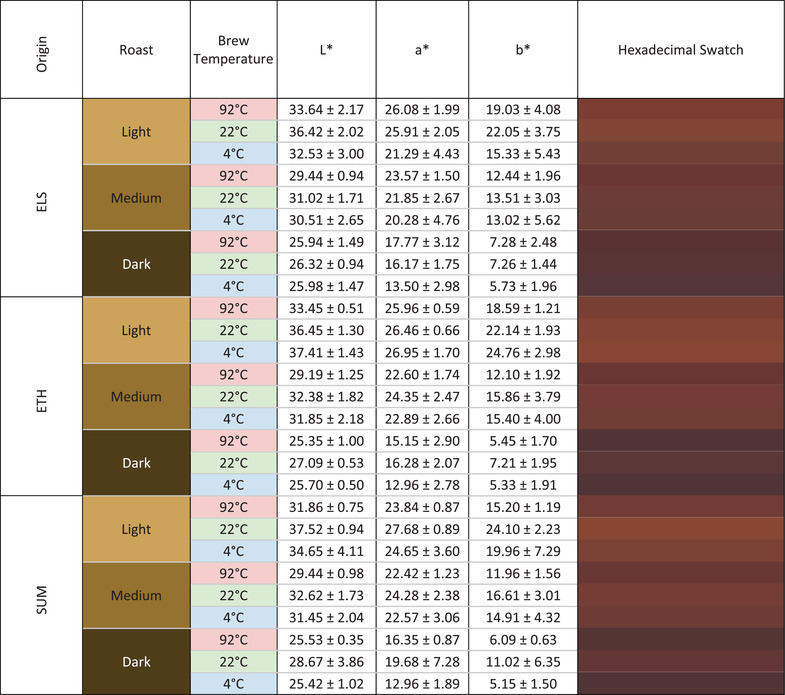
Notably, the brewed coffee exhibited a different color than the coffee grounds from which it was derived, with the difference depending on roast and brew temperature (Table 3). Across roasts and temperatures, the brews were redder (higher a* value) than the grounds themselves. Moreover, both roast level and brew temperature influenced the color of the brew, as shown in the hexadecimal swatches for each brew.
TABLE 3.
L*a*b* values and representative color swatch by origin, roast, and temperature, presented as mean ± one standard deviation of three trial replicates
|
Colors in “Roast” and “Brew Temperature” columns are illustrative only; colors in the “Hexadecimal Swatch” column correspond to the equivalent L*a*b* values.
To further examine the differences in tristimulus values among brew temperatures, the L*a*b* values were graphed for each origin, roast level, and brew temperature. Increased roast level led to decreases in L*a*b* values across origins and brew temperatures. Differences between brew temperature were most common in light roasts (Fig. 5a‐c,g‐i). Within the light roasts, there was at least one brew temperature that had a significantly different L* value (Fig. 5a‐c). Across both roast levels and brew temperatures, a* values had the fewest significant differences (Fig. 5d‐f). In dark roasts, differences between brew temperatures decreased as the tristimulus values themselves decreased. Hot brews tended to have the lowest tristimulus values. Interestingly, Sumatra room temperature brews had higher tristimulus values than their hot or fridge counterparts for all three roasts.
FIGURE 5.
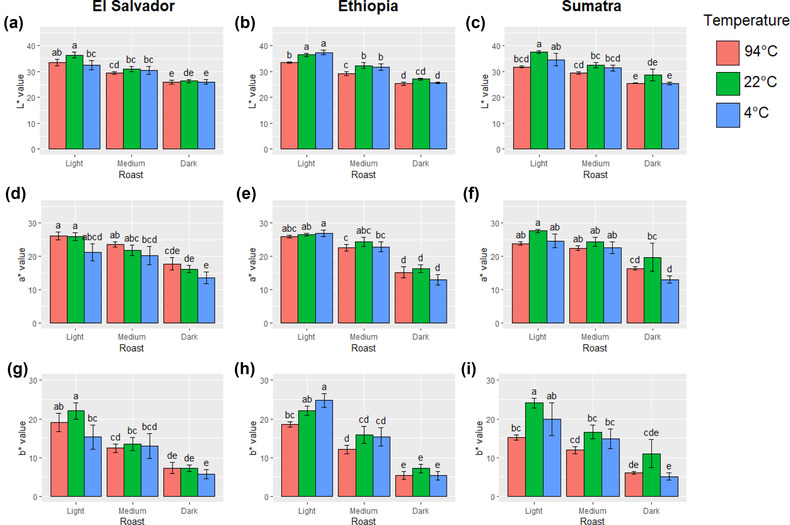
L*a*b* values for each origin, roast, and temperature. Different lowercase letters (a‐e) denote statistically significant different groups. Brews with the same lowercase letter (a‐e) are not significantly different
Because the tristimulus values represent a three‐dimensional color space, the values for each of the brews can be graphed in three dimensions as well. In Figure 6, each data point within the box represents the L*a*b* values for that brew, and the color of the data point is the is representative of roast level (light, medium, or dark) while the color of the text is representative of brew temperature (4, 22, and 92°C) (Figure 6). Each of the points can be grouped two ways—by roast and by brew temperature. Brews of the same roast are clustered together, with light roasts having the highest L*a*b* values and dark roasts having the lowest. Brews with different brew temperatures are dispersed evenly throughout—brew temperature does not have a clear trend across both origins and roast levels on the tristimulus values.
FIGURE 6.
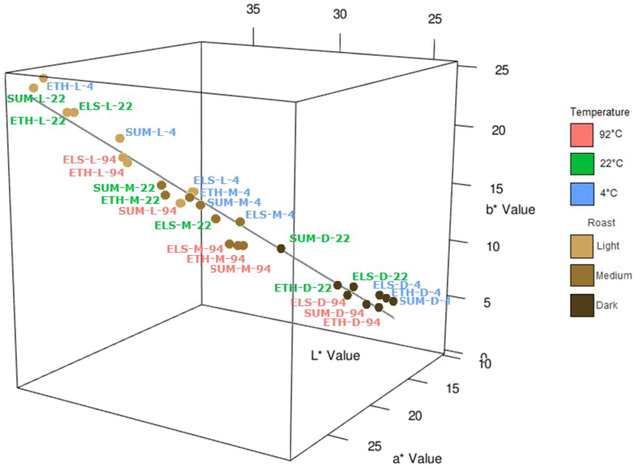
Three‐dimensional plot of the L*a*b* values for each sample type grouped by roast and brew temperature. The black line denotes the linear best fit (cf. Equations (1), (2), (3)). See also Supporting information movie 1
The color data points follow a line in three‐dimensional space given by the three parametric equations:
| (1) |
where t represents distance along the line from the center point. Solving for variable t gives the following equivalent set of parametric equations:
| (2) |
Since variable t will be equivalent in all three equations, the three parametric equations can be set equal to give a symmetric form:
| (3) |
In other words, the L*a*b* values are linked in a positive linear relationship; as one of the values decreased, so did the other two. Plotting the tristimulus values in three‐dimensional space also gives insight into the difference in color between brews, based on the distance between the points. For example, Ethiopia light roast brewed at 4°C had the largest absolute difference in tristimulus values from Sumatra dark roast brewed at 4°C, placing the two brews furthest apart in three‐dimensional space (Figure 6). Additionally, Sumatra light roast brewed at 92°C was more like a Sumatra medium 4°C brew than a Sumatra light roast at 4°C (Figure 6); in other words, brewing at a hot temperature resulted in a color more indicative of medium roast than light roast.
Last, the absorbance spectra between 350 and 750 nm of each of the brews were examined (Figure 7). With the exception of El Salvador light and medium roasts, the hot (92°C) brews had separate UV‐vis absorbance curves than the room (22°C) or fridge (4°C) brews. Because the 22 and 4°C brews had absorbance spectra that are farther left on the visible spectrum, they appeared more reddish in color than the 92°C brews. The closeness (or even overlap) of the 22 and 4°C brews suggest that they were more similar in appearance compared to the 92°C brews.
FIGURE 7.
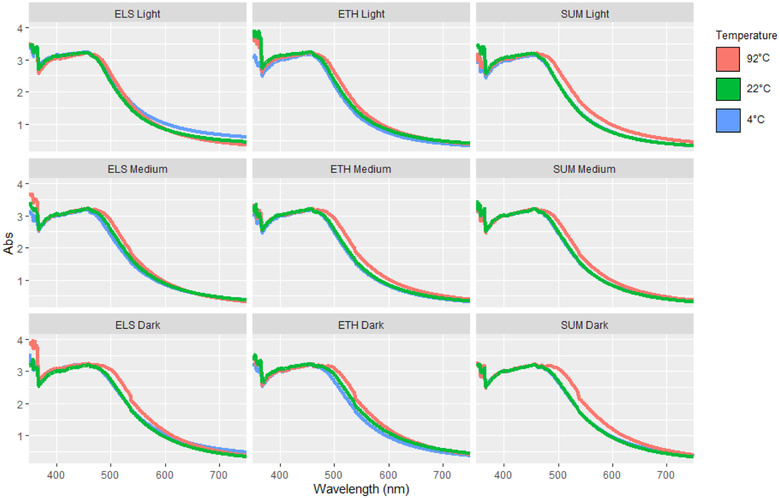
UV‐Vis absorbance spectra from 350 to 750 nm
The color of the coffee beverage is strongly influenced not only by roast level, but by brew temperature as well, especially within light and medium roast levels. Based on previous work linking increased roasting with darker bean colors (Da Porto et al., 1991; Nicoli et al., 1997), it is perhaps unsurprising that roast level would be a major factor in the final color of the coffee brew. However, it is more surprising that brew temperature would also affect the color of the coffee brew. Understanding how these two factors ultimately impact the final beverage can lead to opportunities to brand and market the color of the coffee by manipulating roast level and brew temperature.
The photos of the grounds and brews provide important insight into how color is extracted into the brew. Even though the grounds for each roast level look almost identical (Figure 2), the color of the coffee brew itself does not follow the same pattern. The grounds provide a foundational layer of color that is then altered during the extraction process, based on origin and brew temperature. Similarly, the color of the grounds is drastically different than the color of the coffee brew, regardless of origin and temperature. In other words, brewing coffee grounds of a certain color does not yield a direct translation of the color from grounds to cup. Moreover, the photo of the coffee brew in the mugs (Figure 4b) highlights the visual disparity that consumers may face when sampling different beverages. The color of the coffee brew can serve as an indicator for brew strength (Pangborn, 1982), but also for flavor compounds that are generated during roasting (Lawless & Heymann, 2010a); such large differences in color can affect the perceived sensory characteristics.
However, color differences are usually measured in a subjective manner (Anisa at el., 2017; dos Santos Scholz et al., 2018; Kalschne et al., 2019; Pangborn, 1982) because it is a rather subjective sensory modality. Measuring the appearance and color of objects is traditionally performed by instruments due to the wide variation in human vision and the tricky nature of color itself (Lawless & Heymann, 2010a). The color can be affected by composition of the object itself, the spectral illumination on the object, and the sensitivity of the viewer's eyes (Lawless & Heymann, 2010a). Performing colorimetric analysis with instruments depends solely on the composition of the object, removing any variations in illumination or sensitivity of the viewer's eyes, producing reliable and objective measurements of the object's color. Qualitative judgments about the difference in color may give insight into the perception of the coffee product, but instrumental analysis is needed to concretely find differences between products.
Quantitatively, these differences in color are translated into the L*a*b* values for both the coffee beans, grounds, and the coffee brew. The tristimulus values for the coffee grounds (Table 2) follow the same pattern as previously discovered; increased roast level leads to lower L*a*b* values (Bicho et al., 2012; Da Porto et al., 1991; Illy & Viani, 1995; Nicoli et al., 1997). Dark roasts, which approach the color black as roasting continues, will have the lowest tristimulus values as there is an increasing absence of color (Lawless & Heymann, 2010a). This is intuitive for the L* measure, which is determined by lightness, but it also applies to a* (greenness‐redness) and b* (blueness‐yellowness). As the color of the bean approaches black, a* and b* will approach a value of 0. Moreover, it becomes harder to detect differences in color the closer to black the values become, which is why dark roasts tended to have fewer significant differences. Last, higher Agtron Gourmet readings and L*a*b* values in the grounds when compared to the beans can be explained by the process of grinding that homogenizes the mixture and exposes the less roasted interior of the bean (Illy & Viani, 1995).
Visualizing the tristimulus values in three‐dimensional space led to a very interesting, strongly linear relationship between the L*a*b* values across the roast levels. Equation 1, which links each value together, implies that the color of a coffee beverage can be predicted a priori for given coffee grounds based on the roast level and anticipated brew temperature.
The color of the coffee beverage can have profound effects on perceived sensory characteristics. Reddish colored beverages can taste less bitter and sweeter than those with lower intensities of red coloring (Johnson & Clydesdale, 1982; Maga, 1974), although it is unclear whether the color differences observed here will have as large an effect. Nonetheless, a plausible hypothesis is that the differences in color between different brewing temperatures may affect the perceived flavor of the beverage, since the 4 and 22°C brews tended to be redder in color (Figs. 4 and 6). Sensory analysis of coffee is sometimes performed with panelists in sensory booths illuminated with red light to minimize the impact of sample color perception (Batali, Frost, et al., 2020; Batali, Ristenpart, et al., 2020; Frost et al., 2020), but most often coffee is cupped under regular illumination. Further research is necessary to elucidate how brew color affects flavor perception of coffee.
It is unclear how the chemical compositions for different roast levels and brew temperatures affect the final observed color. It is well established that the brown color in roasted coffee is a result of melanoidins produced during the roasting process as well as the caramelization of sucrose (Bradbury, 2001; Illy & Viani, 1995; Macrae, 1985). Melanoidins are polymeric products of the Maillard reaction and can be separated into three classes based on their molecular weight: low, intermediate, and high (Bekedam et al., 2008). The amount of each class of melanoidin differs by roast level; the darker the roast, the higher the percentage of high molecular weight melanoidins (Bekedam et al., 2008). Increased levels of high molecular weight melanoidins could account for the darker colors of the dark roast coffee brews. Since melanoidins are water soluble, the concentration and composition of melanoidins present in the roasted coffee can have a significant impact on coffee beverage color. Brown pigmentation also comes from the caramelization of sucrose, which occurs whenever the roasting temperature reaches above 130˚C (Trugo, 1985). The resulting product is a water‐soluble heterocyclic compound, which can then polymerize to form the Maillard‐like brown pigments (Tressl et al., 1998; Bradbury, 2001). The inclusion of two different classes of colored compounds (melanoidins and caramels) hints at the possibility of differential extraction across different brew temperatures. The size and solubility of these compounds would affect their overall extraction into the brew, accounting for the changes in color. The slight differences in equilibrium TDS that we observe (Fig. 3a) suggest that differences in the size and solubility of colored compounds have an effect on color; higher equilibrium TDS levels should yield a darker color. Here, we performed only simple chemical measurements of pH and TTA (Fig. 3c and d). Additionally, it remains unclear how the chemical composition of the coffee brew changes with time, and if, subsequently, the color changes as well. Further research into the chemical composition into coffees brewed at the same temperature would elucidate why roast level and brew temperature influence the color of the coffee liquid.
The importance of color as an indicator of coffee quality and its role in sensory perception highlights possible marketing and branding opportunities. Harnessing the power of roast level and brew temperature to control the color of the final coffee liquid creates a novel approach to make unique coffee products.
4. CONCLUSIONS
Our systematic analysis of the color of different coffee brews yielded insights regarding an underappreciated aspect of coffee extraction. Perhaps unsurprisingly, coffee beans roasted to different colors yielded brews of different colors. More surprisingly, use of “cold” brewing temperatures (4 or 22°C) led to a beverage that was much more reddish in color than the typical brown‐black color of hot (92°C) brewed coffee. Our finding that the color of the grounds is not directly translated into the brew, and that the brew color varies significantly based on brew temperature and origin, does complicate the choice of coffee and brewing parameters to achieve brewed coffee of a desired color. However, the results also offer additional opportunity for branding and marketing of cold brew, as “reddish” in color. Additionally, differential extraction of chemical species could be behind those color differences, thus, warranting the need for further research into the molecules and the physical and chemical processes that affect coffee color.
AUTHOR CONTRIBUTIONS
Sara E. Yeager: Data curation; Formal analysis; Investigation; Writing–original draft; Writing–review & editing. Mackenzie E. Batali: Investigation; Writing–review & editing. Lik Xian Lim: Investigation; Writing–review & editing. Jiexin Liang: Investigation; Writing–review & editing. Juliet A. Han: Investigation; Supervision; Writing–review & editing. Ashley N. Thompson: Conceptualization; Investigation; Writing–review & editing. Jean‐Xavier Guinard: Conceptualization; Funding acquisition; Project administration; Supervision; Writing–review & editing. William D. Ristenpart: Conceptualization; Funding acquisition; Project administration; Supervision; Writing–original draft; Writing–review & editing.
CONFLICT OF INTEREST
We have no conflict of interest to disclose.
Supporting information
Table S1: Roast profile details for each sample type, including bean density, time of first crack, duration of roast, development time, development time ratio, start and end temperature, and percent weight loss.
Figure S1: Roast curves for each of the 9 roast types, shown as increase in bean temperature (˚C) over time. A) El Salvador origin roasts. B) Ethiopia origin roasts. C) Sumatra origin roasts.
Movie S1: Rotation of three‐dimensional plot of the L*a*b* values for each sample type grouped by roast and brew temperature. The black line denotes the linear best fit (cf. equations 1‐3)
Supplementary Material
Supplementary Material
ACKNOWLEDGMENTS
We thank Julia Leach for advice and suggestions about methods of cold brewing. We also thank Dr. Mike Clegg in the UC Davis FST Teaching Lab for use of the facilities.
Yeager, S. E. , Batali, M. E. , Lim, L. X. , Liang, J. , Han, J. , Thompson, A. N. , Guinard, J.‐X. , & Ristenpart, W. D. (2022). Roast level and brew temperature significantly affect the color of brewed coffee. J Food Sci, 87, 1837–1850. 10.1111/1750-3841.16089
Integrated Food Science
Funding information
We thank the Coffee Science Foundation for supporting this research, with underwriting from Toddy, LLC.
REFERENCES
- Anisa, A. , Solomon, W. K. , & Solomon, A. (2017). Optimization of roasting time and temperature for brewed hararghe coffee (Coffea Arabica L.) using central composite design. International Food Research Journal, 24, 2285–2294. [Google Scholar]
- Batali, M. E. , Cotter, A. R. , Frost, S. C. , Ristenpart, W. D. , & Guinard, J.‐X. (2021). Titratable acidity, perceived sourness, and liking of acidity in drip brewed coffee. ACS Food Science & Technology. 10.1021/acsfoodscitech.0c00078 [DOI] [Google Scholar]
- Batali, M. E. , Frost, S. C. , Lebrilla, C. B. , Ristenpart, W. D. , & Guinard, J.‐X. (2020). Sensory and monosaccharide analysis of drip brew coffee fractions versus brewing time. Journal of the Science of Food and Agriculture, 100(7), 2953–2962. 10.1002/jsfa.10323 [DOI] [PubMed] [Google Scholar]
- Batali, M. E. , Ristenpart, W. D. , & Guinard, J.‐X. (2020). Brew temperature, at fixed brew strength and extraction, has little impact on the sensory profile of drip brew coffee. Scientific Reports, 10(1), 16450. 10.1038/s41598-020-73341-4 [DOI] [PMC free article] [PubMed] [Google Scholar]
- Bekedam, E. K. , Loots M. J., Schols H. A., Van Boekel M. A. J. S., & Smit G.. (2008). Roasting effects on formation mechanisms of coffee brew melanoidins. Journal of Agricultural and Food Chemistry, 56(16), 7138–7145. [DOI] [PubMed] [Google Scholar]
- Bicho, N. C. , Leitão, A. E. , Ramalho, J. C. , & Lidon, F. C. (2012). Use of colour parameters for roasted coffee assessment. Food Science and Technology, 32(3), 436–442. 10.1590/S0101-20612012005000068 [DOI] [Google Scholar]
- Bradbury, A. G. W. (2001). Acids in coffee. In Clarke R., and Vitzthum O. G., eds. Coffee: recent developments (pp. 18–32). John Wiley & Sons. [Google Scholar]
- Cangussu, L. B. , Rodrigues, C. G. , Ribeiro, M. C. , Dutra, V. L. M. , Amaral, E. F. G. , & Fante, C. A. (2020). Projective mapping: potential tool for sensory evaluation of coffees for industrial application. Semina: Ciências Agrárias, 41(5), 1557–1566. 10.5433/1679-0359.2020v41n5p1557 [DOI] [Google Scholar]
- Da Porto, C. , Nicoli, M. C. , Severini, C. , Sensidoni, A. , & Lerici, C. R. (1991). Study on physical and physico‐chemical changes in coffee beans during roasting Note 2. Italian Journal of Food Science, 3, 197–207. [Google Scholar]
- dos Santos Scholz, M. B. , Kitzberger, C. S. G. , Durand, N. , & Rakocevic, M. (2018). From the field to coffee cup: Impact of planting design on chlorogenic acid isomers and other compounds in coffee beans and sensory attributes of coffee beverage. European Food Research and Technology = Zeitschrift Fur Lebensmittel‐Untersuchung Und ‐Forschung. A, 244(10), 1–10. 10.1007/s00217-018-3091-7 [DOI] [Google Scholar]
- Dmowski, P. , & Dąbrowska, J. (2014). Comparative study of sensory properties and color in different coffee samples depending on the degree of roasting. Scientific Journal of Gdynia Maritime University, 84, 28–36. [Google Scholar]
- Ferreira, J. B. , Bassotto, L. C. , & Castro, L. G. Jr. (2020). Attributes, values and traditional coffee consumption behavior in Brazil. Espacio Abierto, 29(4), 294–313. [Google Scholar]
- Frost, S. C. , Ristenpart, W. D. , & Guinard, J.‐X. (2020). Effects of brew strength, brew yield, and roast on the sensory quality of drip brewed coffee. Journal of Food Science, 85(8), 2530–2543. 10.1111/1750-3841.15326 [DOI] [PubMed] [Google Scholar]
- Illy, A. , & Viani, R. (1995). Espresso coffee: The science of quality. Academic Press. [Google Scholar]
- Johnson, J. , & Clydesdale, F. M. (1982). Perceived sweetness and redness in colored sucrose solutions. Journal of Food Science, 47(3), 747–752. 10.1111/j.1365-2621.1982.tb12706.x [DOI] [Google Scholar]
- Kalschne, D. L. , Biasuz, T. , De Conti, A. J. , Viegas, M. C. , Corso, M. P. , & Benassi, M. de, T. (2019). Sensory characterization and acceptance of coffee brews of C. arabica and C. canephora blended with steamed defective coffee. Food Research International (Ottawa, Ont.), 124, 234–238. 10.1016/j.foodres.2018.03.038 [DOI] [PubMed] [Google Scholar]
- Lawless, H. T. , & Heymann, H. (2010a). Principles of good practice. In Sensory evaluation of food (section 3.4). Springer. 10.1007/978-1-4419-6488-5_3 [DOI] [Google Scholar]
- Lawless, H. T. , & Heymann, H. (2010b). Color and appearance. In Sensory evaluation of food (pp. 283–301). Springer. 10.1007/978-1-4419-6488-5_12 [DOI] [Google Scholar]
- Lee, M. J. , Kim, S. E. , Kim, J. H. , Lee, S. W. , & Yeum, D. M. (2013). A study of coffee bean characteristics and coffee flavors in relation to roasting. Journal of the Korean Society of Food Science and Nutrition, 42(2), 255–261. 10.3746/jkfn.2013.42.2.255 [DOI] [Google Scholar]
- Liang, J. , Chan, K. , & Ristenpart, W. (2021). An equilibrium desorption model for the strength and extraction yield of full immersion brewed coffee. Scientific Reports, 11(1), 6904. 10.1038/s41598-021-85787-1 [DOI] [PMC free article] [PubMed] [Google Scholar]
- Loncar, S. (n.d.). Color picker and converter. Colorizer. http://colorizer.org/
- Macrae, R. (1985). Nitrogenous components. In Clarke R. J., and Macrae R., eds. Coffee: volume 1: chemistry (pp. 115‐152). Springer. [Google Scholar]
- Maga, J. A. (1974). Influence of color on taste thresholds. Chemical Senses, 1(1), 115–119. 10.1093/chemse/1.1.115 [DOI] [Google Scholar]
- Mazzafera, P. , Guerreiro Filho, O. , & Carvalho, A. (1988). A cor verde do endosperma do café. Bragantia, 47(2), 159–170. [Google Scholar]
- Nestlé Waters North America, Inc. , (2019). Nestlé Pure Life® 2019. Water Analysis Report.
- Nicoli, M. C. , Anese, M. , Manzocco, L. , & Lerici, C. R. (1997). Antioxidant properties of coffee brews in relation to the roasting degree. LWT—Food Science and Technology. 30(3), 292–297. [Google Scholar]
- Pangborn, R. M. (1982). Influence of water composition, extraction procedures, and holding time and temperature on quality of coffee beverage. Lebensmittel‐Wissenschaft und ‐Technologie, 15, 161–168. [Google Scholar]
- R Core Team . (2020). R: A language and environment for statistical computing. R Foundation for Statistical Computing. https://www.R‐project.org/ [Google Scholar]
- Sacchetti, G. , Di Mattia, C. , Pittia, P. , & Mastrocola, D. (2009). Effect of roasting degree, equivalent thermal effect and coffee type on the radical scavenging activity of coffee brews and their phenolic fraction. Journal of Food Engineering, 90(1), 74–80. [Google Scholar]
- Staub, C. (1995). Agtron/SCAA roast classification. Color disk system. Specialty Coffee Association of America. [Google Scholar]
- Toddy . Cold brew system brewing guide. (2020). https://toddycafe.com/downloads/toddy_retail_instructions.pdf
- Tressl, R. , Wondrak, G. T. , Garbe, L. A. , Krüger, R. P. , & Rewicki, D. (1998). Pentoses and hexoses as sources of new melanoidin‐like Maillard polymers. Journal of Agricultural and Food Chemistry, 46(5), 1765–1776. [DOI] [PubMed] [Google Scholar]
- Trugo, L. C. (1985). Carbohydrates. In Clarke R. J. and Macrae R., eds. Coffee: volume 1: chemistry (pp. 83–114). Springer. [Google Scholar]
Associated Data
This section collects any data citations, data availability statements, or supplementary materials included in this article.
Supplementary Materials
Table S1: Roast profile details for each sample type, including bean density, time of first crack, duration of roast, development time, development time ratio, start and end temperature, and percent weight loss.
Figure S1: Roast curves for each of the 9 roast types, shown as increase in bean temperature (˚C) over time. A) El Salvador origin roasts. B) Ethiopia origin roasts. C) Sumatra origin roasts.
Movie S1: Rotation of three‐dimensional plot of the L*a*b* values for each sample type grouped by roast and brew temperature. The black line denotes the linear best fit (cf. equations 1‐3)
Supplementary Material
Supplementary Material