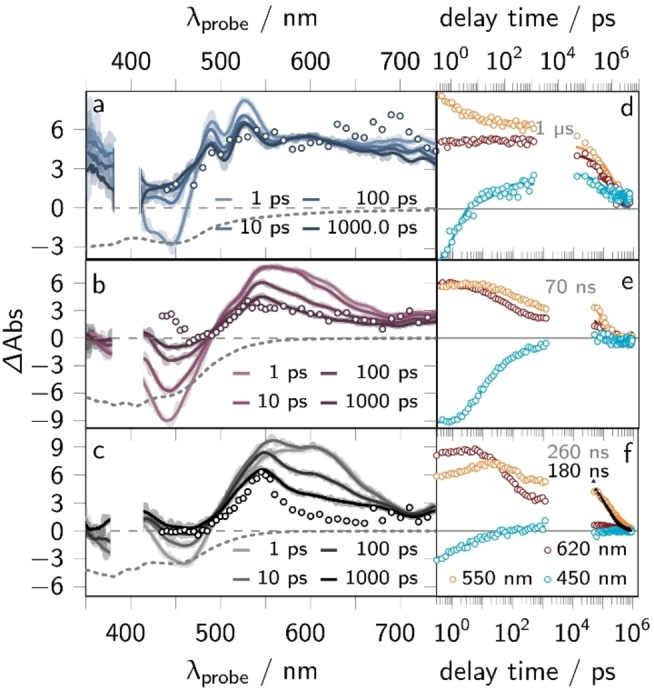
Figure 4.

fs‐ and ns‐transient absorption (TA) data, i.e., transient spectra at selected delay times and kinetic traces at certain probe wavelengths (450, 500 and 620 nm), of Ru (a and d), RuH+ (b and e) and RuH2 (c and f) in acetonitrile. The fs‐TA spectra are shown as solid lines at selected delay times (a–c) and the spectrum of the long‐lived state (see gray numbers in panel d–f, i.e., the lifetime of the 3ππ* states) is represented by symbols. The black symbols in panel f show the emission kinetics (ns‐Em) of Ru (summed kinetics between 500 and 800 nm). The respective emission lifetime is given in black. The fs‐ and ns‐TA (and ns‐Em) data was collected upon 400 nm (0.4 mW) or 420 nm (0.5 mW) excitation, respectively (excitation density of 5 %).
