Figure 2.
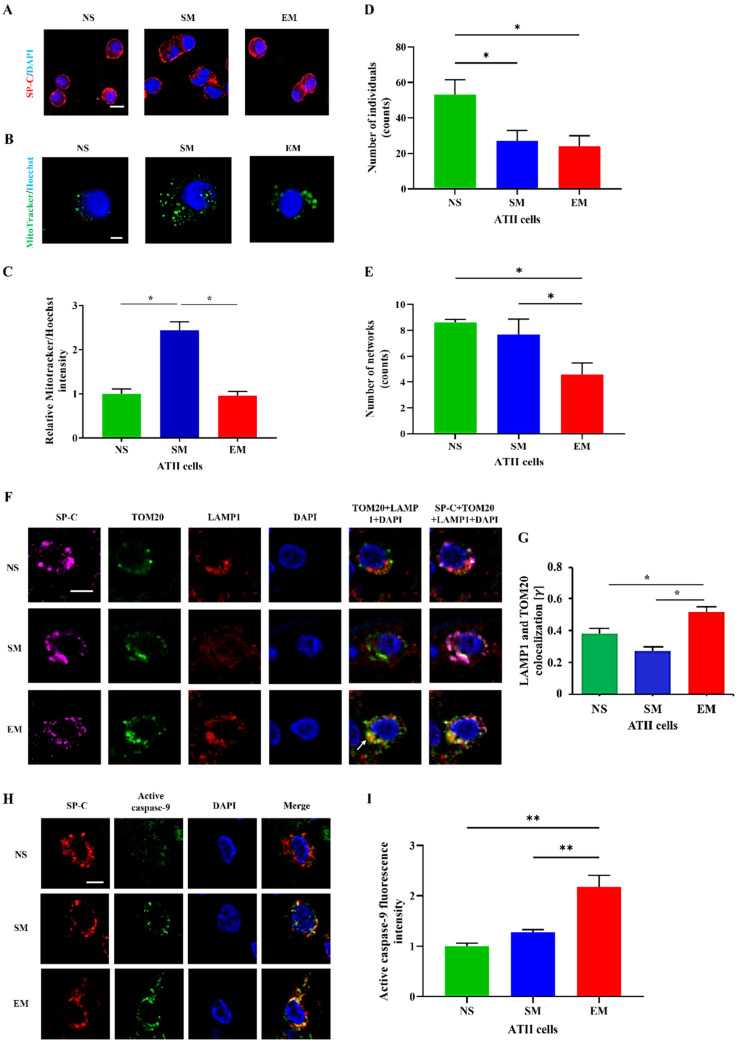
Human primary ATII cell purity and mitochondrial amount. (A) ATII cells were isolated from lungs obtained from nonsmokers (NS), smokers (SM), and emphysema patients (EM). Cytospins of freshly isolated ATII cells were stained using SP-C and DAPI (immunofluorescence; scale bar, 10 µm). (B) Mitochondrial amount was determined using MitoTracker dye and a confocal fluorescence microscope (scale bar, 5 μm). (C) Quantification is also shown. The number of individuals (D) and networks (E) of mitochondrial structures were quantified using MitoTracker staining. (F) Co-localization of mitochondrial protein TOM20 (green) with LAMP1 (red) in ATII cells using confocal microscopy (scale bar, 10 μm). (G) Quantification is shown. (H) Active caspase 9 expression (green) in ATII cells identified by SP-C antibody (red) in lung tissue sections by immunohistofluorescence (scale bar, 10 µm). (I) Quantification of active caspase 9 fluorescence intensity is shown. Data are shown as means ± s.e.m (N = 3–4 per group; * p < 0.05, ** p < 0.01).

