

Abstract
Purpose
Radiochromic material used in recent commercial films has been suggested as a candidate for in vivo dosimetry because of its dose sensitivity, real‐time response, and atomic composition. It was observed that its sensitive material, lithium pentacosa‐10,12‐diynoate (LiPCDA), can have two distinct forms, with main absorbance peaks at ∼635 and ∼674 nm. The spectrum of the latter is similar to that of pentacosa‐10,12‐diynoic acid (PCDA) used in the commercial predecessor, obtained through desiccation of the commercial film. Water was suggested to be a part of the crystal structure and thus its presence or absence would affect dosimetric parameters. The objective of this study is to: (a) investigate how desiccated commercial films compared to the native form in terms of macroscopic crystal structure, dose–response, signal linearity, and post‐exposure kinetics; (b) demonstrate proof‐of‐concept that the two versions can be combined into one optical dosimeter and measured simultaneously.
Methods
Commercial radiochromic film, EBT‐3, was desiccated for 10 days at 45°C. Using a 6 MV LINAC beam and standard setup of 100 Source to Axis Distance (SAD), 10 cm × 10 cm field size, and 1.5 cm depth, commercial and desiccated films were irradiated to 50, 100, 200, 500, 1000, 2000, 3000 cGy and the latter to 4000, 5000, and 7000 cGy. A custom phantom equipped with optical fibers for real‐time read‐out was used for all measurements. Absorbance spectra were collected at ∼1 Hz before, during, and after irradiation. Data were collected for ∼1 h after the end of irradiation for 200 cGy experiments. The radiation‐induced change in optical density (∆OD) was calculated with a 10 nm band around the primary absorbance peak. The post‐exposure percent optical density change was calculated and compared to ∆OD at the end of irradiation. Both commercial and desiccated films were also irradiated and measured simultaneously as proof‐of‐concept for using two materials within one optical path. For electron microscopy imaging, active materials from commercial and desiccated films were imaged on a scanning electron microscope at an accelerating voltage of 10 kV.
Results
Scanning electron microscope images showed that desiccated film was similar in topographical structure to the commercial EBT‐3 form. It maintained a non‐linear ∆OD with dose but resulted in ∼1/3 signal compared to the commercial film. Evaluation of post‐exposure response showed significantly lower percent increase in ∆OD for desiccated film initially, with no statistically significant difference at 1 h after the end of irradiation. Combining both films and simultaneously measuring their absorbance illustrated that the two absorbance peaks were identifiable and resolvable to allow for an independent determination of dose from each.
Conclusions
Water is implicated in the crystal structure of the EBT‐3 radiochromic film, with its removal through desiccation affecting both dosimetric and spectroscopic characteristics of the material. The two forms of radiochromic material (with and without water) are spectrally resolvable allowing for independent dose determination from each, opening up possibilities for dose measurements at different locations along a single fiber.
Keywords: absorption spectroscopy, radiation dose measurement devices, radiochromic film
1. INTRODUCTION
Over the last two decades, radiotherapy treatments have become increasingly sophisticated and complex due to advances in technology. Techniques such as volumetric‐modulated arc therapy, intensity‐modulated radiation therapy, and interstitial high dose‐rate brachytherapy paired with image guidance have allowed for highly conformal doses, 1 , 2 leading to tighter margins 3 around the targets and adaptation of hypofractionation. 4 However, complex processes are vulnerable to sources of error potentially harmful to the patient, and with high dose per fraction treatments a single error can have a large impact to overall dose. Thus, the International Atomic Energy Agency has recommended “in vivo dosimetry for routine verification of the dose delivery for all groups of patients undergoing radiotherapy.” 5
We have previously investigated GafChromic MD‐55 and EBT films (Ashland, Bridgewater, NJ, USA) for real‐time dosimetry measurements, 6 , 7 , 8 , 9 and the latter was shown to be a suitable candidate. The active component in EBT film is lithium pentacosa‐10,12‐diynoate (LiPCDA) crystals, a form of diacetylene. 10 , 11 Diacetylenes undergo a solid‐state polymerization resulting in a rapid color change induced by ionizing radiation, 6 characterized by the change in optical density (∆OD) that is correlated with the radiation dose. 12 , 13 Variation in monomer packing within the diacetylenes affects dose–response 14 as well as other parameters, such as location of main absorbance peak within the spectrum (λ max), a shift in λ max with dose, and post‐irradiation darkening. 15 The LiPCDA crystal, “hair‐like” in structure, 7 used in EBT‐3 film undergoes a radiation‐induced polymerization resulting in an absorbance spectrum with the major peak at ∼635 nm. 13 , 16 , 17 However, we have previously shown that LiPCDA crystals can have an alternate form, with an absorbance peak occurring at ∼674 nm, 18 achieved through either desiccation of commercial EBT‐3 or through direct formulation.
A previous study 19 has examined the effects of water in the binder of GafChromic films, showing that the OD changes upon increasing water content in the binder material. Since the radiochromic monomer crystal in EBT‐3 already contains water, 18 , 20 the crystal structure of the LiPCDA does not change upon water exposure. However, the effect of removing water from the radiochromic monomer crystal in EBT‐3 film on dosimetric properties has not been studied previously.
This manuscript focuses on the form achieved through desiccation, termed DesEBT‐3 throughout, and we aim to investigate the spectral response to dose of DesEBT‐3. Based on previous observations, 18 we hypothesize that DesEBT‐3 will differ in its response to dose compared to the commercial EBT‐3. Specifically, without changing the chemistry of the monomers (LiPCDA), the dose–response is altered through a difference in packing structure and monomer separation due to removal of a water molecule that was incorporated into the crystal. We further hypothesize that DesEBT‐3 may be used to expand dosimetric applications by incorporating both forms into the same optical fiber dosimeter, thus improving the current single measurement point prototype. 21 , 22
2. MATERIALS AND METHODS
2.1. Modification of EBT‐3 film
Each EBT‐3 film (two from each lot, nos. 03111902 and 01142103, see Table 1) was cut into two halves. Half was left unaltered and stored in a light safe box, and later used to cut pieces of commercial EBT‐3 films. The second half had the radiochromic material exposed by peeling of a layer of polyester. Our previous work demonstrated that unlaminated EBT film (2.5 cm × 2.5 cm) was desiccated after 5 h at 50°C, as demonstrated qualitatively through spectroscopy. 18 In the current experiments, the delaminated half of the film was further cut into 5 cm × 3 cm pieces and desiccated in an oven at 45°C with ∼10 g of calcium chloride desiccant over 10 days. Three separate 5 cm × 3 cm pieces from each lot were also weighed on a microbalance (Sartorius ENTRIS124‐1S, Sartorius Lab Instruments GmbH, Goettingen, Germany) over a period of 10 days to assess both time to reach stable mass and variability in mass lost. Immediately prior to irradiation, the films (EBT‐3 and DesEBT‐3) were cut into ∼1 cm × 1 cm pieces. A single 5 cm × 5 cm piece of film (film 1, lot no. 03111902) was desiccated for scanning electron microscopy (SEM) imaging (see Section 2.3).
TABLE 1.
Summary of experimental design (N = 5 for each measurement checked in gray)
| Dose (cGy) | |||||||||||||
|---|---|---|---|---|---|---|---|---|---|---|---|---|---|
| EBT‐3 lot # | Film # | Film type | 0 | 50 | 100 | 200 | 500 | 1000 | 2000 | 3000 | 4000 | 5000 | 7000 |
| 03111902 | 1 | EBT‐3 | |||||||||||
| DesEBT‐3 | |||||||||||||
| 2 | EBT‐3 | ||||||||||||
| DesEBT‐3 | |||||||||||||
| 1 | EBT‐3 and DesEBT‐3 | ||||||||||||
| 01142103 | 1 | EBT‐3 | |||||||||||
| DesEBT‐3 | |||||||||||||
| 2 | EBT‐3 | ||||||||||||
| DesEBT‐3 | |||||||||||||
2.1.1. Optical measurement
All measurements were obtained using a custom 30 cm × 30 cm × 4 cm Solid Water phantom, with 10 cm of backscatter. The phantom holds the sample film along the LINAC beam's central axis, with the point of optical measurement at a depth of 1.5 cm. 8 Two (1500 μm/1550 μm) (core/cladding diameter) optical fibers at 1.5 cm depth in the phantom, perpendicular to the film, were allowed for real‐time transmission spectroscopy. Light source and spectrophotometer are connected to the optical fibers in the phantom through ∼17 m of fused silica fiber (600 μm/630 μm core/cladding diameter, Thorlabs, Newton, NJ, USA) and SubMiniature A (SMA) connector. The light source is a broad spectrum (360–2400 nm) tungsten halogen source (5 W HL‐2000‐FHSA, Ocean Optics Inc., Orlando, FL, USA), and the spectrophotometer is a 200–1100 nm range charge‐couple device (CCD) camera (USB4000, Ocean Optics Inc.). Figure 1 shows a schematic diagram of the complete measurement setup.
FIGURE 1.
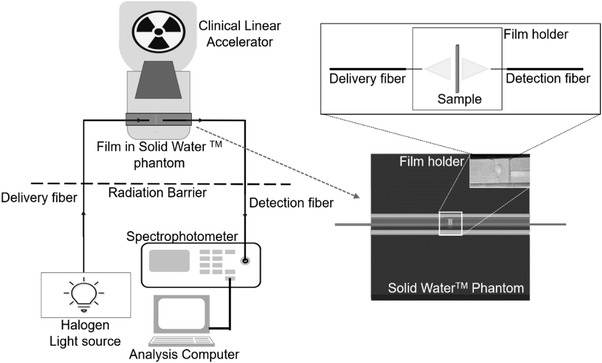
Schematic diagram of the real‐time irradiation and measurement setup. The arrow shows a close‐up top view of the fiber and film holders embedded into the phantom, with delivery and detection fibers protruding from the phantom. A magnified view of the film holder demonstrates the light path through the sample film
Spectra (346–1000 nm) of light transmitted through the film sample was continuously measured at ∼1 Hz prior to, during, and after irradiation with 6 MV beam. For post‐exposure development experiments, spectra were collected for ∼60 min after exposure. Spectral data were processed after completion of experiments using MATLAB v 2018b or 2020b (MathWorks, Natick, MA, USA).
The change in absorbance (∆A) is calculated using Equation (1):
| (1) |
where is the intensity with light source on at wavelength of unirradiated film collected before the X‐ray beam was turned on, is the dark intensity due to stray light collected by spectrophotometer when light source is off, and is the transmitted light intensity collected before, during, and after exposure. The ∆OD, as shown in Equation (2), is then calculated by integrating the absorbance over a 10 nm band around the main absorbance peak: 6 , 9
| (2) |
where to spans the 10 nm window. A schematic of ∆OD as a function of time is shown in Figure 2 with three distinct sections: (a) pre‐irradiation, (b) during irradiation, and (c) post‐irradiation. The ∆OD for a given dose is the value at the sharp change between sections b and c, occurring at the end of the beam delivery. The uncertainty in average ∆OD is reported as a percent standard deviation (), determined by Equation (3):
| (3) |
where is the mean ∆OD of the sample set. Saturation in absorbance is reached when the transmitted photons through irradiated film (I data) are within noise (∼218 counts using spectrometer 300:1 signal‐to‐noise (SN) ratio at maximum intensity) of the dark counts (I dark). At best case scenario of I ref being maximized to 216 of spectrometer upper range through adjustment of integration time, this results in absorbance of ∼log(216)(218) = 2.48. Since the ΔOD is calculated using the narrow 10 nm band around the main absorbance peak where transmitted light decreases most rapidly with dose, saturation of ΔOD is also taken to be at ∼2.5.
FIGURE 2.
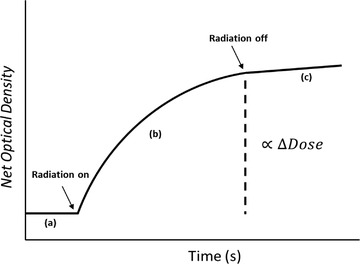
A model representation of the optical density change as a function of time. Segment a is the time before irradiation; the irradiation is applied for some time, depicted by segments b and c is the time after irradiation
2.1.2. Dose delivery
Films were irradiated within the custom phantom (Section 2.1.1) with a 6 MV X‐ray beam from a Varian True Beam linear accelerator (Varian Medical Systems, Palo Alto, CA, USA) to 50–7000 cGy (see Table 1) at 300 cGy/min under standard conditions (100 cm source‐to‐axis distance, 10 cm × 10 cm field size). LINAC output was verified using an ion chamber measurement and our institutional clinical protocol prior to sample irradiation. Five pieces of film were used for each dose. EBT‐3 films were not irradiated above 3000 cGy as they reached saturation of ΔOD >2.5 by this dose.
Calibration curves for both DesEBT‐3 and EBT‐3 were generated from plots of ∆OD as a function of absorbed dose. The third‐order polynomial function, 9 , 23 , 24 of the form shown in Equations (4) and (5), was used:
| (4) |
| (5) |
where D is the total dose in cGy delivered and p1–p8 are coefficients determined experimentally by fitting the polynomial to the calibration curves established using the film pieces mentioned in the first two rows of Table 1. Intra‐ and inter‐batch comparison was made for films irradiated to 500 cGy (see Table 1), including those used as part of the calibration.
The continual darkening of radiochromic film is a potential point of concern for both traditional 25 and real‐time dosimetry. 6 , 9 Due to difficulties in teasing out this information during irradiation, this is assessed by measuring the extent of ΔOD increase after the end of exposure as a function of time. 9 The ratio between ∆OD at the point of radiation off and ∆OD in segment c, shown in Figure 2, is used as a surrogate measure of kinetics during exposure, referred to as post‐exposure kinetics. The percent increase in ∆OD in the post‐irradiation segment c was measured for ∼1 h after exposure to 200 cGy for both commercial and desiccated films.
2.2. Dosimetry using combined EBT‐3 and DesEBT‐3 films
We investigated combining two forms of radiochromic films into the same dosimetry system by placing them in series. The light path is directed through both films from the delivery fiber to the detection fiber. Since the absorbance of each film is additive, the total change in optical density at any given wavelength range is given by Equation (6),
| (6) |
where is the change optical density measured for the combined absorbance spectra calculated using Equation (2). Using the calibration data of EBT‐3 and DesEBT‐3, curves for each were fitted both at 630–640 nm and 670–680 nm, corresponding to main absorbance bands of EBT‐3 and DesEBT‐3, respectively. Using the two bands of 630–640 nm and 670–680 nm then, we have two equations of ∆OD (Equation (6)) with two unknown doses received by EBT‐3 and DesEBT‐3, and therefore the values of two doses can be mathematically solved for. In a simplest iteration illustrated here as proof‐of‐concept, the films are placed face to face in the film holder, thus receiving the same dose, reducing the problem to two equations and one unknown. The dose is then determined by solving the third‐order polynomial shown in Equation (7), which we have done at each wavelength band.
| (7) |
The solution to Equation (7) is then determined iteratively using the fitted coefficients.
The combined films were exposed to 100–3000 cGy (see Table 1) using a 6 MV beam at 300 cGy/min dose rate and calculated dose from Equation (7) using each of the bands was compared to nominal dose. For comparison, only one calibration curve (Equations (4) and (5)), and the respective main absorbance peaks, were used as well. Since the second film is not being taking into consideration, but is contributing to ΔOD, the measured dose is hypothesized to be overestimated, with a greater residual error than when both films are considered.
2.3. Scanning electron microscope imaging
To prepare the films for SEM, 5 cm × 5 cm (each subdivided further into ∼1 cm × 1 cm pieces) pieces of film were cut from both the DesEBT‐3 and commercial EBT‐3 films. These were placed into a beaker in a hot water bath at ∼45°C and stirred for 2–3 h. This process dissolved the binder and separated the coating from the polyester substrate. The polyester pieces were picked out, and the remaining contents of each beaker were then poured onto filter paper (Whatman™, particle retention >11 μm) and left to dry for 3–4 days. The LiPCDA crystal powder was then scraped off the filter paper, placed onto SEM stubs and imaged under high vacuum with an accelerating voltage of 10 kV (SEM, Quanta™, Thermo Fisher Scientific™, Waltham, MA, USA).
3. RESULTS
3.1. Verification of desiccation
Percent mass normalized to the value on day 0, as a function of number of days in the oven, is shown in Figure 3. The error bars represent propagated uncertainty from the microbalance (±0.1 mg), where starting masses were ∼300 mg for the films. A plateau in mass was achieved by 10 days time. A one‐way analysis of variance (ANOVA) comparing all groups could not show the differences between films to be statistically significant (p >> 0.05).
FIGURE 3.
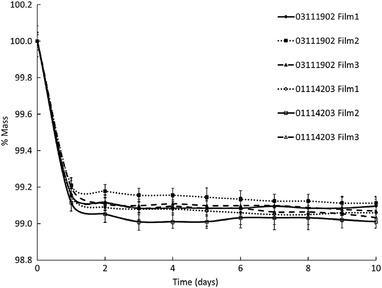
Percent mass of 5 cm × 3 cm pieces of EBT‐3 film as a function of time in days in the oven desiccator. The error bars are the propagated uncertainty from the microbalance
Absorbance spectra of commercial EBT‐3 and DesEBT‐3 films after 5 Gy dose are shown in Figure 4. The peak absorbance for commercial EBT‐3 film occurred at the expected wavelength of ∼635 nm. DesEBT‐3 peak absorbance occurred at ∼675 nm with a shoulder peak at ∼620 nm, similarly to pentacosa‐10,12‐diynoic acid (PCDA)‐based films like the commercial MD‐55. 6 , 12 , 26 The shift of the main absorbance peak from 635 to 675 nm, and the absence of residual second peak at 635 nm, 18 shows that most or all of the LiPCDA crystals have been converted to the desiccated form.
FIGURE 4.
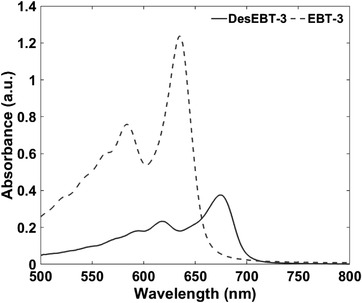
Change in absorbance of DesEBT‐3 and commercial EBT‐3 film after 500 cGy irradiation with 6 MV beam
3.2. Dose–response of DesEBT‐3
The ∆OD versus dose for both EBT‐3 and DesEBT‐3 films (taken from one film, lot no. 03111902, see Table 1) is shown in Figure 5. Table 2 summarizes the percent standard deviation for each film type at all nominal doses, and the residual between the data and the calibration curve. Commercial EBT‐3 film reached saturation of our experimental setup between 20 and 30 Gy. DesEBT‐3 results demonstrated lower dose sensitivity than EBT‐3, while maintaining non‐linear response over the dose range tested.
FIGURE 5.
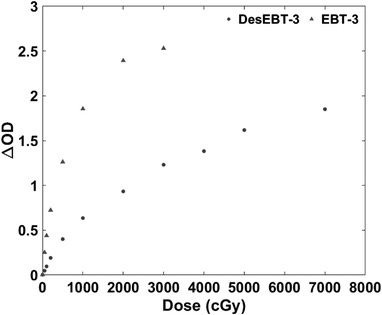
∆OD as a function of dose for EBT‐3 and DesEBT‐3 films. The calibration curves are generated using the respective main absorbance peaks (630–640 nm for EBT‐3 films, and 670–680 nm for DesEBT‐3 films)
TABLE 2.
Percent standard deviation (%σ) of dose measurement with N = 5 independent samples and the residual error in ∆OD between the data and the calibration curve (data point being greater than fit is denoted as positive residual, and lower than fit as negative residual)
| Dose (cGy) | ||||||||||
|---|---|---|---|---|---|---|---|---|---|---|
| 50 | 100 | 200 | 500 | 1000 | 2000 | 3000 | 4000 | 5000 | 7000 | |
| %σ EBT‐3 | 1.4 | 0.7 | 0.4 | 0.8 | 0.6 | 0.2 | 0.4 | – | – | – |
| Res (in ∆OD) | 0.0008 | 0.05 | 0.09 | 0.007 | −0.07 | 0.03 | −0.006 | |||
| %σ DesEBT‐3 | 4.9 | 2.6 | 1.5 | 1 | 2.8 | 1.9 | 2.2 | 2.2 | 1.5 | 0.5 |
| Res (in ∆OD) | −0.03 | −0.01 | 0.02 | 0.06 | 0.04 | −0.04 | −0.01 | −0.04 | 0.06 | −0.01 |
Table 3 shows ΔOD for five samples taken from two different films in each of the two lots tested. DesEBT‐3 consistently demonstrates lower change in optical density as a function of dose, although the exact ratio differed between films and lots (p < 0.05 for both intra‐ and inter‐lot comparison, using two‐way ANOVA).
TABLE 3.
Inter‐ and intra‐lot comparison for films irradiated to 500 cGy (N = 5 independent samples)
| Lot # | Film # | 〈ΔOD〉 EBT‐3 | %σ | 〈ΔOD〉 DesEBT‐3 | %σ | Ratio 〈ΔOD〉 (DesEBT‐3/EBT‐3) | %σ |
|---|---|---|---|---|---|---|---|
| 03111902 | 1 | 1.26 | 0.8 | 0.40 | 1.0 | 0.32 | 1.3 |
| 2 | 1.21 | 2.0 | 0.30 | 1.2 | 0.25 | 2.4 | |
| 01142103 | 1 | 1.25 | 0.5 | 0.31 | 2.3 | 0.25 | 2.4 |
| 2 | 1.25 | 0.3 | 0.32 | 1.3 | 0.26 | 1.4 |
Figures 6 and 7 demonstrate a shift in λ max for DesEBT‐3 above 500 cGy, and no shift for EBT‐3 film.
FIGURE 6.
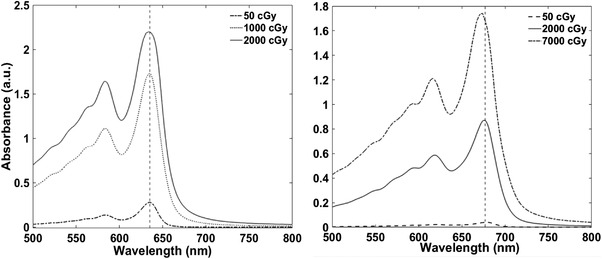
Sample absorbance spectra of EBT‐3 (left) and DesEBT‐3 (right) with a vertical dashed line at 635 and 677 nm, respectively
FIGURE 7.
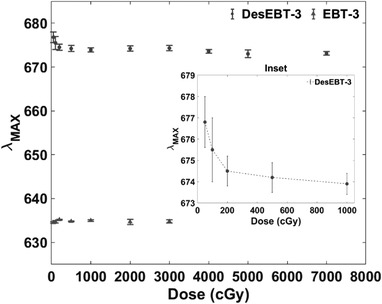
Wavelength at peak absorbance against total nominal dose delivered for N = 5 film samples (0–30 Gy for EBT‐3 and 0–70 Gy for DesEBT‐3). Error bars represent 1σ standard deviation. The inset figure shows the initial decrease in λ max with the dose of DesEBT‐3
Figure 8 shows the percent increase in ∆OD over time after exposure to 200 cGy for a single sample of EBT‐3 and DesEBT‐3. A summary of the post‐exposure percent increase in ∆OD for both films, along with p‐values, is shown in Table 4. Results show an average (N = 5 independent samples) of 5.0 ± 0.1% increase in OD after 1 min and 29.2 ± 0.3% after 60 min following exposure for EBT‐3, while the DesEBT‐3 had a 3.7 ± 0.1% at 1 min and 25.2 ± 3.8% after ∼1 h.
FIGURE 8.
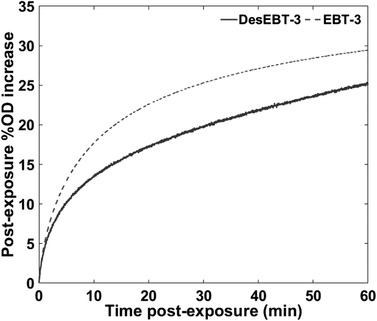
Percent change in ∆OD for N = 1 sample each, exposed with a 6 MV beam to 200 cGy at a 300 cGy/min. Data were continually collected for ∼1 h after exposure
TABLE 4.
Percent increase in ∆OD for EBT‐3 and DesEBT‐3 with N = 5 samples averaged at specific time points after exposure
| Time (min) | EBT‐3 | DesEBT‐3 | p‐Value |
|---|---|---|---|
| 1 | 5.0 ± 0.1 | 3.8 ± 0.1 | 0.0000006 |
| 5 | 13.3 ± 0.3 | 9.6 ± 0.6 | 0.00003 |
| 10 | 18.2 ± 0.4 | 12 ± 1 | 0.0002 |
| 15 | 21.1 ± 0.5 | 15 ± 2 | 0.0006 |
| 30 | 25.7 ± 0.6 | 20 ± 3 | 0.006 |
| 60 | 29.9 ± 0.6 | 26 ± 4 | 0.1 |
3.3. Dosimetry using combined EBT‐3 and DesEBT‐3 films
The absorbance spectrum of the EBT‐3 and DesEBT‐3 measured using a single optical path is shown in Figure 9, qualitatively appearing as a sum of the spectra from individual films.
FIGURE 9.
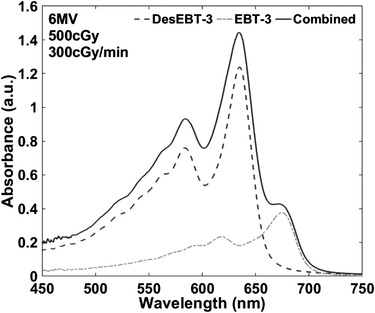
Absorbance spectra of combined EBT‐3 and DesEBT‐3 films in single optical path (solid) and independent absorbance spectra of EBT‐3 (dash) and DesEBT‐3 (dash‐dot) after exposure to 500 cGy with a 6 MV beam at a 300 cGy/min, shown for comparison
Using ∆OD630–640 nm and ∆OD670–680 nm calibration curves generated for each film type, EBT‐3 and DesEBT‐3, as a function of dose, coefficients were determined using Equations (4) and (5). Since the films were irradiated to the same dose, using the simplified two equations and one unknown, the calibration curves were used with Equation (7) to calculate the dose received by the films. Although this could have been done at either wavelength band because of one unknown, we performed the calculation at both wavelength bands as shown in Table 5. The combined film data were also interpreted using only the calibration curve of a single film and ignoring the contribution to ∆OD from the second film. For 630–640 nm band, calibration curve of EBT‐3 film was used; for 670–680 nm band, calibration curve of DesEBT‐3 film was used. Consistently, using only EBT‐3 film calibration to calculate dose of two films showed a higher predicted dose compared to that delivered, and compared to that calculated using both calibration curves. For 670–680 nm, the calculated dose using only DesEBT‐3 film calibration curve was also higher than that computed using both films, and higher than actual delivered dose for all but 100 cGy.
TABLE 5.
Summary of calculated dose and percent difference to the actual dose delivered using Equation (7) for combined films, and Equations (4) and (5) for calibration curves at main absorbance peaks of DesEBT‐3 and EBT‐3, respectively
| 630−640 nm | 670−680 nm | |||||||
|---|---|---|---|---|---|---|---|---|
| Delivered dose (cGy) | Calculated dose (cGy) Equation (7) | %Diff | Calculated dose (cGy) Equation (5) | %Diff | Calculated dose (cGy) Equation (7) | %Diff | Calculated dose (cGy) Equation (4) | %Diff |
| 100 | 100.8 | +0.8 | 119.5 | +19.5 | 81.9 | −18.1 | 94.5 | −5.5 |
| 500 | 504.3 | +0.9 | 629.1 | +25.8 | 566.8 | +13.4 | 689.8 | +38.0 |
| 1000 | 863.0 | −13.7 | 1201.9 | +20.2 | 1031.0 | +3.1 | 1305.9 | +30.6 |
| 2000 | 1281.7 | −35.9 | 3030.6 | +51.5 | 2075.5 | +3.8 | 3001.5 | +50.1 |
| 3000 | 1505.2 | −49.8 | 3418.0 | +13.9 | 2872.0 | −4.3 | 4888.7 | +63.0 |
Note: An overestimate of dose is denoted as positive percent difference, and an underestimate as negative.
3.4. Macroscopic crystal structure comparison
Electron micrographs (Figure 10) show a qualitative comparison of the overall structures at 2500× magnification and 10.00 kV accelerating voltage. Crystals from DesEBT‐3 films did not show any notable difference in crystal morphology compared to the LiPCDA crystals in commercial film. They maintained an aspect ratio greater than 10:1, with no notable fragmentation due to the desiccation even when viewed at 25 000× magnification (not shown).
FIGURE 10.
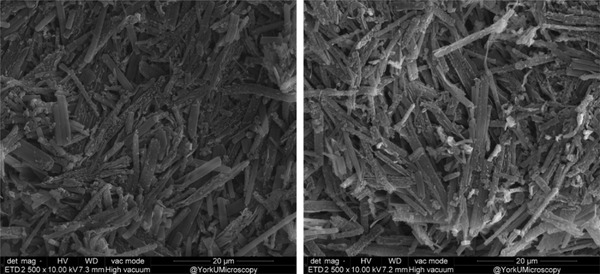
Scanning electron microscopy (SEM) images of DesEBT‐3 (left) and commercial EBT‐3 (right) with binder removed. Images were taken at 2500× magnification
4. DISCUSSION
The lack of change in crystal shape and size as observed on SEM images accompanied with a shift in the main absorbance peak suggests that while removing the water alters the monomer packing, it does so without fragmenting the macroscopic structure. This causes a decreased change in optical density with dose, likely at least in part due to altered distance in between monomers within a crystal. The exact percent decrease in ∆OD varied between pieces of films from different lots, as shown in Table 3, based on the difference in history of the individual pieces of film (film 1 from lot no. 03111902 was desiccated separately from the others). The impact of film history on dose response is not unique to the DesEBT‐3, as commercial radiochromic films have been shown to be sensitive to storage conditions. 27 , 28 There was also an observed increase in uncertainty in ∆OD of desiccated films (Tables 2, 3, 4). This may be due to some water molecules remaining within the crystal despite the films reaching a plateau in mass (Figure 3), and acting as an impurity to an otherwise desiccated structure. If so, this would affect polymerization and thus measured response to dose.
The ∆OD remained non‐linear with dose contrary to our hypothesis. The presence of Li+ in both forms of EBT‐3 causes deviation from signal linearity which was not observed with predecessor films using PCDA until at least 20 Gy using the same irradiation and read‐out methods. 6 Similarly to PCDA‐based radiochromic films, 29 a shift in λ max for DesEBT‐3 was observed, indicating a small reorientation of the polymer backbone. In contrast, EBT‐3 with water still present in the crystal maintained a constant λ max over the range tested, in agreement with previously published data that used the same radiosensitive material. 7
In Table 4, a t‐test to compare percent change in optical density after irradiation showed statistically insignificant difference at ∼1 h (α = 0.05) between EBT‐3 and DesEBT‐3 due to the increased uncertainty in the ∆OD of DesEBT‐3. However, at times <1 h, the percent increase in ∆OD was significantly greater for commercial EBT‐3 film. This is an unexpected result given that EBT‐3 previously showed faster polymerization than PCDA‐based MD‐55, 7 and we hypothesized desiccated LiPCDA to pack similarly as PCDA. To make a definitive conclusion, repeat post‐exposure data needs to be collected over a longer period of time (>1 h) and also at expanded dose and dose‐rate ranges.
When two films are used in the same optical path, but only one calibration curve is utilized (Equation (4) or (5)), the calculated dose is consistently higher than when both EBT‐3 and DesEBT‐3 are taken into consideration (Equation (7)) (see Table 5). Simply, it is because the contribution of second film to total ΔOD is not being accounted for. In most cases, this had led to a higher percent error between true dose and calculated dose, with the exception of 3000 cGy using EBT‐3 peak and calibration, and 100 cGy using DesEBT‐3 peak and calibration. The calibration curve for DesEBT‐3 film has a negative residual error (see Table 2), resulting in an overestimate of ΔOD and an underestimate of dose when DesEBT‐3 film is used with the corresponding calibration equation. However, when given a higher value of ΔOD with unaccounted extra film (as in Table 5), the underestimate of dose becomes lower. Hence, using just the DesEBT‐3 film calibration and 670–680 nm band for 100 cGy resulted in smaller percent error between calculated and delivered dose. For the 3000 cGy dose, using 630–640 nm band and EBT‐3 film calibration curve (Equation (5)) overestimates the dose compared to actual dose, but has smaller percent error. This is because the combined ΔOD from the two films at this dose has already saturated the detector (ΔOD for EBT‐3 and DesEBT‐3 films alone at 630–640 nm is 2.53 and 0.72, respectively). At this point, ΔOD is no longer additive because of the saturation. Hence, ignoring the contribution of the DesEBT‐3 film and only interpreting the data using EBT‐3 film calibration curve results in a better estimate.
On the other hand, dose calculated using both EBT‐3 and DesEBT‐3 in a single optical path showed reasonable agreement (within 1%) up to 500 cGy when the 630–640 nm absorbance window was used. At doses 10 Gy and above, this band led to under‐reporting of dose due to approaching saturation for combined absorbance in this part of the spectrum. However, switching to 670–680 nm band allowed for agreement between delivered and calculated dose within 5% error. These results may be improved with selecting other diacetylene crystals with polymer absorbance peaks that are further spectrally separated, and by optimizing the thickness of each material within the optical fiber to achieve a desired sensitive and dynamic range. Since we were working with commercial materials here, neither spectral peak location nor thickness was optimized in this proof‐of‐concept experiment. Given the high dependence of DesEBT‐3 film on its history, this material is a rather poor candidate for multi‐point measurements. However, another form of LiPCDA absorbing at ∼675 nm, 18 , 20 , 30 which has yet to be fully characterized, can be potentially used instead.
The above results strongly suggest that water is integrated into the crystal structure, altering the monomer packing, and removal of it via desiccation has an effect on dosimetric parameters of relevance to traditional and real‐time dosimetry use. This is corroborated by the Fourier transform infrared spectroscopy and thermogravimetric analysis experiments showing that the commercial EBT‐3 film consists of monohydrated form of LiPCDA and dehydration results in the loss of one water molecule per monomer, converting LiPCDA to another form. 20
Co‐crystallization of PCDA with other molecules besides water has been demonstrated, with some yielding radiation sensitive forms. 31 Co‐crystals of other diacetylenes besides PCDA may also be possible, opening the door to a selection of different monomer crystals with spread out absorbance bands and optimal dosimetric parameters, and which may be incorporated into a single optical fiber for multi‐point measurements.
5. CONCLUSIONS
The active material of DesEBT‐3 film was observed by SEM to be structurally indistinguishable from the active material in the commercial EBT‐3 form but showed spectral and dosimetric differences. Specifically, the main absorbance peak of the resulting polymer in DesEBT‐3 film shifted to ∼675 nm, resulting film yielded lower ∆OD with dose, λ max shifted with increasing dose, and post‐irradiation growth in ∆OD may have been altered. These results indicated that water is an integral part of the diacetylene crystal structure and removing it through desiccation changes the monomer packing, as demonstrated through changes in spectral and dosimetric parameters. Incorporating two distinct forms of diacetylenes into a single optical path allowed dose measurements from individual absorbance bands with limitations, which may be solved with optimized selection of diacetylenes and material thicknesses for use over a desired dose range.
CONFLICT OF INTEREST
The authors declare no conflicts of interest.
ACKNOWLEDGMENTS
Funding for this work was provided by Canadian Institutes of Health Research (CIHR), grant number PJT 162294, the Strategic Training in Transdisciplinary Radiation Science for the 21st Century Program (STARS21), Department of Radiation Oncology, University of Toronto, and Mitacs Research Training Award. SEM data were acquired at the Advanced Light and Electron Microscopy Facility (@YorkUMicroscopy) at York University. The authors would like to thank Dr. David Lewis for all his insight and input.
Kaiyum R, Schruder CW, Mermut O, Rink A. Role of water in the crystal structure of LiPCDA monomer and the radiotherapy dose response of EBT‐3 film. Med Phys. 2022;49:3470–3480. 10.1002/mp.15597
Alexandra Rink and Ozzy Mermut should be considered joint senior author.
Contributor Information
Ozzy Mermut, Email: omermut@yorku.ca.
Alexandra Rink, Email: Alexandra.Rink@rmp.uhn.ca.
REFERENCES
- 1. Teoh M, Clark CH, Wood K, Whitaker S, Nisbet A. Volumetric modulated arc therapy: a review of current literature and clinical use in practice. Br J Radiol. 2011;84(1007):967‐996. 10.1259/bjr/22373346 [DOI] [PMC free article] [PubMed] [Google Scholar]
- 2. Li Y, Wang J, Tan L, et al. Dosimetric comparison between IMRT and VMAT in irradiation for peripheral and central lung cancer. Oncol Lett. 2018;15(3):3735‐3745. 10.3892/ol.2018.7732 [DOI] [PMC free article] [PubMed] [Google Scholar]
- 3. Kron T. Reduction of margins in external beam radiotherapy. J Med Phys. 2008;33(2):41‐42. 10.4103/0971-6203.41190 [DOI] [PMC free article] [PubMed] [Google Scholar]
- 4. Linus CB, Tree AC, Dearnaley DP. The role of hypofractionated radiotherapy in prostate cancer. Curr Oncol Rep. 2017;19:30. 10.1007/s11912-017-0584-7 [DOI] [PMC free article] [PubMed] [Google Scholar]
- 5.IAEA. Development of Procedures for In Vivo Dosimetry in Radiotherapy. International Atomic Energy Agency; 2013. https://www.iaea.org/publications/8962/development‐of‐procedures‐for‐in‐vivo‐dosimetry‐in‐radiotherapy [Google Scholar]
- 6. Rink A, Vitkin IA, Jaffray DA. Suitability of radiochromic medium for real‐time optical measurements of ionizing radiation dose: radiochromic medium in real‐time measurements of radiation dose. Med Phys. 2005;32(4):1140‐1155. 10.1118/1.1877832 [DOI] [PubMed] [Google Scholar]
- 7. Rink A, Vitkin IA, Jaffray DA. Characterization and real‐time optical measurements of the ionizing radiation dose response for a new radiochromic medium: real‐time optical measurements of new radiochromic medium. Med Phys. 2005;32(8):2510‐2516. 10.1118/1.1951447 [DOI] [PubMed] [Google Scholar]
- 8. Rink A, Vitkin IA, Jaffray DA. Energy dependence (75kVp to 18MV) of radiochromic films assessed using a real‐time optical dosimeter: energy dependence of radiochromic films in real‐time measurements. Med Phys. 2007;34(2):458‐463. 10.1118/1.2431425 [DOI] [PubMed] [Google Scholar]
- 9. Rink A, Vitkin IA, Jaffray DA. Intra‐irradiation changes in the signal of polymer‐based dosimeter (GAFCHROMIC EBT) due to dose rate variations. Phys Med Biol. 2007;52(22):N523‐N529. 10.1088/0031-9155/52/22/N03 [DOI] [PubMed] [Google Scholar]
- 10. Baughman RH. Solid‐state synthesis of large polymer single crystals. J Polym Sci Polym Phys Ed. 1974;12(8):1511‐1535. 10.1002/pol.1974.180120801 [DOI] [Google Scholar]
- 11. Anyumba J, Lewis DF, Shih HY, Yu X. Lithium salt of polyacetylene as radiation sensitive filaments and preparation and use thereof. US patent 7,445,880 B2. November 4, 2008..
- 12. Niroomand‐Rad A, Blackwell CR, Coursey BM, et al. Radiochormic film dosimetry: recommendations of AAPM Radiation Therapy Committee Task Group 55. Med Phys. 1998;25(11):2093‐5115 [DOI] [PubMed] [Google Scholar]
- 13. Niroomand‐Rad A, Chiu‐Tsao S‐T, Grams MP, et al. Report of AAPM Task Group 235 radiochromic film dosimetry: an update to TG‐55. Med Phys. 2020;47(12):5986‐6025 [DOI] [PubMed] [Google Scholar]
- 14. Enkelmann V. Structural aspects of the topochemical polymerization of diacetylenes. In: Advances in Polymer Science. Vol 63. Springer‐Verlag; 1984:91‐136. [Google Scholar]
- 15. Patel GN, Miller GG. Structure–property relationships of diacetylenes and their polymers. J Macromol Sci Part B. 1981;20(1):111‐131 [Google Scholar]
- 16. León‐Marroquín EY, Camacho‐López MA, García‐Garduño OA, et al. Spectral analysis of the EBT3 radiochromic film irradiated with 6 MV X‐ray radiation. Radiat Meas. 2016;89:82‐88. 10.1016/j.radmeas.2016.03.007 [DOI] [Google Scholar]
- 17. León‐Marroquín EY, Mulrow DJ, Khan R, Darafsheh A. Spectral analysis of the EBT3 radiochromic films for clinical photon and electron beams. Med Phys. 2019;46(2):973‐982. 10.1002/mp.13330 [DOI] [PubMed] [Google Scholar]
- 18. Rink A, Lewis DF, Varma S, Vitkin IA, Jaffray DA. Temperature and hydration effects on absorbance spectra and radiation sensitivity of a radiochromic medium. Med Phys. 2008;35(10):4545‐4555. 10.1118/1.2975483 [DOI] [PMC free article] [PubMed] [Google Scholar]
- 19. León‐Marroquín EY, Lárraga‐Gutiérrez JM, Herrera‐González JA, et al. Investigation of EBT3 radiochromic film's response to humidity. J Appl Clin Med Phys. 2018;19(3):283‐290. 10.1002/acm2.12337 [DOI] [PMC free article] [PubMed] [Google Scholar]
- 20. Hall AV, Musa OM, Hood DK, Apperley DC, Yufit DS, Steed JW. Alkali metal salts of 10,12‐pentacosydiynoic acid and their dosimetry applications. Cryst Grow Des. 2021;21:2416‐2422 [DOI] [PMC free article] [PubMed] [Google Scholar]
- 21. Croteau A, Caron S, Rink A, Jaffray D, Mermut O. Real‐time optical fiber dosimeter probe. In: Optical Fibers, Sensors and Devices for Biomedical Diagnostics and Treatment. XI Conference Proceeding, San Francisco, CA, USA. Vol 7894. SPIE; 2011:789406. 10.1117/12.873619 [DOI] [Google Scholar]
- 22. Croteau A, Caron S, Rink A, Jaffray D, Mermut O. Fabrication and characterization of a real‐time optical fiber dosimeter probe. In: European Conferences on Biomedical Optics Conference Proceedings, Munich, Germany: (SPIE‐OSA). Vol 8090. SPIE; 2011.. [Google Scholar]
- 23. Devic S, Seuntjens J, Sham E, Podgorsak EB. Precise radiochromic film dosimetry using a flat‐bed document scanner. Med Phys. 2005;32(7):2245‐2253 [DOI] [PubMed] [Google Scholar]
- 24. Tagiling N, Ab Rashid R, Ashan SNA, Dollah N, Geso M, Rahman WN. Effect of scanning parameters on dose–response of radiochromic films irradiated with photon and electron beams. Heliyon. 2018;4(10):e00864. 10.1016/j.heliyon.2018.e00864 [DOI] [PMC free article] [PubMed] [Google Scholar]
- 25. Ali I, Costescu C, Vicic M, Dempsey JF, Williamson JF. Dependence of radiochromic film optical density post‐exposure kinetics on dose and dose fractionation. Med Phys. 2003;30(8):1958‐1967. 10.1118/1.1587611 [DOI] [PubMed] [Google Scholar]
- 26. Klassen NV, van der Zwan L, Cygler J. GafChromic MD‐55: investigated as a precision dosimeter. Med Phys. 1997;24(12):1924‐1934. 10.1118/1.598106 [DOI] [PubMed] [Google Scholar]
- 27. Niroomand‐Rad A, Blackwell CR, Coursey BM, et al. Radiochromic film dosimetry: recommendations of AAPM Radiation Therapy Committee Task Group 55. Med Phys. 1998;25(11):2093‐2115 [DOI] [PubMed] [Google Scholar]
- 28. Girard F, Bouchard H, Lacroix F. Reference dosimetry using radiochromic film. Med Phys. 2012;13(6):339‐353. [DOI] [PMC free article] [PubMed] [Google Scholar]
- 29. McLaughlin WL, Yun‐Dong C, Soares CG, Miller A, Van Dyk G, Lewis DF. Sensitometry of the response of a new radiochromic film dosimeter to gamma radiation and electron beams. Nucl Instrum Meth Phys Res. 1991;A302:165‐176 [Google Scholar]
- 30. Kaiyum R, Schruder C, Mermut O, Rink A. Dosimetric behaviour of radiochromic film as a function of monomer crystal structure. Med Phys. 2020;47(6):e280. [Google Scholar]
- 31. Hall AV, Yufit DS, Apperley DC, et al. The crystal engineering of radiation‐sensitive diacetylene cocrystals and salts. Chem Sci. 2020;11:8025‐8035 [DOI] [PMC free article] [PubMed] [Google Scholar]